 Open Access Article
Creative Commons Attribution 3.0 Unported Licence
First example of a non-toxic thermochromic polymer material – based on a novel mechanism
Arno
Seeboth
*,
Detlef
Lötzsch
and
Ralf
Ruhmann
Department of Chromogenic Polymers, Fraunhofer-Institute for Applied Polymer Research, Volmerstr. 7B, 12489 Berlin, Germany. E-mail: arno.seeboth@iap.fraunhofer.de; Tel: +49 30 6392 4258
First published on 21st February 2013
Abstract
Until now, all thermochromic materials have contained at least one toxic or carcinogenic component which is a major shortcoming for their application especially in medical or food technology products. This paper describes the development of the first non-toxic and non-carcinogenic thermochromic polymer material. The material consists of the biopolymer poly(lactic acid) (PLA), a natural dye of the anthocyanidine class, a gallate derivative and a fatty acid. The origin of the observed thermochromic effect is a conformational change of the polymer backbone which reversibly triggers the formation of polymer–dye complexes. Accordingly thermochromism represents an immanent property of the novel polymer material. The presented results establish a novel mechanism to realize the visualization of temperature changes in a way detectable by the human eye without any kind of auxiliary and provide a new approach for the development of thermochromic materials.
Introduction
The field of chromogenic materials especially the development of novel thermochromic sensor materials is moving more and more into the focus of applied research. Although thermochromism is a rare phenomenon, it appears in a wide range of material classes, e.g. liquid crystals, organic/inorganic single molecules or complexes respectively.1–3 However, until now, all known thermochromic materials contain at least one toxic or carcinogenic component which is essential for the effect and cannot be substituted by a non-toxic substance. To cite only a few examples, heavy metal salts,4,5 leuco dye systems1,2,6 which even can contain bisphenol A, derivatives of diazapentalene,7 polythiophenes8,9 or polydiacetylenes.10–13 Probably, this is the most important hindrance for their application as temperature sensors in medical or food technology products like serum and blood-packaging.The target of the present work was to address this deficiency by developing a novel thermochromic polymer containing only non-toxic components. Its thermo-optical switching effect should be easily detectable by the human eye. Moreover, the thermochromic thermoplastic polymer was aimed to be processable by extrusion technology and thus moldable to films and injection molded plastic articles. Poly(lactic acid) (PLA) was selected as a matrix polymer for filling these technological requirements and being a polymer of the future.14 Its molecular structure is displayed in Fig. 1.
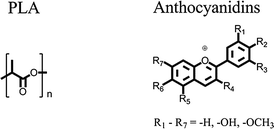 | ||
| Fig. 1 Molecular structures of PLA (left) and anthocyanidins (right). | ||
Anthocyanidins (see Fig. 1) were selected as a dye class with the potential to exhibit thermochromic switching effects. They are mostly responsible for the coloration of flowers and fruits with shades ranging from red to blue. Changes in the molecular structure of the anthocyanidin dye depending on the chemical surroundings are the origin of these color effects. In aqueous solution variations of the pH-value, the formation of chelate complexes, self-association, copigmentation and intramolecular sandwich-type stacking were identified as molecular mechanisms which all cause structural changes of the anthocyanidin dyes.15–17 Although no example of thermochromism based on anthocyanidin dyes has been reported so far, the wide range of color influencing mechanisms make this dye class a promising candidate for the creation of thermochromic effects.
Two mechanisms are known to create thermochromism of functional dyes in organic systems: (i) reversible formation of aggregates in leuco dye–developer–solvent systems to trigger a ring-opening ring-closing mechanism of the leuco dye6,18 and (ii) influencing the proton equilibrium of indicator dyes embedded in polymer networks.19–21 In the second case the polymer network is a crucial part of the thermochromic system and thus thermochromism becomes an immanent property of the polymer material whereas in the case of embedding leuco dye–developer–solvent systems in a polymer matrix the matrix has no influence on the thermochromism.22,23
Experimental
Materials
The anthocyanidin dye cyanidin chloride (from Rosa centifolia, purity > 97%) was purchased from Phytoplan. Dodecyl gallate and hexadecanoic acid were purchased from Sigma-Aldrich and the poly(lactic acid) PLA 4060D was purchased from Natureworks. PLA was dried at 45 °C for 12 h before used. All other chemicals were used as received.Characterization methods
Differential scanning calorimetric measurements were carried out by using a Perkin Elmer DSC 7. Heat flow and temperature were calibrated with indium. The sample weights ranged between 5 mg and 20 mg. Heating and cooling runs were performed at a scanning rate of 5 K min−1. For aging experiments the polymer composite samples were cooled down from 80 °C to 0 °C at a rate of 5 K min−1 and then stored at room temperature for a defined time period.Absorption spectra were measured over the range of 400 nm to 800 nm with a Jasco V-670 spectrometer.
A field emission scanning electron microscope (SEM) (JEOL JSM-6330F) with a digital image processing equipment was used to take images of the freeze fractured surface of a PLA composite. For the sample preparation the PLA composite was frozen in liquid nitrogen, fractured and afterwards coated on the surface with a 10 nm thick platinum film by sputter deposition.
A twin screw extruder ZK 25 T (Dr Collin GmbH) with co-rotating screws (diameter D = 25 mm and length L = 24D) was used to prepare the polymer composites under the following conditions: sample load: 0.5 kg h−1, temperature profile: 175 °C/185 °C/185 °C/160 °C/135 °C, screw speed: 20 rpm.
Rectangular flat polymer sheets (5 cm × 5 cm) with a thickness of 0.5 mm, 1 mm or 2 mm respectively were prepared using a laboratory press P200 P/M (Dr Collin GmbH). The sheets were pressed at a temperature of 160 °C with a pressure of 100 bar.
Results and discussion
All used additives, dodecyl gallate (E312), fatty acids (E570) and anthocyanidin dyes (E163) are approved food additives in Europe and are practically non-toxic. Poly(lactic acid) is also recognized to be non-toxic and safe for use in food-contact.14In nature anthocyanidins are found in many different forms. A representative of this dye class is cyanidin chloride.16,17 In aqueous solution three different colored species of cyanidin occur: the flavylium ion, the neutral form of the anhydrobase and the anionic form of the anhydrobase.17 Molecular structures of these three species and the pH-ranges in which they are stable are displayed in Fig. 2.
 | ||
| Fig. 2 Molecular structures of the different species of cyanidin in aqueous solution. | ||
Since the polymer composites are aimed to be prepared by melt blending, a sufficient stability of the dye during the extrusion process is a precondition for its selection. To verify the suitability of cyanidin chloride, a mixture of the dye and PLA 4060D was compounded on a twin-screw extruder. During the extrusion process the dye was dissolved in the polymer matrix and a deep violet colored PLA was obtained. Obviously the dye withstands the performed extrusion process and thus it was selected for the present study. The visible spectrum of cyanidin chloride in PLA 4060D is shown in Fig. 3a curve (I).
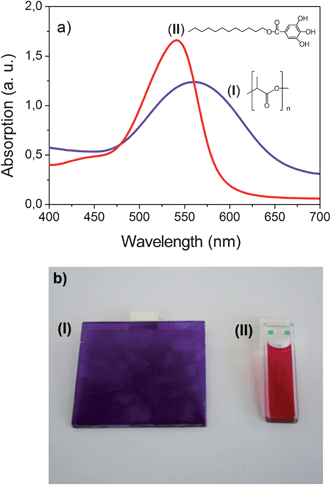 | ||
| Fig. 3 Absorption spectra (a) and photographs (b) of cyanidin chloride in PLA (I) (c = 0.213 mg g−1, T = 20 °C and d = 2 mm) and in dodecyl gallate (II) (c = 0.213 mg g−1, T = 100 °C and d = 1 mm for the spectrum and 2 mm for the photograph). | ||
As can be seen in Fig. 3a an absorption peak with a maximum at 560 nm occurs in the spectrum indicating the presence of the anionic anhydrobase form. Apparently a complex formation between PLA and cyanidin takes place by H-bonding stabilizing the anionic anhydrobase form. PLA is known to build up intermolecular interactions via H-bonding with OH groups. The polyester functions as a proton acceptor as for example with hyperbranched poly(ester amide)24 and catechin.25
Multiple examples of complex formation between gallates and organic dyes are described.2,6,26 Therefore, dodecyl gallate was selected to investigate the appearance of an aggregation/disaggregation equilibrium in binary mixtures with cyanidin chloride. The visible spectrum of cyanidin chloride in dodecyl gallate is shown in Fig. 3a curve (II).
One absorption peak with a maximum of 535 nm occurs in the visible spectrum. No indication of a complex formation between dodecyl gallate and cyanidin was found. Note that the change of the solvent from PLA to dodecyl gallate leads to a shift of the absorption peak by about 25 nm. The different absorption maxima indicate that the dye is present in its neutral anhydrobase form in dodecyl gallate solution and not in its anionic anhydrobase form as in PLA. The observed shift of the absorption peak is accompanied by a distinct color change as shown in Fig. 3b. Whereas the solution in PLA appears violet the dodecyl gallate solution possesses a deep wine red color.
On the basis of this result it can be assumed to obtain a color change of the cyanidin dye in PLA by the addition of dodecyl gallate. Balancing the aggregation/disaggregation equilibrium might lead to the observation of thermochromic effects in certain concentration ranges. The thermochromic effects are expected to appear as a continuous shift of the equilibrium from a low temperature aggregated into a high temperature disaggregated state. However, even by the addition of 5.2 wt% dodecyl gallate no change of the color occurred. Since the neutral form of the anhydrobase is stabilized against the anionic form by an acidic medium, in the next step an acid was additionally added. For this purpose the fatty acid hexadecanoic acid was used. Up to a concentration of about 2.48 wt% hexadecanoic acid with respect to the polymer mass, the additive dissolves in the polymer matrix and no changes of the optical properties were observed. However, at concentrations above 2.48 wt% the hexadecanoic acid partially separates from the polymer matrix and a thermochromic as well as a thermotropic effect occur. At room temperature the polymer composite is cloudy and has a wine red color. On heating at about 45 °C a discontinuous color change from wine red to violet takes place (thermochromic effect). Further heating results in a cloudy to clear transformation at about 60 °C (thermotropic effect). The observed thermochromic effect differs strongly from the effect we expected to obtain. On the one hand the wine red disaggregated state appears as a low temperature state and on the other hand the switching occurs discontinuously. It can be concluded that both mechanisms (vide supra) cannot explain the thermochromic behavior of the sample. To elucidate the optical switching effects and their origin in more detail, morphological studies as well as spectroscopic and thermoanalytic investigations were carried out on a polymer composite consisting of 75 g PLA, 16 mg cyanidin chloride, 4 g dodecyl gallate and 4.4 g hexadecanoic acid (PLA composite I).
Formation of separate hexadecanoic acid rich domains in PLA composite I can be seen in the scanning electron microscope (SEM)-picture of a freeze-fractured surface (Fig. 4a and b). The SEM pictures clearly show that the domains were mostly homogeneously dispersed in the polymer volume during the extrusion process. Although phase separation occurs on a microscopic scale the sample appears homogeneous on a macroscopic scale (Fig. 4a). This is an essential condition to realize uniform optical properties. The spherical domains have a medium diameter of about 300 nm and have a narrow size distribution (Fig. 4b).
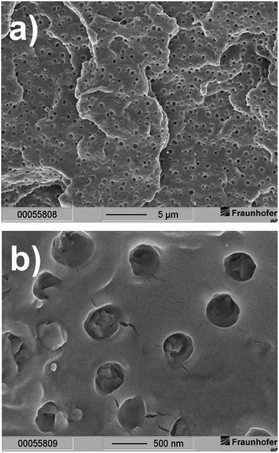 | ||
| Fig. 4 Scanning electron microscopy pictures of a freeze-fractured surface of PLA composite I at two different magnifications (scaling: (a) 5 μm and (b) 500 nm). | ||
Differential scanning calorimetry (DSC) is an excellently suited tool to detect the appearance of a separate phase. In addition it provides information about transition temperatures and enthalpies. A DSC curve of a polymer composite with a hexadecanoic acid content slightly below the concentration at which a separate phase appears (PLA composite II: 75 g PLA, 16 mg cyanidin chloride, 4 g dodecyl gallate and 1.9 g hexadecanoic acid) is additionally displayed in Fig. 5a. Comparing the DSC curves of PLA composite I and PLA composite II with each other displays changes of the calorimetric properties due to the formation of the separate domains.
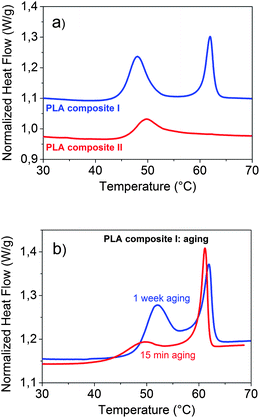 | ||
| Fig. 5 DSC curves: (a) of PLA composite I and PLA composite II and (b) of PLA composite I after 15 min and after 1 week of aging at room temperature. | ||
The separate hexadecanoic acid rich phase leads to the occurrence of an additional peak at its melting temperature of about 60 °C. The position and specific melting enthalpy of the separate phase correspond very well with the data of pure hexadecanoic acid. As the pure PLA 4060D both composites are amorphous (0% crystallinity). No DSC peak appears within the temperature range of 100–150 °C which would indicate a semicrystallinity of the PLA polymer matrix. In both DSC curves a signal at about 45 °C can be seen which belongs to the glass transition (Tg) of the polymer composites. In comparison to the pure PLA 4060D the glass transition temperature is lowered by about 10 K. Another eye-catching effect is the large peak at the glass transition of PLA composite I which contains separate hexadecanoic acid rich domains. This peak indicates an enthalpic relaxation process of the polymer chain conformation in the glassy state. The mobile amorphous phase in which the polymer chain conformation is the same as in the liquid state transforms into the rigid amorphous phase in which the polymer chain is in the equilibrium conformation. Similar effects were reported for semicrystalline polymers including PLA27–29 and for PLA composites containing filler particles.30,31 In semicrystalline polymers the formation of the rigid amorphous phase appears at the interface between crystalline and mobile amorphous regions. In polymer composites containing filler particles those act as nucleating agents. The enthalpic relaxation process of the polymer chain conformation takes place at the filler–polymer interface. With decreasing size of the filler the interfacial area strongly increases. Hence, the nano-sized hexadecanoic acid rich domains (d = 300 nm) of the investigated polymer composite effectively induce the formation of the rigid amorphous phase. In order to study the kinetic of this relaxation process, aging experiments at room temperature were carried out. A slow increase of the peak enthalpy with aging time was found. Even after 1 week no equilibrium state was reached. The DSC curves measured after 15 min and after 1 week of aging at room temperature are displayed in Fig. 5b.
In summary SEM and DSC prove the formation of hexadecanoic acid rich domains with a diameter of about 300 nm in the thermochromic PLA composite which is accompanied by a transformation from the mobile amorphous into the rigid amorphous phase within the glassy state.
Spectroscopic measurements of the visible absorption of PLA composite I were performed at various temperatures on heating (Fig. 6a) and cooling.
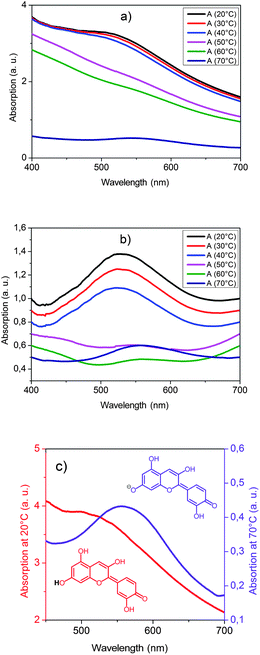 | ||
| Fig. 6 Temperature dependency of the visible absorption of PLA composite I: (a) original curves on heating, (b) slope corrected curves on heating and (c) thermochromic switching effect, red curve: cold state, violet curve: hot state. | ||
Heating the polymer composite from 20 °C to 70 °C results in the glass transition of the matrix polymer (40–50 °C) followed by the melting of the hexadecanoic acid rich domains (60–70 °C).
Both transitions lead to a distinct change of the scattering properties (Fig. 6a). Especially, the melting of the domains leads to a transformation from a light scattering into a clear state. This thermotropic effect can be explained by a change of the refractive index of the hexadecanoic acid rich phase during melting in analogy to thermotropic matrix–domain systems.32,33 In the solid state the refractive index of the domains differs from the refractive index of the polymer matrix and thus light scattering occurs. In the molten state the refractive indices of domains and the polymer matrix match and the composite appears clear. In addition to these thermotropic effects, a thermochromic switching occurs at the glass transition temperature. This effect becomes easily visible in a baseline corrected plot of the absorption spectra (Fig. 6b). Whereas the absorption peak in the glass phase has a maximum at about 530 nm, above the glass transition temperature an absorption peak with a maximum at about 560 nm is observed. This thermochromic switching effect corresponds to a structural change of the cyanidin dye from its neutral into its anionic anhydrobase form (Fig. 6c). Hence, the material changes its color from red to violet and the temperature change becomes visible for the human eye.
On cooling the polymer composite, the sequence of the phase transition changes due to a supercooling effect of the crystallization of the hexadecanoic acid rich domains. In the temperature range between 50 °C and 40 °C the glass transition of the polymer matrix occurs. On further cooling in between 30 °C and 20 °C the hexadecanoic acid rich domains crystallize. Again at both phase transitions a distinct change of the light scattering properties occurs. However, no thermochromic effect takes place on cooling into the glass state unless the hexadecanoic acid rich domains crystallize. Afterwards, the absorption peak at 560 nm slowly decreases while an absorption peak at 530 nm appears and slowly increases. It takes a couple of days until the absorption peak at 560 nm has vanished indicating the complete transformation of the dye into the neutral anhydrobase form.
The change of the optical properties correlates with the appearance and disappearance of the rigid amorphous phase. On cooling from the polymer melt into the glass state the mobile amorphous phase is formed. At this transition no change of the absorption maximum is observed. From the moment when crystallization of the hexadecanoic acid rich domains occurs the mobile amorphous phase starts to transform into the rigid amorphous phase and an absorption peak at 530 nm appears. As the portion of the rigid amorphous phase slowly increases the color continuously changes from violet to wine red. Both processes require several days before equilibrium is reached. On heating above the glass transition temperature the rigid amorphous phase and the mobile amorphous phase transform into the polymer melt. Accompanied with this transition a discontinuous color change from wine red to violet occurs. The absorption peak at 530 nm vanishes and the absorption peak at 560 nm appears.
Two factors might contribute to the observed thermochromic effect: (i) the destabilization of the interaction between PLA and cyanidin caused by conformational changes of the polymer backbone during the formation of the rigid amorphous phase as displayed by way 1 in Fig. 7. It is known, that the strength and the extent of H-bonding between polyesters and low molecular weight polyphenols depend on the stereochemical structure of polyesters.24 The transformation from the more flexible (mobile amorphous phase) to the more rigid polymer backbone structure (rigid amorphous phase) in which the PLA polymer chain is in its equilibrium conformation interferes with the formation of multiple H-bonding and thus destabilizes the PLA–cyanidin complex. (ii) An increase of the PLA–PLA interaction occurs in the rigid amorphous phase. PLA–cyanidin complexes disaggregate accompanied by phase separation as displayed by way 2 in Fig. 7.
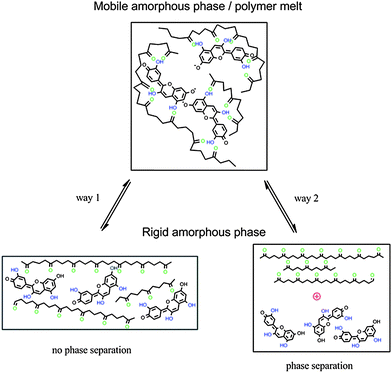 | ||
| Fig. 7 Scheme of thermochromism by interaction between PLA and cyanidin, way 1: without phase separation, way 2: phase separation. | ||
The described mechanism of a structural change of an incorporated dye by the formation or disappearance of a rigid amorphous phase is a novel mechanism of thermochromism. No similar effect has been described for any other thermochromic material so far.
Conclusions
A non-toxic and non-carcinogenic thermochromic PLA composite was successfully created by incorporating the natural dye cyanidin chloride and the additives dodecyl gallate and hexadecanoic acid into PLA 4060D. Triggered by the formation of the rigid amorphous phase on cooling and the transition from the rigid amorphous phase into the molten state at Tg on heating, a color change between a wine red low temperature state and a violet high temperature state occurs. The immanent thermochromic effect is based on temperature dependent structural changes of the cyanidin dye between its neutral and its anionic anhydrobase form. PLA–cyanidin complex formation/disaggregation is discussed to be the origin of switching between different colors in dependence on temperature.The discussed mechanism for thermochromism initiated a novel strategy for the development of a new generation of thermochromic materials. Especially regarding long term and light stability for temperature sensors without an external electrical power source and label-sensors working across a diffusion mechanism.1,2 Advantageously the processing of these materials uses the well-known and efficient extrusion technology.
Acknowledgements
Financial support by Fraunhofer-Gesellschaft, München (project number 253 138) is gratefully acknowledged.Notes and references
- P. Bamfield and M. G. Hutchings, Chromic phenomena: Technological applications of colour chemistry, The Royal Society of Chemistry, Cambridge, UK, 2nd edn, 2010, ch. 1.3 Search PubMed.
- A. Seeboth and D. Lötzsch, Thermochromic and thermotropic materials, Pan Stanford Publishing Pte Ltd., Singapore, 2013 Search PubMed.
- A. Pucci, R. Bizzarri and G. Ruggeri, Soft Matter, 2011, 7, 3689 RSC.
- J. H. Day, Chem. Rev., 1968, 68(6), 649–657 CrossRef CAS.
- M. Gaudon, P. Deniard, A. Demourgues, A.-E. Thiry, C. Carbonera, A. Le Nestour, A. Largeteau, J.-F. Létard and S. Jobic, Adv. Mater., 2007, 19, 3517–3519 CrossRef CAS.
- D. C. MacLaren and M. A. White, J. Mater. Chem., 2003, 13, 1701–1704 RSC.
- G. Qian and Z. Y. Wang, Adv. Mater., 2012, 24, 1582–1588 CrossRef CAS.
- B. L. Lucht, W. B. Euler and O. J. Gregory, Polym. Prepr., 2002, 43(1), 59–60 CAS.
- K. Tashiro, K. Ono, Y. Minagawa, M. Kobayashi, T. Kawai and K. Yoshino, J. Polym. Sci., Part B: Polym. Phys., 1991, 29, 1223–1233 CrossRef CAS.
- D. J. Ahn, S. Lee and J. M. Kim, Adv. Funct. Mater., 2008, 18, 1–7 Search PubMed.
- Z. Yuang, C. W. Lee and S. H. Lee, Angew. Chem., Int. Ed., 2004, 43, 4197–4200 CrossRef.
- Y. Gu, W. Cao, L. Zhu, D. Chen and M. Jiang, Macromolecules, 2008, 41, 2299–2303 CrossRef CAS.
- L. Rougeau, D. Picq, M. Rastello and Y. Frantz, Tetrahedron, 2008, 64, 9430–9436 CrossRef CAS.
- V. Siracusa, P. Rocculi, S. Romani and M. D. Rosa, Trends Food Sci. Technol., 2008, 19, 634–643 CrossRef CAS.
- K. H. Harper, J. Appl. Chem. Biotechnol., 1973, 23, 261–271 CAS.
- T. Goto and T. Kondo, Angew. Chem., Int. Ed. Engl., 1991, 30, 17–33 CrossRef.
- K. Yoshida, M. Mori and T. Kondo, Nat. Prod. Rep., 2009, 26, 884–915 RSC.
- J. Luthern and A. Peredes, J. Mater. Sci. Lett., 2000, 19(3), 185–188 CrossRef CAS.
- A. Seeboth, J. Kriwanek and R. Vetter, J. Mater. Chem., 1999, 9(10), 2277–2278 RSC.
- A. Seeboth, J. Kriwanek and R. Vetter, Adv. Mater., 2000, 12(19), 1424–1426 CrossRef CAS.
- M. G. Baron and M. Elie, Sens. Actuators, B, 2003, 90, 271–275 CrossRef.
- A. Seeboth, D. Lötzsch, E. Potechius and R. Vetter, Chin. J. Polym. Sci., 2006, 24(4), 363–368 CrossRef CAS.
- R. Kulcar, M. Friskovec, N. Hauptman, A. Vesel and M. K. Gunde, Dyes Pigm., 2010, 86(3), 271–277 CrossRef CAS.
- B. Zhu, J. Li, Y. He, H. Yamane, Y. Kimura, H. Nishida and Y. Inoue, J. Appl. Polym. Sci., 2004, 91, 3565–3573 CrossRef CAS.
- Y. Lin, K.-Y. Zhang, Z.-M. Dong, L.-S. Dong and Y.-S. Li, Macromolecules, 2007, 40(17), 6257–6267 CrossRef CAS.
- G. M. Robinson and R. Robinson, Biochem. J., 1931, 27(1), 206–212 Search PubMed.
- N. A. Bailey, J. H. Hay and D. M. Price, Thermochim. Acta, 2001, 367–368, 425–431 CrossRef CAS.
- E. Zuza, J. M. Ugartemendia, A. Lopez, E. Meaurio, A. Lejardi and J.-R. Sarasua, Polymer, 2008, 49, 4427–4432 CrossRef CAS.
- Y. Wang, J. L. Gomez Ribelles, M. Salmeron Sanchez and J. F. Mano, Macromolecules, 2005, 38, 4712–4718 CrossRef CAS.
- G. Z. Papageorgiou, D. S. Achilias, S. Nanaki, T. Beslikas and D. Bikiaris, Thermochim. Acta, 2010, 511, 129–139 CrossRef CAS.
- A. Gregorova, M. Hrabalova, R. Kovalcik and R. Wimmer, Polym. Eng. Sci., 2011, 51, 143–150 CAS.
- K. Resch and G. M. Wallner, Polym. Adv. Technol., 2009, 20(12), 1163–1167 CrossRef CAS.
- A. Seeboth, R. Ruhmann and O. Muehling, Materials, 2010, 3(12), 5143–5168 CrossRef CAS.
| This journal is © The Royal Society of Chemistry 2013 |
