A deep-blue emitting charged bis-cyclometallated iridium(III) complex for light-emitting electrochemical cells†
Sebastian B. Meierab, Wiebke Sarfert*b, José M. Junquera-Hernándezc, Manuel Delgadoc, Daniel Torderac, Enrique Ortí*c, Henk J. Bolinkc, Florian Kessler‡d, Rosario Scopellitid, Michael Grätzeld, M. Khaja Nazeeruddind and Etienne Baranoff*de
aDepartment of Materials Science VI: Materials for Electronics and Energy Technology, Friedrich-Alexander University of Erlangen-Nuremberg, Martensstr. 7, DE-91058 Erlangen, Germany
bSiemens AG, Corporate Technology, CT RTC MAT MPV-DE, Günther-Scharowsky Strasse 1, DE-91058 Erlangen, Germany. E-mail: wiebke.sarfert@siemens.com
cInstituto de Ciencia Molecular, Universidad de Valencia, ES-46980 Paterna, Spain. E-mail: enrique.orti@uv.es
dLaboratory of Photonics and Interfaces, Institute of Chemical Sciences and Engineering, School of Basic Sciences, Swiss Federal Institute of Technology (EPFL), CH-1015 Lausanne, Switzerland
eSchool of Chemistry, University of Birmingham, Edgbaston, Birmingham B15 2TT, UK. E-mail: e.baranoff@bham.ac.uk
First published on 23rd October 2012
Abstract
We report here a new cationic bis-cyclometallated iridium(III) complex, 1, with deep-blue emission at 440 nm and its use in Light-emitting Electrochemical Cells (LECs). The design is based on the 2′,6′-difluoro-2,3′-bipyridine skeleton as the cyclometallating ligand and a bis-imidazolium carbene-type ancillary ligand. Furthermore, bulky tert-butyl substituents are used to limit the intermolecular interactions. LECs have been driven both at constant voltage (6 V) and constant current (2.5 mA cm−2). The performances are significantly improved with the latter method, resulting overall in one of the best reported greenish-blue LECs having fast response (17 s), light intensity over 100 cd m−2 and a reasonable efficiency of almost 5 cd A−1.
Introduction
Charged bis-cyclometallated iridium(III) complexes1–4 have recently emerged as a promising class of phosphorescent materials on their own, in particular for their application in Light-emitting Electrochemical Cells (LECs).5–14 LECs are electroluminescent devices based on ionic transition-metal complexes (iTMCs) and constitute an alternative to Organic Light-Emitting Diodes (OLEDs) due to their promising low-cost production. The major advantages of LECs come from their simpler architecture and the possibility of using air-stable electrodes allowing non-rigorous encapsulation processes. The latter is due to the presence of mobile ions, which migrate towards the electrodes under an applied voltage and assist the injection of charges in the device. The development of this technology is however hampered by current limitations concerning efficiency and blue color emission. Efficient and stable blue emitters are necessary to achieve highly efficient white-light electroluminescence.Consequently, charged blue-emitting iridium complexes are highly searched for, which has resulted in various reports about new blue-emitting complexes based on different substitution patterns, main ligand skeleton, and ancillary ligands.11,12,15–27 Only a few blue emitters based on emitting charged iridium(III) complexes have been reported in LECs, and all these devices showed poor performances (see details in the ESI†). A particular issue is the color point of the emitted light. The electroluminescence spectrum very often shifts significantly to the red with increasing operation time and true blue emission is only observed during the first stages of operation. While the exact reasons for this red shift in electroluminescence (EL) are still unclear, it is paralleled by the red shift of photoluminescence (PL) observed when increasing the concentration of iTMCs in thin films.28 The large spectral red-shift in EL compared to PL (84 nm) observed for the blue-emitting iridium(III) complex [Ir(ppy-F2)2Me4phen][PF6] was attributed to the high concentration of the iTMC in the thin film resulting in a change of the emissive excited state. Supported by quantum-chemical calculations, the origin of the concentration-dependent emission was ascribed to the population of three closely contiguous low-energy triplet states lying within an energy difference of only 0.1 eV.28 Moreover, Margapoti et al. found evidence that molecular rearrangement into aggregates in LECs based on the iTMC [Ir(4,5-diphenyl-2-methylthiazolo)2(5-methyl-1,10-phenanthroline)][PF6] favors the formation of excimeric states induced by the local electric field in a LEC.10 These states are shown to be irreversibly formed and to be the preferential emitting states even in devices left unbiased for a long period of time. Accordingly, a change of the molecular environment in the stressed devices over time could reasonably explain the color shift. Phosphorescent materials with emission independent of the surrounding medium, in particular in neat solid, are expected to solve this issue. The introduction of bulky substituents such as dendrimers on the periphery of the emitting center is a classical approach in neutral phosphorescent emitters to limit the intermolecular interactions impacting the output color.29–32 However, in the case of LECs, the iTMCs act both as charge transporting materials and light emitters. Addition of too large electro-inactive substituents would strongly isolate the iTMCs and decrease the charge transport performances in the device with an overall negative effect on the efficiency. A good balance should therefore be obtained to limit the red shift of emission due to intermolecular interactions on the one hand, while keeping close contact to allow for efficient charge transport through iTMCs on the other hand. In this respect, small and bulky substituents appear as a promising compromise.
Here we report the synthesis, characterization and electroluminescent properties of a new cationic bis-cyclometallated iridium(III) complex, 1 in Scheme 1, with deep-blue emission centered at 440 nm. The complex has been designed by using a 2′,6′-difluoro-2,3′-bipyridine skeleton as the main ligand and a bis-imidazolium carbene-type ancillary ligand. Furthermore, we used bulky tert-butyl substituents to limit the intermolecular interactions. LECs have been studied both at constant voltage (6 V) and constant current (2.5 mA cm−2). The performances are significantly improved with the latter method, resulting overall in one of the best reported greenish-blue LECs with fast response (17 s), light intensity over 100 cd m−2 and a reasonable efficiency of almost 5 cd A−1. In addition, although a red shift of the color point was observed under stress, the blue component of the electroluminescence spectrum remained stable over time.
 | ||
| Scheme 1 Chemical structure of complex 1 and previously reported similar complexes with a carbene-based ancillary ligand. | ||
Results and discussion
Synthesis
The main ligand L1, 4-(tert-butyl)-2′,6′-difluoro-2,3′-bipyridine, was synthesized by Suzuki coupling following the method reported by Lee et al. for a similar ligand without the tert-butyl group.33 The bis-imidazolium ancillary ligand, L2, was obtained by a slightly modified literature procedure.23 Whereas IrCl3 × H2O is usually employed as the starting material for the preparation of the chloro-bridged iridium dimer, this synthesis was not successful with L1 and we used instead the recently reported method with [Ir(COD)(μ-Cl)]2 as the starting material.34 The reaction time is much shorter than with the classical method (3 hours instead of more than 12 hours) and the yield is very good (97%). In particular, this method allows for the gram-scale synthesis of the chloro-bridged dimer complex in a small amount of solvent. Complex 1 was finally obtained by reacting the dimer [Ir(L1)2(μ-Cl)]2 with L2 in the presence of silver(I) oxide and was isolated as the hexafluorophosphate salt in 44% yield.X-ray crystal structure
The X-ray crystal structure of complex 1 (Fig. 1) was obtained from a single crystal grown by slow diffusion of heptane into a dichloromethane solution of the complex. The complex crystallizes with both Δ and Λ-isomers in the unit cells. Only the Λ-isomer is discussed hereafter. The complex shows a near-octahedral geometry with the two pyridines of the anionic cyclometallated ligands in trans position one to each other and the two orthometallated phenyl rings in cis position, retaining the geometry of the starting chloro-bridged iridium dimer. The bite angle of the bis-carbene ancillary ligand shows very similar values in complex 1 (84.1(3)°) and complex B (85.82(18)°).23 Whereas the Ir–C(carbene) distances of complexes 1 and B are close to 2.11 Å, those of complexes A and C are significantly shorter (∼2.07 Å).17 This is in good agreement with the smaller bite angle of the pyridine–carbene ancillary ligand (76.4(3)° for A and 76.59(16)° for C) forming a 5-membered-cyclometallated ring. It is worth noting that the tert-butyl substituent prevents intermolecular interactions such as π–π stacking, which are therefore not observed in the crystal structure.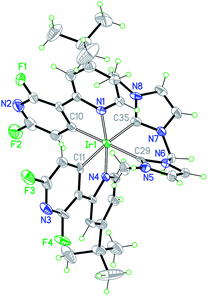 | ||
| Fig. 1 ORTEP drawing of the X-ray crystal structure of 1 (only the Λ-isomer is shown; the PF6 anion and solvent molecules have been omitted for clarity). Selected bond lengths (Å) and angles (°) of the Λ-isomer: Ir(1)–N(1) 2.057(6), Ir(1)–N(4) 2.074(6), Ir(1)–C(10) 2.047(8), Ir(1)–C(11) 2.059(7), Ir(1)–C(29) 2.111(8), and Ir(1)–C(35) 2.113(7); C(29)–Ir(1)–C(35) 84.1(3), C(10)–Ir(1)–C(29) 173.8(3), C(11)–Ir(1)–C(35) 173.8(3), N(1)–Ir(1)–N(4) 171.0(2), C(10)–Ir(1)–C(11) 83.1(3), C(10)–Ir(1)–C(35) 100.5(3), and C(11)–Ir(1)–C(29) 92.8(3). | ||
Electrochemical properties
The electrochemical potentials of complex 1 were measured versus ferrocenium/ferrocene (Fc+/Fc) using 0.1 M TBAPF6 as the supporting electrolyte in acetonitrile and are 1.35 V for the oxidation (irreversible) and −2.33 V for the reduction (quasi-reversible). The value for the reduction potential in complex 1 is very similar to that found for complexes A, B and C (−2.20, −2.32, and −2.26 V vs. Fc+/Fc, respectively).17,23 The influence of the ancillary ligand on the reduction potential can be estimated from the difference between B and C, 0.06 V. Assuming a similar impact between 1 and A, the remaining 0.06 V difference is assigned to the tert-butyl donor group. On the other hand, the oxidation potentials are significantly different from one complex to another. Compared to A (1.61 V vs. Fc+/Fc),17 the oxidation of 1 is cathodically shifted by 0.26 V, which is mainly attributed to the change of ancillary ligand and reflects the increased σ-donation and decreased π-back-bonding of the bis-carbene ligand compared to the pyridine–carbene ligand. A similar 0.20 V change in the oxidation potential is observed when comparing complexes C (1.19 V vs. Fc+/Fc)17 and B (0.99 V vs. Fc+/Fc).23 The extra 0.06 V destabilization of the oxidation potential of 1 can be attributed to the tert-butyl donor group, which destabilizes the HOMO energy level through its σm Hammett parameter.35 These results point to a HOMO and a LUMO both localized on the cyclometallated ligand, in contrast to the commonly used charged complexes where the LUMO is usually located on the ancillary ligand.Photophysical properties
The UV-visible electronic absorption spectrum of 1 in acetonitrile solution (Fig. 2) displays intense absorption bands in the UV region (ε ≈ 40![[thin space (1/6-em)]](https://www.rsc.org/images/entities/char_2009.gif) 000 M−1 cm−1) assigned to ligand-centered (LC) π–π* transitions on the cyclometallated 2,3′-bipyridine ligand. The weaker bands (ε ≈ 15000 to 5000 M−1 cm−1) in the 290–350 nm range correspond to the metal-to-ligand charge transfer (MLCT) transitions. Finally, two very weak bands are observed at 402 nm (ε ≈ 160 M−1 cm−1) and 428 nm (ε ≈ 60 M−1 cm−1), similar to what has been previously observed for complex A.17
000 M−1 cm−1) assigned to ligand-centered (LC) π–π* transitions on the cyclometallated 2,3′-bipyridine ligand. The weaker bands (ε ≈ 15000 to 5000 M−1 cm−1) in the 290–350 nm range correspond to the metal-to-ligand charge transfer (MLCT) transitions. Finally, two very weak bands are observed at 402 nm (ε ≈ 160 M−1 cm−1) and 428 nm (ε ≈ 60 M−1 cm−1), similar to what has been previously observed for complex A.17![Absorption (left, in acetonitrile) and emission (right: bold black line, in acetonitrile at room temperature; thin black line, in 2-methyltetrahydrofuran at 77 K; blue line, 5 wt% of 1 in PMMA; green line, mixture 1/[BMIM][PF6] 4 : 1) spectra of complex 1.](/image/article/2013/TC/c2tc00251e/c2tc00251e-f2.gif) | ||
| Fig. 2 Absorption (left, in acetonitrile) and emission (right: bold black line, in acetonitrile at room temperature; thin black line, in 2-methyltetrahydrofuran at 77 K; blue line, 5 wt% of 1 in PMMA; green line, mixture 1/[BMIM][PF6] 4:1) spectra of complex 1. | ||
The emission spectrum of 1 in acetonitrile (excitation at 370 nm) is shown in Fig. 2. The highest energy emission band occurs at 440 nm with a photoluminescence quantum yield of 0.13 and an observed excited-state lifetime of 1.16 μs. The radiative constant (kr = 1.1 × 10⁵ s−1) is similar to that reported for complex B (same ancillary ligand, kr = 0.96 × 10⁵ s−1 in CH2Cl2),23 while significantly higher than for A (similar main ligand, kr = 0.23 × 10⁵ s−1).17 On the other hand, the nonradiative constant (knr = 7.5 × 10⁵ s−1) is higher than for A (knr = 0.94 × 10⁵ s−1) and B (kr = 3.8 × 10⁵ s−1 in CH2Cl2) but half of the value reported for C (kr = 14.2 × 10⁵ s−1).17,23 The differences with B could be attributed to a solvent effect as the reported data were measured in CH2Cl2 while we use acetonitrile, a more polar solvent. When cooled to 77 K in 2-methyltetrahydrofuran, the emission spectrum is only slightly blue shifted (λmax = 436 nm) and is highly structured with two vibronic progressions, about 1000 and 1500 cm−1. This points to an emitting triplet state with mainly 3LC character, as supported by theoretical calculations (see below).
Solid-state photophysical data were obtained for thin solid films consisting of 5% by weight of 1 in poly(methyl-methacrylate) (PMMA) and of 1 and the ionic liquid (IL) 1-butyl-3-methyl-imidazolium hexafluorophosphate [BMIM][PF6] in a molar ratio of 4 to 1 using an excitation wavelength of 280 nm. The PL emission spectra of both thin solid films (Fig. 2) show a structured band with maxima at 440 and 466 nm and a lower intensity shoulder at around 495 nm. The higher-energy peak is more intense for the film of 1 in PMMA than for the 1:IL film, whereas the shoulder is more pronounced for the complex mixed with the IL. The photoluminescence spectra in the solid state are very similar to those recorded in solution. This effect is due to the bulky tert-butyl substituents attached to the emitting ligand that prevent intermolecular stacking, as seen above in the X-ray crystal structure. Photoluminescence quantum yields of 0.59 and 0.17 are measured for 1 in a 5% complex in a PMMA film and in a more concentrated film similar to that used in LEC devices, respectively. The significant decrease in photoluminescence quantum yield when increasing the concentration of the complex in a solid film indicates that significant exciton hopping occurs in a more concentrated film. Hence, the tert-butyl substituents prevent emission shifts yet they do not shield the molecules that much to prevent exciton hopping and concentration quenching.
Theoretical calculations
To gain a deeper insight into the electrochemical and photophysical properties of complex 1, a combined DFT/TD-DFT theoretical investigation was undertaken at the B3LYP/(6-31G** + LANL2DZ) level in the presence of the solvent (acetonitrile) (see the Experimental section for full computational details). The molecular and electronic structures of the cations of complexes A, B and C were also investigated for comparison purposes.The geometry of the complexes in their ground electronic state (S0) was fully optimized without imposing any symmetry restriction. For complex 1, calculations correctly reproduce the near-octahedral coordination of the Ir metal observed in the X-ray structure and predict geometric parameters in good accord with the experimental data (see Table S2 in ESI†). For instance, the values computed for the Ir(1)–C(10) and Ir(1)–C(11) distances (2.050 and 2.058 Å, respectively) and for the bite angle of the bis-carbene ancillary ligand (84.5°) agree well with the X-ray values (2.047(8) Å, 2.059(7) Å and 84.1(3)°, respectively). The largest difference between computed and X-ray data corresponds to the coordinate Ir–N and Ir–C(carbene) bonds, whose distances are theoretically overestimated by 0.03 and 0.05 Å, respectively, as is frequently observed when using the B3LYP functional.36 To maximize the interaction with the iridium core, the bis-carbene ligand loses its planarity and the imidazolium rings are twisted by an average angle of 52.0°.
Fig. 3 compares the energy and electron density contours calculated for the highest-occupied and lowest-unoccupied molecular orbitals (HOMO and LUMO, respectively) of 1 with those obtained for complexes A, B and C. The electron density distribution of the HOMO shows important differences for the four complexes. The HOMO of 1 calculated at −5.98 eV is composed of a mixture of Ir dπ orbitals (t2g) and π orbitals of the ancillary ligand, with a small contribution from the π orbitals of the main ligands. This is not what is usually observed for commonly designed Ir-iTMCs incorporating two cyclometallating C⁁N ligands, the most popular being 2-phenylpyridines (ppy), and a bidentate diimine N⁁N ancillary ligand, for which the HOMO is a mixture of Ir dπ orbitals and phenyl π orbitals of the ppy ligands.9,22,37 The different topology calculated for the HOMO of 1 is due to the high energy of the HOMO of the bis-imidazolium carbene ligand. On passing to complex A, the bis-carbene:C^C:ligand is replaced by a pyridine–carbene N⁁C:ligand and the HOMO retrieves the participation of the main C⁁N ligands (Fig. 3). As a consequence, the HOMO is stabilized by 0.26 eV in perfect agreement with the increase of the oxidation potential from 1 (1.35 V) to A (1.61 V). The effect of the main ligand is reflected on going to complex B, for which the cyclometallating 2,3-bipyridine ligands are replaced by the less electron-withdrawing ppy ligands and the HOMO increases in energy by 0.32 eV. This destabilization determines the lower oxidation potential recorded for B (0.99 V) and is slightly smaller than that obtained on passing from A to C (0.47 eV) due to the tert-butyl donor groups present in 1. It is to be mentioned that whereas the HOMO-1 of 1 shows an electron density distribution similar to the HOMO, the HOMO-2, HOMO-3 and HOMO-4, which are calculated within a range of 0.55 eV below the HOMO, are mainly composed of different mixtures of Ir dπ orbitals and π orbitals of the main ligands (Fig. S2†).
 | ||
| Fig. 3 Schematic diagram showing the electron density contours (0.03 e bohr−3) and the energy values calculated for the HOMO and LUMO of complexes 1, A, B and C. The tert-butyl groups in complex 1 and the methyl groups in complexes 1 and B have been omitted to facilitate the viewing of the orbitals. | ||
In contrast to the HOMO, the LUMO shows a similar electron density distribution for the four complexes (see Fig. 3); it resides on the main C⁁N ligands, showing no contribution from the ancillary ligand. Nonetheless, the change of the ancillary ligand, from a bis-carbene (1 and B) to a pyridine–carbene (A and C), stabilizes the LUMO in good agreement with the anodic shift recorded for the first reduction potential (1: −2.33 V vs.A: −2.21 V and B: −2.32 V vs.C: −2.26 V). The slightly larger stabilization predicted in passing from 1 to A (0.19 eV compared with 0.08 eV from B to C) agrees well with the experiment and is attributed to the presence of the tert-butyl donor groups in 1 as proposed above from the electrochemical properties. The LUMO + 1 is calculated slightly above the LUMO (0.05 eV for 1) and shows a similar electron density distribution. Indeed, no molecular orbital shows a relevant contribution from the ancillary ligand in a range of up to 1 eV above the LUMO for complex 1 (Fig. S2†).
The evolution of the HOMO–LUMO energy gap along the series B (4.13 eV), C (4.16 eV), 1 (4.41 eV) and A (4.48 eV) follows the trend observed for the electrochemical gap (ΔE1/2redox = E1/2ox − E1/2red, B: 3.31 V; C: 3.45 V; 1: 3.68 V; A: 3.81 V) and justifies, in a first approach, the blue shift that the replacement of the main C⁁N ligand (2-phenylpyridine by 2,3′-bipyridine) causes in the emission spectra in passing from B (452 nm, CH2Cl2)23 to 1 (440 nm, CH3CN) or from C (450 nm, CH3CN) to A (435 nm, CH3CN).17
The atomic orbital composition calculated for the frontier orbitals does not support the fact that emission in complex 1 takes place from the main ligand (3LC character), as the experiment suggests, since the HOMO implies the Ir dπ orbitals (t2g) and the π orbitals of the ancillary ligand whereas the LUMO resides on the main C⁁N ligands. As the simple description of the HOMO and LUMO is not always representative of the emitting triplet state, the lowest-energy triplet state of complex 1 was calculated using the spin unrestricted UB3LYP approach. After full-geometry relaxation, the calculation converges to a triplet state (T1) for which the two unpaired electrons mostly reside on one of the C⁁N ligands with a small contribution (0.09 e) from the metal (Fig. 4). This is also the case for complexes A (0.10 e), B (0.15 e) and C (0.15 e). Calculations therefore suggest that excitation to the emitting triplet state of complex 1, and also of complexes A, B and C, mainly implies an electron promotion within the cyclometallated ligands and has a 3LC electronic nature in good agreement with experimental evidence. The large LC character of T1 explains the structural aspect of the emission band observed experimentally and the absence of any rigidochromic shift upon decreasing the temperature (Fig. 2). The T1 state is computed to lie 2.97 (1), 2.91 (A), 2.81 (B) and 2.84 eV (C) above the electronic ground state S0 (adiabatic energy differences). These energy differences also support the blue shift observed for the emission of complexes 1 and A, bearing 2′,6′-difluoro-2,3′-bipyridine C⁁N ligands, compared with B and C.
 | ||
| Fig. 4 UB3LYP spin-density contours (0.005 e bohr−3) computed for the optimized T1 state of complexes 1, A, B and C. | ||
To further investigate the nature of the excited states, the low-lying triplet states of complex 1 were calculated using the time-dependent DFT (TD-DFT) at the optimized geometry of S0. TD-DFT calculations predict two low-energy triplets, T1 and T2, lying at very close energies (3.06 and 3.11 eV above S0, respectively) and showing a complex nature resulting from a mixture of MLCT, LLCT and LC excitations (see Table S3†). The geometry of these two states was optimized at the TD-DFT level as a further refinement. After full-geometry relaxation, both states evolve to 3LC states, each one localized on one C⁁N ligand (see Fig. S3†). TD-DFT optimizations therefore confirm that the two lowest-energy triplet states of complex 1, that lie almost degenerate at 2.70 (T1) and 2.75 eV (T2) above S0 (adiabatic energy differences), correspond to π–π* 3LC states involving the C⁁N ligands. It is interesting to note that at the optimized geometries of T1 and T2 both the HOMO and the LUMO are localized on one of the cyclometallated ligands. This is illustrated in Fig. 5 for T1. Therefore, excitation to T1 and T2 slightly modifies the coordination sphere of the iridium core and mainly affects the geometry of the C⁁N ligand involved in the excitation (Table S2 and Fig. S4†).
 | ||
| Fig. 5 Schematic diagram showing the electron density contours (0.03 e bohr−3) calculated for the HOMO and LUMO of complex 1 at the TD-DFT optimized geometry of T1. The tert-butyl and the methyl groups have been omitted to facilitate the viewing of the orbitals. | ||
The first 40 singlet states of complex 1 were also calculated using TD-DFT. The calculations provide a picture of the absorption spectrum that reproduces the main bands observed in the experimental spectrum. An interesting feature is the lack of any calculated singlet state with energy below 3.76 eV (330 nm). This points to triplet states as responsible for the very weak absorption bands detected experimentally at 402 and 428 nm, which would explain their low intensity (ε ≈ 160 and 60 M−1 cm−1, respectively). Triplets T1 and T2 are well separated in energy from the rest of excited triplet states (Table S3†) and are the main candidates to account for those bands.
Electroluminescent properties
To test the electroluminescent properties of complex 1, light-emitting electrochemical cells were prepared according to the procedure described in the Experimental section. Briefly, devices consisted of a 100 nm emitting layer, comprising the iTMC 1 and the IL [BMIM][PF6] in a molar ratio of 1:IL = 3:1, sandwiched between an ITO/PEDOT:PSS (100 nm) anode and a thermally evaporated aluminum cathode (150 nm). PEDOT:PSS was used to smoothen the ITO surface, increasing the yield and reproducibility of working devices, whereas the IL was employed to facilitate charge injection into the devices and hence reducing the turn-on time.38Fig. 6a represents the time-dependent electroluminescence spectra of 1 in the aforementioned LEC device configuration at a fixed voltage of 6 V. The initial spectrum (black line) was recorded as soon as emission could be observed (after two minutes). The device exhibits greenish EL with a peak centered at around 500 nm, coincident with the PL shoulder emission determined in acetonitrile solution and in thin film (Fig. 2). Moreover, the EL spectrum exhibits a minor tail extending into the red part of the visible spectrum. The CIE 1931 coordinates are (0.27, 0.43). As the device operates, the low energy tail of the electroluminescence spectrum becomes more and more pronounced and color shifts towards the red, which is more clearly visualized in the CIE 1931 diagram in Fig. 6b. After ten minutes of operation the CIE 1931 coordinates have changed to (0.36, 0.45) and the EL maximum at that operation time is at 532 nm. Nevertheless, the blue part of the spectrum remains interestingly fairly stable, and the red-shift observed is best described as a broadening of the spectrum.
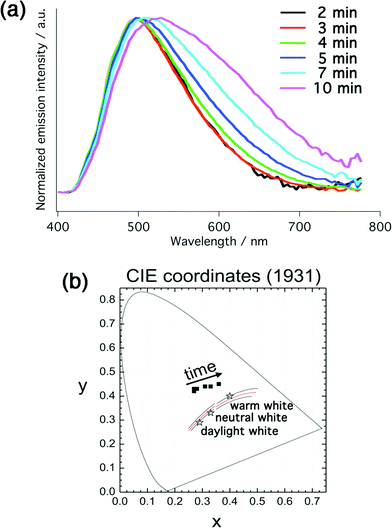 | ||
| Fig. 6 (a) Normalized time-dependent electroluminescence spectra of 1:IL = 3:1 at a fixed voltage of 6 V. (b) Corresponding time-dependent CIE coordinates (CIE 1931). | ||
The onset of the gradual red-shift of the EL spectrum during operation matches very well with the point in time after maximum luminance was achieved. The temporal dependence of the luminance and current density of the LEC device is illustrated in Fig. 7a. Upon applying a fixed voltage of 6 V to the device, the typical behavior of light-emitting electrochemical cells, a gradual increase in both luminance and current with proceeding time, is observed. The slow rise reflects the operational mechanism of LEC devices. In response to the applied electrical field, the small PF6− counter-anions of 1 migrate to the respective electrode interface (anode) leaving an excess of positively charged complex molecules at the counter-electrode (cathode), which on the one hand lowers the barrier for charge injection at both electrodes,39–41 and on the other hand results in an electrochemical doping process of the active layer.42–44
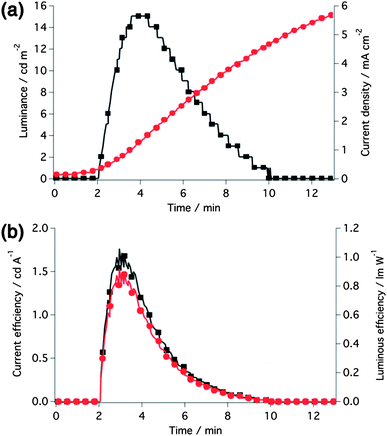 | ||
| Fig. 7 (a) Luminance and current density and (b) current and luminous efficiency over time of the LEC operated at a fixed voltage of 6 V. | ||
The brightness reaches a maximum (Lmax) of 15 cd m−2 after 3.6 minutes (Fig. 7a), defined to be the turn-on time (ton) of the device, and maximum efficiency values of 1.76 cd A−1 and 0.92 lm W−1, respectively, were attained (Fig. 7b). After having reached its maximum, the light intensity dropped rapidly resulting in a low lifetime (t1/2, defined to be the time for the luminance to decay from the maximum to half of the maximum) of around three minutes, which is partly attributed to the irreversible oxidation behavior of 1 (see the Electrochemistry section) resulting in degradation of the complex. The current, however, showed a further increase with time after crossing the point of maximum luminance. This opposing behavior of luminance and current is due to the continuous growth of the doped regions beyond what is necessary for an efficient operation of LEC devices and results in device degradation.44
To further study the material, the LEC was also tested under constant current conditions (galvanostatic mode), an operational protocol previously reported to be advantageous for the performance of the devices such as accelerated turn-on time.45 A constant current density of 2.5 mA cm−2 was applied to the LEC and the temporal evolution of the luminance, voltage and efficiency is illustrated in Fig. 8. Compared to the constant voltage mode, a nearly eight-fold increase in maximum brightness (113 cd m−2) accompanied by a more than two-fold gain in current efficiency (4.71 cd A−1 and 1.95 lm W−1, respectively) was achieved. The device response was also very fast, with a turn-on time of around 17 s. Another striking feature is the bluish-green appearance of the device at the moment of maximum brightness demonstrated by the CIE 1931 coordinates of (0.24, 0.40).
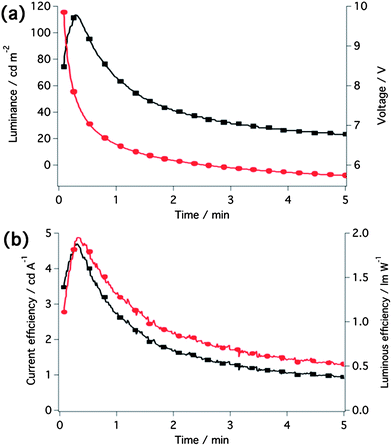 | ||
| Fig. 8 (a) Luminance and voltage and (b) current and luminous efficiency over time of the LEC operated at a fixed current density of 2.5 mA cm−2. | ||
A summary of the electrical characteristics of the LEC incorporating 1 is given in Table 1. We now compare complex 1 to the previously published blue-emitting Ir-iTMCs in LEC environments in combination with an ionic liquid.11,12,15,19,23 We stress that in the present case no optimization has been carried out concerning the device configuration and active layer composition.
In 2008 He et al. published a greenish-blue LEC having CIE coordinates of (0.20, 0.28) and moderate brightness (39 cd m−2) and current efficiency (0.65 cd A−1).11 However, the very slow device response resulted in maximum brightness achieved only after 7 hours. Ionic liquid was added to reduce the turn-on time to 1 hour at the expense of the performance. The light intensity and efficiency decreased to 23 cd m−2 and 0.51 cd A−1, respectively, and the color point significantly red-shifted (CIE: 0.33 and 0.45), which was attributed to the electrical excitation. Under a high electrical field in LEC devices, the molecular orbitals of the ionic complex might be polarized and, thus, the energy of the emitting state would decrease, resulting in the red-shift of the EL spectrum.46 When using complex 1 in a LEC configuration with IL similar to that used by He et al., and by applying a similar driving voltage (6 V), we achieve a more bluish LEC (CIE: 0.28, 0.43) with a much faster turn-on time of only 3.6 minutes and a threefold increase in efficiency to 1.76 cd A−1 at a comparable light intensity.
Yang et al. presented blue-green emitting LECs with light intensities and response times similar to our devices under constant voltage conditions.23 Although devices using complex B showed deeper blue electroluminescence (CIE: 0.20 and 0.34) than our device with 1, efficiencies were lower by a factor of two.
In 2009 He et al.12 demonstrated for the first time reasonable current efficiencies as high as 8.4 cd A−1 for blue-emitting LECs, and even high efficiencies of nearly 20 cd A−1 have recently been demonstrated by the same group.15 Although, these high values have been achieved at very low light levels of only 39 and 15 cd m−2. Moreover, the turn-on time of those LECs was very long (20 to 30 minutes). In contrast, we present LEC devices with fast response (17 s) having a moderate light intensity of over 100 cd m−2 and a reasonable efficiency of almost 5 cd A−1 with similar CIE coordinates as shown in the aforementioned papers.
Concerning the lifetime of our devices, we want to stress that stability in general seems to be a limiting factor in blue-emitting LEC devices to date. To the best of our knowledge, there are only a few publications that explicitly display stability values of blue LECs ranging from minutes to few hours.16,19,23,26
Conclusion
In conclusion a new charged bis-cyclometallated iridium(III) complex having deep-blue emission at 440 nm is reported. The design is based on the 2′,6′-difluoro-2,3′-bipyridine skeleton as the main ligand and a bis-imidazolium carbene-type ancillary ligand. Furthermore, bulky tert-butyl substituents are used to limit the intermolecular interactions. Electrochemical and photophysical properties point to an emission from the main ligand in contrast to the commonly used cationic iridium(III) complexes based on N⁁N ancillary ligands. This result is further supported by theoretical calculations. Light-emitting Electrochemical Cells (LECs) have been studied both at constant voltage (6 V) and constant current (2.5 mA cm−2). The performances are significantly improved with the latter method. This results overall in one of the best reported greenish-blue LEC having fast response (17 s), light intensity over 100 cd m−2 and a reasonable efficiency of almost 5 cd A−1.Experimental section
Materials and methods
[Ir(COD)(μ-Cl)]2 was purchased from MCAT (Germany). 4-(tert-Butyl)-2-chloropyridine21 and 2,6-difluoropyridiyl-3-boronic acid33 were synthesized as previously reported. All other materials and solvents were of reagent quality and used as received. 1H and 13C NMR spectra were recorded using a Bruker AV 400 MHz spectrometer. Chemical shifts δ (in ppm) are referenced to residual solvent peaks. For 1H NMR: CDCl3, 7.24 ppm and for 13C NMR: CDCl3, 77.0 ppm. 19F and 31P NMR were recorded using a Bruker AV 200 MHz spectrometer. Coupling constants are expressed in hertz (Hz). High-resolution mass spectra (HRMS) were obtained with a Waters Q-TOF-MS instrument by electro spray ionization (ESI). UV-visible spectra were recorded in a 1 cm path length quartz cell on a Hewlett Packard 8453 spectrophotometer. Emission spectra were recorded on a Fluorolog 3-22 using a 90° optical geometry. The emission spectra were photometrically corrected using a NBS calibrated 200 W tungsten lamp as the reference source. The quantum yields were determined using fluorescein (10−5 M in 0.1 M NaOH; air equilibrated; QY = 0.93) as the standard.47 Excited-state lifetimes were measured using a FL-1061PC TCSPC and a 371 nm Nanoled as the excitation source. Solutions were degassed by gently bubbling argon for 30 min and the concentration corrected for the solvent evaporation. The photoluminescence spectrum and quantum yield of 1 in thin films were measured with a Hamamatsu C9920-02 Absolute PL Quantum Yield Measurement System. Voltammetric measurements employed a PC controlled AutoLab PSTAT10 electrochemical workstation. Cyclic voltammograms (CV) were obtained at a scan rate of 100 mV s−1 using 0.1 M TBAPF6 as the supporting electrolyte in acetonitrile (MeCN). Glassy carbon, platinum plate and platinum wire were employed as working, counter and reference electrodes, respectively. At the end of each measurement, ferrocene was added as the internal reference.X-ray data for 1
Data collection for the X-ray crystal structure was performed at low temperature [100(2) K] using Mo-Ka radiation on a Bruker APEX II CCD, having kappa geometry. The dataset was reduced by means of EvalCCD48 and then corrected for absorption.49 The solution and refinement were performed by SHELX.50 The crystal structure was refined using full-matrix least-squares based on F2 with all non-hydrogen atoms anisotropically defined. Hydrogen atoms were placed in calculated positions by means of the “riding” model. C38.39H40.78Cl2.78F10IrN8P, Mr 1125.88, triclinic, space group P![[1 with combining macron]](https://www.rsc.org/images/entities/char_0031_0304.gif) , a = 11.4876(11) Å, b = 19.033(3) Å, c = 21.883(3) Å, α = 78.208(12)°, β = 88.161(10)°, γ = 79.175(11)°, V = 4600.1(11) Å3, Z = 4, dcalcd = 1.626 g cm−3, F(000) = 2225, μ = 3.177 mm−1, 2θmax = 50.00°, index ranges −13 ≤ h ≤ 13, −22 ≤ k ≤ 22, −26 ≤ l ≤ 25, 70477 data: (15694 unique), R(int) = 0.1033, 1301 parameters, R1 (I > 2σ(I)) = 0.0505, wR2 = 0.0998, Gof on F2 = 1.051, and ΔFmax (ΔFmin) = 1.417 (−1.795) e Å−3.
, a = 11.4876(11) Å, b = 19.033(3) Å, c = 21.883(3) Å, α = 78.208(12)°, β = 88.161(10)°, γ = 79.175(11)°, V = 4600.1(11) Å3, Z = 4, dcalcd = 1.626 g cm−3, F(000) = 2225, μ = 3.177 mm−1, 2θmax = 50.00°, index ranges −13 ≤ h ≤ 13, −22 ≤ k ≤ 22, −26 ≤ l ≤ 25, 70477 data: (15694 unique), R(int) = 0.1033, 1301 parameters, R1 (I > 2σ(I)) = 0.0505, wR2 = 0.0998, Gof on F2 = 1.051, and ΔFmax (ΔFmin) = 1.417 (−1.795) e Å−3.4-(tert-Butyl)-2′,6′-difluoro-2,3-bipyridine (L1)
4-(tert-Butyl)-2-chloropyridine (0.85 g, 5 mmol) was dissolved in THF (30 mL) and water (10 mL) and the solution was degassed for 15 min by bubbling nitrogen. The solution was added via a cannula to a nitrogen-filled two neck-flask containing 2,6-difluoropyridiyl-3-boronic acid (0.95 g, 6 mmol, 1.2 eq.), K2CO3 (1.04 g, 7.5 mmol, 1.5 eq.) and [Pd(PPh3)4] (0.29 g, 0.25 mmol, 5 mol%). The mixture was heated to 85 °C overnight. After cooling to ambient temperature the layers were separated and the aqueous layer was extracted twice with ethyl acetate. The combined organic layers were dried over MgSO4 and the solvent was removed in vacuo. The crude product was purified by column chromatography on silica gel using CH2Cl2 as eluent. The product was obtained as pale yellow oil. Yield: 296 mg (1.19 mmol, 24%). 1H NMR (400 MHz, CDCl3): δ 8.65–8.59 (m, 1H, ArH), 8.59 (dd, J = 5.2 and 0.7 Hz, 1H, ArH), 7.82 (dt, J = 1.9 and 0.8 Hz, 1H, ArH), 7.28 (dd, J = 5.3 and 1.9 Hz, 1H, ArH), 6.94 (ddd, J = 8.2, 3.0 and 0.8 Hz, 1H, ArH), 1.35 (s, 9H, and C(CH3)3) ppm.[Ir(L1)2(μ-Cl)]2
[Ir(COD)(μ-Cl)]2 (2.02 g, 3.0 mmol) was suspended in 9 mL of 2-ethoxyethanol in a 50 mL flask. The suspension was evacuated and back-filled with nitrogen (3 cycles). The ligand L1 (2.98 g, 12.0 mmol, 4.0 eq.) was added and 1 mL of 2-ethoxyethanol was used for rinsing. The suspension turned pale yellow immediately and was evacuated and back-filled with nitrogen again (3 cycles). The flask was closed and heated at 130 °C for 3 hours. Upon heating the solution turned orange and within half an hour a yellow precipitate appeared. After 3 hours, the volume of solvent was reduced under vacuum and 20 mL of methanol were added to precipitate the product. Then the precipitate was collected on a glass-frit, washed with methanol and dried in vacuo to afford 4.2 g (2.9 mmol, 97%) of the product as yellow solid. 1H NMR (CDCl3, 400 MHz): δ 8.98 (d, J = 6.1 Hz, 4H, ArH); 8.34 (t, J = 2.2 Hz, 4H, ArH); 6.98 (dd, J = 6.2 Hz, J = 2.1 Hz, 4H, ArH); 5.08 (s, 4H, ArH); 1.52 (s, 36H, tBu).1,1′-Dimethyl-3,3′-methylenediimidazolium diiodide (L2)
1-Methylimidazole (1.2 mL, 15 mmol, 3 eq.) and diiodomethane (1.34 g, 5 mmol, 1 eq.) were dissolved in 15 mL of toluene and heated to 80 °C overnight. After cooling to ambient temperature, the white precipitate was collected on a glass frit, washed with 15 mL of toluene and dried in vacuo to obtain the pure product as white solid. The filtrate was concentrated and further heated to 95 °C to increase the yield. Yield: 82%. 1H NMR (400 MHz, DMSO-D6): δ 9.38 (s, 2H, NCHN), 7.97 (t, 3JHH = 1.7 Hz, 2H, ArH), 7.80 (t, 3JHH = 1.6 Hz, 2H, ArH), 6.66 (s, 2H, NCH2N), 3.91 (s, 6H, NCH3) ppm.Complex 1
A mixture of L2 (1.17 g, 2.7 mmol, 2.1 eq.), silver(I) oxide (0.62 g, 02.7 mmol, 2.1 eq.) and [Ir(L1)2(μ-Cl)]2 (1.85 g, 1.28 mmol, 1 eq.) in 1,2-dichloroethane (100 mL) was heated to 95 °C overnight under nitrogen. After cooling to ambient temperature, the mixture was filtered through celite to remove silver residues. The celite was washed with CH2Cl2 and the solvent was removed in vacuo. The crude product was purified by column chromatography on silica gel (basified by adding 2 mL of NEt3 to 100 g of SiO2) using CH2Cl2/acetone = 4/1 as solvent. After removing front impurities, KPF6 was added to the solvent mixture to elute the product as the corresponding PF6 salt. After evaporation of the solvent, the residue was re-dissolved in CH2Cl2 and extracted with water to remove excess KPF6. The organic layer was dried over MgSO4 and concentrated to obtain 1.49 g of a yellow solid. The product was re-crystallized from CH2Cl2/heptane to yield the pure 1 as a pale yellow solid. Yield: 1.14 g (1.13 mmol, 44%). 1H NMR (400 MHz, CDCl3): δ 8.32 (br s, 2H, ArH), 8.02 (d, 3JHH = 6.2 Hz, 2H, ArH), 7.45 (d, 4JHH = 0.9 Hz, 2H, ArH), 7.25 (dd, 3JHH = 6.2 Hz, 4JHH = 1.5 Hz, 2H, ArH), 6.86 (d, 4JHH = 0.8 Hz, 2H, ArH), 6.10 (s, 2H, ArH), 5.74 (s, 2H, NCH2N), 2.89 (s, 6H, NCH3), and 1.41 (s, 18H, C(CH3)3) ppm. 13C NMR (100 MHz, CDCl3): δ 185.7 (NCN), 164.2, 163.6, 163.5, 159.3, 152.5, 124.1, 122.6, 122.0, 121.1, 120.9, 108.8, 108.5 (ArC), 62.4 (NCH2), 37.6 (NCH3), 35.5 (C(CH3)3), 30.4 (C(CH3)3) ppm. 31P NMR (81 MHz, CDCl3): δ −144.2 (sept, 1JPF = 713 Hz, PF6) ppm. 19F NMR (188 MHz, CDCl3): δ −67.3 (d, J = 8.9 Hz, ArF), −70.5 (d, J = 8.8 Hz, ArF), −72.0 (d, 1JPF = 712 Hz, PF6) ppm. HRMS (ESI-TOF) m/z (%): calcd 863.2787; found 863.2785 (100) [(M − PF6)+]. Anal. calcd for C37H38F10IrN8P (1007.93): C 44.09, H 3.80, N 11.12; found: C 44.15, H 3.57, N 10.83%.Computational details
Density functional calculations (DFT) were carried out with the C.01 revision of the Gaussian 09 program package51 using Becke's three-parameter B3LYP exchange-correlation functional52,53 together with the 6-31G** basis set for C, H, F, and N,54 and the “double-ζ” quality LANL2DZ basis set for the Ir element.55 An effective core potential (ECP) replaces the inner core electrons of Ir leaving the outer core [(5s)2(5p)6] electrons and the (5d)6 valence electrons of Ir(III). The geometries of the singlet ground state and of the lowest-energy triplet state were fully optimized without imposing any symmetry restriction. The geometry of the first triplet state was first calculated at the spin-unrestricted UB3LYP level with a spin multiplicity of 3. The expected values calculated for S2 were always smaller than 2.05.All the calculations were performed in the presence of the solvent (acetonitrile). Solvent effects were considered within the self-consistent reaction field (SCRF) theory using the SMD keyword that performs a polarized continuum model (PCM)56–58 calculation using the solvation model of Truhlar et al.59 The SMD solvation model is based on the polarized continuous quantum chemical charge density of the solute (the “D” in the name stands for “density”).
Time-dependent DFT (TD-DFT)60–62 calculations of the lowest-lying triplets and singlets were performed in the presence of the solvent at the minimum-energy geometry optimized for the ground state (S0). Up to 40 singlet and 40 triplet states were calculated. The geometries of the two lowest-energy triplets (T1 and T2) of complex 1 were fully optimized at the TD-DFT level.
Fabrication and characterization of LEC devices
Methyl ethyl ketone (MEK) (ACS reagent, ≥99.0%) and 1-butyl-3-methyl-imidazolium hexafluorophosphate [BMIM][PF6] (purum, ≥97.0%) were obtained from Sigma Aldrich and were used as received. Poly-(3,4-ethylenedioxythiophene)-poly-(styrenesulfonate) aqueous dispersion (PEDOT:PSS) (CleviosTM P VP AI4083) was purchased from Heraeus (formerly H. C. Starck). Indium tin oxide (ITO)-coated glass plates were patterned using conventional photolithography. Before deposition of the organic layers, the substrates were extensively cleaned by sonication in detergent baths and subsequent oxygen plasma treatment.LEC devices were prepared as follows. Three percent by weight of complex 1 and [BMIM][PF6] in a molar ratio of 3:1 were dissolved in 0.5 mL of MEK. The solution was filtered using a 0.1 μm PTFE-filter and spin-coated on top of a ITO/PEDOT:PSS substrate under ambient conditions giving rise to a transparent thin film. The pre-coated 100 nm PEDOT:PSS layer was deposited to planarize the ITO anode, increasing the yield and reproducibility of working devices. After coating, the substrate was transferred to a N2 filled glovebox (O2 and H2O < 1 ppm) and annealed on a hotplate at 100 °C for 1 hour resulting in a final active layer thickness of 100 nm. Finally, a 150 nm thick aluminum (Al) cathode was thermally evaporated on top under high vacuum (<1 × 10⁻⁶ mbar) using a shadow mask, defining 8 pixels per substrate, each having an active lighting area of 4 mm2. The device was encapsulated by a glass capping layer to protect the organic layers against penetrating oxygen and water.
The thicknesses of the films were determined using a KLA Tencor P·15 profilometer. The electro-optical characterization was carried out in a Botest OLED Lifetime Test System (OLT) under a constant voltage of 6 V and a constant current density of 2.5 mA cm−2, respectively, at a constant temperature of 20 °C. The photo-diodes were calibrated using a Photo Research PR-650 SpectraScan® Colorimeter and simultaneously the electroluminescent spectra of the LEC devices were detected in the visible range between 380 and 780 nm at a constant voltage of 6 V.
Acknowledgements
This work has been supported by the European Union (CELLO, STRP 248043; http://www.cello-project.eu/), the Spanish Ministry of Economy and Competitiveness (MINECO) (MAT2011-24594, CTQ2009-08790 and Consolider-Ingenio CSD2007-00010) and the Generalitat Valenciana (PROMETEO/2012/053). D.T. and M.D. acknowledge the support of a FPU grant of the Spanish Ministry of Education, Culture and Sport (MECD).Notes and references
- A. P. Wilde, K. A. King and R. J. Watts, J. Phys. Chem., 1991, 95, 629 CrossRef CAS.
- M. G. Colombo, A. Hauser and H. U. Güdel, Inorg. Chem., 1993, 32, 3088 CrossRef CAS.
- G. Di Marco, M. Lanza, M. Pieruccini and S. Campagna, Adv. Mater., 1996, 8, 576 CrossRef CAS.
- F. Neve, A. Crispini, S. Campagna and S. Serroni, Inorg. Chem., 1999, 38, 2250 CrossRef CAS.
- J. D. Slinker, A. A. Gorodetsky, M. S. Lowry, J. J. Wang, S. Parker, R. Rohl, S. Bernhard and G. G. Malliaras, J. Am. Chem. Soc., 2004, 126, 2763 CrossRef CAS.
- H. C. Su, H. F. Chen, C. C. Wu and K. T. Wong, Chem.–Asian J., 2008, 3, 1922 CrossRef CAS.
- H. J. Bolink, E. Coronado, R. D. Costa, E. Ortí, M. Sessolo, S. Graber, K. Doyle, M. Neuburger, C. E. Housecroft and E. C. Constable, Adv. Mater., 2008, 20, 3910 CrossRef CAS.
- R. D. Costa, E. Orti, H. J. Bolink, S. Graber, C. E. Housecroft and E. C. Constable, Chem. Commun., 2011, 47, 3207 RSC.
- R. D. Costa, E. Orti, H. J. Bolink, S. Graber, S. Schaffner, M. Neuburger, C. E. Housecroft and E. C. Constable, Adv. Funct. Mater., 2009, 19, 3456 CrossRef CAS.
- E. Margapoti, V. Shukla, A. Valore, A. Sharma, C. Dragonetti, C. C. Kitts, D. Roberto, M. Murgia, R. Ugo and M. Muccini, J. Phys. Chem. C, 2009, 113, 12517 CAS.
- L. He, L. Duan, J. Qiao, R. J. Wang, P. Wei, L. D. Wang and Y. Qiu, Adv. Funct. Mater., 2008, 18, 2123 CrossRef CAS.
- L. He, J. Qiao, L. Duan, G. F. Dong, D. Q. Zhang, L. D. Wang and Y. Qiu, Adv. Funct. Mater., 2009, 19, 2950 CrossRef CAS.
- E. Orselli, R. Q. Albuquerque, P. M. Fransen, R. Fröhlich, H. M. Janssen and L. De Cola, J. Mater. Chem., 2008, 18, 4579 RSC.
- H. C. Su, H. F. Chen, F. C. Fang, C. C. Liu, C. C. Wu, K. T. Wong, Y. H. Liu and S. M. Peng, J. Am. Chem. Soc., 2008, 130, 3413 CrossRef CAS.
- L. He, L. A. Duan, J. A. Qiao, G. F. Dong, L. D. Wang and Y. Qiu, Chem. Mater., 2010, 22, 3535 CrossRef CAS.
- T. Hu, L. Duan, J. Qiao, L. He, D. Zhang, R. Wang, L. Wang and Y. Qiu, Org. Electron., 2012, 13, 1948 CrossRef CAS.
- F. Kessler, R. D. Costa, D. Di Censo, R. Scopelliti, E. Ortí, H. J. Bolink, S. Meier, W. Sarfert, M. Grätzel, M. K. Nazeeruddin and E. Baranoff, Dalton Trans., 2012, 41, 180 RSC.
- S. Ladouceur, D. Fortin and E. Zysman-Colman, Inorg. Chem., 2011, 50, 11514 CrossRef CAS.
- M. Mydlak, C. Bizzarri, D. Hartmann, W. Sarfert, G. Schmid and L. De Cola, Adv. Funct. Mater., 2010, 20, 1812 CrossRef CAS.
- M. K. Nazeeruddin, R. T. Wegh, Z. Zhou, C. Klein, Q. Wang, F. De Angelis, S. Fantacci and M. Gratzel, Inorg. Chem., 2006, 45, 9245 CrossRef CAS.
- N. M. Shavaleev, F. Monti, R. D. Costa, R. Scopelliti, H. J. Bolink, E. Ortí, G. Accorsi, N. Armaroli, E. Baranoff, M. Grätzel and M. K. Nazeeruddin, Inorg. Chem., 2012, 51, 2263 CrossRef CAS.
- A. B. Tamayo, S. Garon, T. Sajoto, P. I. Djurovich, I. M. Tsyba, R. Bau and M. E. Thompson, Inorg. Chem., 2005, 44, 8723 CrossRef CAS.
- C. H. Yang, J. Beltran, V. Lemaur, J. Cornil, D. Hartmann, W. Sarfert, R. Frohlich, C. Bizzarri and L. De Cola, Inorg. Chem., 2010, 49, 9891 CrossRef CAS.
- F. Zhang, L. Duan, J. Qiao, G. Dong, L. Wang and Y. Qiu, Org. Electron., 2012, 13, 1277 CrossRef CAS.
- D. Di Censo, S. Fantacci, F. De Angelis, C. Klein, N. Evans, K. Kalyanasundaram, H. J. Bolink, M. Gratzel and M. K. Nazeeruddin, Inorg. Chem., 2008, 47, 980 CrossRef CAS.
- D. Tordera, M. Delgado, E. Ortí, H. J. Bolink, J. Frey, M. K. Nazeeruddin and E. Baranoff, Chem. Mater., 2012, 24, 1896 CrossRef CAS.
- S. Meng, I. Jung, J. Feng, R. Scopelliti, D. Di Censo, M. Grätzel, M. K. Nazeeruddin and E. Baranoff, Eur. J. Inorg. Chem., 2012, 3209 CrossRef CAS.
- H. J. Bolink, L. Cappelli, S. Cheylan, E. Coronado, R. D. Costa, N. Lardies, M. K. Nazeeruddin and E. Orti, J. Mater. Chem., 2007, 17, 5032 RSC.
- T. D. Anthopoulos, M. J. Frampton, E. B. Namdas, P. L. Burn and I. D. W. Samuel, Adv. Mater., 2004, 16, 557 CrossRef CAS.
- P. L. Burn, S. C. Lo and I. D. W. Samuel, Adv. Mater., 2007, 19, 1675 CrossRef CAS.
- S. C. Lo, R. N. Bera, R. E. Harding, P. L. Burn and I. D. W. Samuel, Adv. Funct. Mater., 2008, 18, 3080 CrossRef CAS.
- S. C. Lo, N. A. H. Male, J. P. J. Markham, S. W. Magennis, P. L. Burn, O. V. Salata and I. D. W. Samuel, Adv. Mater., 2002, 14, 975 CAS.
- S. J. Lee, K. M. Park, K. Yang and Y. Kang, Inorg. Chem., 2009, 48, 1030 CrossRef CAS.
- E. Baranoff, B. F. E. Curchod, J. Frey, R. Scopelliti, F. Kessler, I. Tavernelli, U. Rothlisberger, M. Grätzel and M. K. Nazeeruddin, Inorg. Chem., 2012, 51, 215 CrossRef CAS.
- E. Baranoff, B. F. E. Curchod, F. Monti, F. Steimer, G. Accorsi, I. Tavernelli, U. Rothlisberger, R. Scopelliti, M. Grätzel and M. K. Nazeeruddin, Inorg. Chem., 2012, 51, 799 CrossRef CAS.
- K. Nozaki, K. Takamori, Y. Nakatsugawa and T. Ohno, Inorg. Chem., 2006, 45, 6161 CrossRef CAS.
- F. De Angelis, S. Fantacci, N. Evans, C. Klein, S. M. Zakeeruddin, J.-E. Moser, K. Kalyanasundaram, H. J. Bolink, M. Grätzel and M. K. Nazeeruddin, Inorg. Chem., 2007, 46, 5989 CrossRef CAS.
- S. T. Parker, J. D. Slinker, M. S. Lowry, M. P. Cox, S. Bernhard and G. G. Malliaras, Chem. Mater., 2005, 17, 3187 CrossRef CAS.
- J. C. deMello, N. Tessler, S. C. Graham and R. H. Friend, Phys. Rev. B: Condens. Matter, 1998, 57, 12951 CrossRef CAS.
- J. Slinker, D. Bernards, P. L. Houston, H. D. Abruna, S. Bernhard and G. G. Malliaras, Chem. Commun., 2003, 2392 RSC.
- J. D. Slinker, J. Rivnay, J. S. Moskowitz, J. B. Parker, S. Bernhard, H. D. Abruna and G. G. Malliaras, J. Mater. Chem., 2007, 17, 2976 RSC.
- Q. Pei, Y. Yang, G. Yu, C. Zhang and A. J. Heeger, J. Am. Chem. Soc., 1996, 118, 3922 CrossRef CAS.
- P. Matyba, K. Maturova, M. Kemerink, N. D. Robinson and L. Edman, Nat. Mater., 2009, 8, 672 CrossRef CAS.
- M. Lenes, G. Garcia-Belmonte, D. Tordera, A. Pertegas, J. Bisquert and H. J. Bolink, Adv. Funct. Mater., 2011, 21, 1581 CrossRef CAS.
- J. F. Fang, P. Matyba and L. Edman, Adv. Funct. Mater., 2009, 19, 2671 CrossRef CAS.
- Y.-M. Wang, F. Teng, Y.-B. Hou, Z. Xu, Y.-S. Wang and W.-F. Fu, Appl. Phys. Lett., 2005, 87, 233512 CrossRef.
- J. Shen and R. D. Snook, Chem. Phys. Lett., 1989, 155, 585 Search PubMed.
- A. J. M. Duisenberg, L. M. J. Kroon-Batenburg and A. M. M. Schreurs, J. Appl. Crystallogr., 2003, 36, 220 CrossRef CAS.
- R. H. Blessing, Acta Crystallogr., Sect. A: Found. Crystallogr., 1995, 51, 33 CrossRef.
- G. M. Sheldrick, Acta Crystallogr., Sect. A: Found. Crystallogr., 2008, 64, 112 CrossRef.
- M. J. Frisch, G. W. Trucks, H. B. Schlegel, G. E. Scuseria, M. A. Robb, J. R. Cheeseman, G. Scalmani, V. Barone, B. Mennucci, G. A. Petersson, H. Nakatsuji, M. Caricato, X. Li, H. P. Hratchian, A. F. Izmaylov, J. Bloino, G. Zheng, J. L. Sonnenberg, M. Hada, M. Ehara, K. Toyota, R. Fukuda, J. Hasegawa, M. Ishida, T. Nakajima, Y. Honda, O. Kitao, H. Nakai, T. Vreven, J. A. Montgomery, J. E. Peralta, F. Ogliaro, M. Bearpark, J. J. Heyd, E. Brothers, K. N. Kudin, V. N. Staroverov, T. Keith, R. Kobayashi, J. Normand, K. Raghavachari, A. Rendell, J. C. Burant, S. S. Iyengar, J. Tomasi, M. Cossi, N. Rega, J. M. Millam, M. Klene, J. E. Knox, J. B. Cross, V. Bakken, C. Adamo, J. Jaramillo, R. Gomperts, R. E. Stratmann, O. Yazyev, A. J. Austin, R. Cammi, C. Pomelli, J. W. Ochterski, R. L. Martin, K. Morokuma, V. G. Zakrzewski, G. A. Voth, P. Salvador, J. J. Dannenberg, S. Dapprich, A. D. Daniels, Ö. Farkas, J. B. Foresman, J. V. Ortiz, J. Cioslowski and D. J. Fox, GAUSSIAN 09 (Revision C.01), Gaussian Inc., Wallingford CT, 2010 Search PubMed.
- A. D. Becke, J. Chem. Phys., 1993, 98, 5648 CrossRef CAS.
- C. Lee, W. Yang and R. G. Parr, Phys. Rev. B, 1988, 37, 785 CrossRef CAS.
- M. M. Francl, W. J. Pietro, W. J. Hehre, J. S. Binkley, M. S. Gordon, D. J. Defrees and J. A. Pople, J. Chem. Phys., 1982, 77, 3654 CrossRef CAS.
- P. J. Hay and W. R. Wadt, J. Chem. Phys., 1985, 82, 299 CrossRef CAS.
- J. Tomasi and M. Persico, Chem. Rev., 1994, 94, 2027 CrossRef CAS.
- C. S. Cramer and D. G. Truhlar, Solvent Effects and Chemical Reactivity, Kluwer, Dordrecht, 1996, p. 1–80 Search PubMed.
- J. Tomasi, B. Mennucci and R. Cammi, Chem. Rev., 2005, 105, 2999 CrossRef CAS.
- A. V. Marenich, C. J. Cramer and D. G. Truhlar, J. Phys. Chem. B, 2009, 113, 6378 CrossRef CAS.
- M. E. Casida, C. Jamorski, K. C. Casida and D. R. Salahub, J. Chem. Phys., 1998, 108, 4439 CrossRef CAS.
- C. Jamorski, M. E. Casida and D. R. Salahub, J. Chem. Phys., 1996, 104, 5134 CrossRef CAS.
- M. Petersilka, U. J. Gossmann and E. K. U. Gross, Phys. Rev. Lett., 1996, 76, 1212 CrossRef CAS.
Footnotes |
| † Electronic supplementary information (ESI) available. CCDC 892956. For ESI and crystallographic data in CIF or other electronic format see DOI: 10.1039/c2tc00251e |
| ‡ Present address: Siemens AG, Corporate Technology, CT RTC MAT MPV-DE, Günther-Scharowsky Strasse 1, DE-91058 Erlangen, Germany. |
| This journal is © The Royal Society of Chemistry 2013 |