Nanomaterials and biomaterials in electrochemical arrays for protein detection
James F.
Rusling
*abcd,
Gregory W.
Bishop
a,
Nhi M.
Doan
b and
Fotios
Papadimitrakopoulos
ab
aDepartment of Chemistry, University of Connecticut, 55 North Eagleville Road, Storrs, Connecticut 06269, USA
bInstitute of Materials Science, University of Connecticut, Storrs, CT 06269-3136, USA
cDepartment of Cell Biology, University of Connecticut Health Center, Farmington, Connecticut 06032, USA
dSchool of Chemistry, National University of Ireland at Galway, Ireland
First published on 24th October 2013
Abstract
Nanomaterials and biomaterials are important components of new electrochemical arrays designed for sensitive detection of proteins in biological fluids. Such multiplexed protein arrays are predicted to have an important future in personalized medical diagnostics, especially for cancer and heart disease. Sandwich immunoassays for proteins benefit greatly in sensitivity from the use of nanostructured sensor surfaces and multilabeled detection strategies involving nano- or microparticles. In these assays, capture agents such as antibodies or aptamers are attached to sensor surfaces in the array. Target proteins with large binding constants for the affinity agents are captured from liquid samples with high efficiency, either on the sensors or on magnetic bioconjugate particles decorated with many copies of labels and antibodies. After target proteins are captured on the sensor surfaces, the labels are detected by electrochemical techniques. This feature article begins with an overview of the recent history of nanoparticles in electrochemical protein sensors, then moves on to specific examples from our own laboratories. We discuss fabrication of nanostructured sensors and arrays with the aim of multiplexed detection as well as reusability. Following this, we describe systems that integrate particle-based protein sensing with microfluidics for multiplexed protein detection. We end with predictions on the diagnostic future of protein detection.
1. Introduction
Historically, progress in electrochemistry has been linked to progress in materials science. Prior to the 1920s, quantitative analytical measurements in electrochemistry were not common because of the difficulty of preparing pristine metal electrode surfaces that would retain their properties throughout the experiment without fouling.1 Current vs. voltage scans for the detection of small amounts of inorganic ions or organic compounds dissolved in solution were virtually unknown before the 1920s. In 1922, Jaraslov Heyrovsky at Charles University in Prague reported the use of a dropping mercury electrode (DME) to obtain current–voltage curves of metal ions. This discovery marked the birth of modern electrochemical analysis. The DME utilizes slowly growing drops of Hg formed at the end of a capillary tube as electrodes, and achieved pristine Hg surfaces for electrolysis that are renewed every few seconds when the drop falls off and a new drop of Hg begins to form. Each new drop presents a new, clean electrode. This approach solved the problem of electrode fouling, but only for one electrode material.As time progressed, research in materials science began to greatly improve our understanding of how to reproducibly prepare and clean solid electrode surfaces.2 Since the late 1960s, Au, carbon, Ag, Pt, and other solid working electrodes have gradually become commonplace electroanalytical tools. In the more recent era of nanomaterials, biosensors and other electroanalytical applications have capitalized on special properties of nanostructured electrodes3 featuring thin films of carbon nanotubes,4 graphene,6 metal nanoparticles,7 and nanostructured electrodeposited metals.8,9 In bioanalytical sensors, nanostructured electrodes provide excellent templates for attaching large surface concentrations of capture agents for analytes, while simultaneously providing good access of the analytes to these agents on the rough or convoluted high area surfaces of these sensors.
In particular, as we show below, sandwich immunoassays can benefit greatly from the use of nanostructured sensor surfaces. In these assays, capture agents such as antibodies or aptamers are attached to surfaces, and analytes such as proteins with high binding constants for these affinity agents (low nM dissociation constants) are captured from liquid samples with very high efficiency. After washing, a second antibody with a measurable label can be added to bind to the captured analyte. After additional washing, this label is detected, usually by optical or electrochemical techniques. A modern variation leading to ultrasensitive assays is the use of dissolvable nanoparticles or nanoparticles decorated with multiple measureable species as labels.10–13
Sensitive, accurate protein measurements are central to progress in biomedical research and modern clinical practice. Biomarker proteins are “molecules that can be objectively measured and evaluated as indicators of normal or disease processes and pharmacologic responses to therapeutic intervention”.10 Many proteins are secreted into the blood in larger than normal amounts at very early stages of cancer development, and throughout progression of the cancer. If it becomes possible to accurately measure serum levels of reliable diagnostic panels of these proteins, cancer prediction without the need to detect tumors would become a reality.10,11 Many biomarker proteins are specific to several types of cancer and inflammation, and this issue coupled with individual variability of patients and their cancers dictates that panels of such biomarker proteins will be much more reliable than single biomarkers to assess patient status.10,14,15
Approaches are being developed for ultrasensitive multiplexed protein detection employing nanomaterials such as quantum dots, nanoparticles, nanotubes or magnetic particles to enhance sensitivity.10–13,16 For diagnostic purposes, detection devices should be able to accurately measure normal and elevated serum levels of multiple proteins rapidly and at low cost. Concentrations in serum may be in the sub-pg mL−1 to high ng mL−1 ranges for different proteins, and possible interferences include thousands of non-biomarker proteins present in the serum.
This feature article will address materials aspects of advanced devices designed for multiple protein detection. After a broad summary of the research area, specific examples will be taken mainly from our own research. The next section of this review describes sandwich immunoassays in detail, and the recent history of nanoparticles in electrochemical protein sensors and detection protocols. Next, we discuss construction of nanostructured sensors and arrays with the aim of multiplexed detection. Following this, we discuss integrating particle-based sensing with microfluidics for multiplexed protein detection. We end with an overview and comments on the future of multiplexed protein detection.
2. Immunoassays, nanoparticles, and nanostructured protein sensor design
2.1. Nanomaterials in electrochemical immunoassays
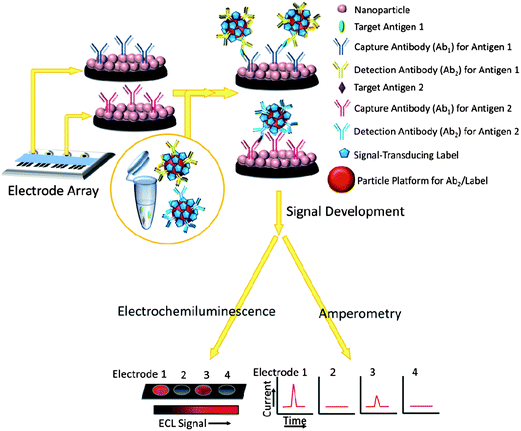
The use of nanoparticle labels and magnetic beads predates the use of nanostructured protein immunosensors, so we begin by describing research in this area.10,11,13,16,17 Nanomaterials have been used to enhance sensitivity and performance in sandwich immunoassay formats similar to enzyme-linked immunosorbent assays (ELISA), which have served as workhorse methods for clinical protein determinations. Classic ELISAs typically have detection limits (DL) of 1–10 pg mL−1 for proteins in biological samples,17 but are limited for modern cancer diagnostics by analysis time, cost, sample size, and difficulty of multiplexing. (DLs in these assays are usually defined as the signal just significantly larger than the zero analyte blank plus 3× the standard deviation of the measurements.)Sandwich immunoassays are illustrated for an immunoarray format in Fig. 1. Spots in the array are shown featuring a nanoparticle bed, while in classic ELISA the spots are located in wells of a 96-or-greater well plate. The spots typically have capture or primary antibodies (Ab1) attached to an underlying substrate (e.g. the bottom of the well or the nanoparticle bed) that isolate analyte proteins from the sample. After the analytes bind to these antibodies, interferences are washed away with detergent–protein and/or detergent solutions that block non-specific binding (NSB). Next, a second labeled detection antibody (Ab2), which binds to a different epitope of the analyte protein than the capture antibody, is added. Labels include enzymes, dissolvable nanoparticles, and nanoparticles or magnetic beads bearing multiple labels to enhance sensitivity.10,17,18 The classic ELISA approach uses enzyme labels and optical detection of a colored enzyme reaction product. In more recent immunoassays, electrochemical detection methods have included amperometry, voltammetry, electrochemical impedance and other techniques. These methods can detect enzyme reaction products, activated enzymes, the enzymes themselves, electroactive labels, or metal ions released from nanoparticles.
Electrochemical immunoassays were pioneered by Heineman, Halsall and co-workers at the Univ. of Cincinnati beginning in the 1980s.19 They designed sandwich immunoassays using alkaline phosphatase enzyme labels that convert substrates to electroactive products transported by fluidics to an electrode.20,21 Recently, they have employed microfluidic devices22 and interdigitated electrodes to achieve high sensitivity.23
Multiplexing is readily achieved with electrochemical immunoarrays. In early examples, iridium oxide sensor arrays and alkaline phosphatase-labeled Ab2 were used for simultaneous amperometric detection of goat IgG, mouse IgG, carcinoembryonic antigen (CEA) and α-fetoprotein (AFP) with DLs ∼1 ng mL−1.24 Eight-sensors arrays in wells of a 12-well plate were used to simultaneously measure as many as seven biomarkers25,26 with DLs of 2 to 3 ng mL−1.
Protein biomarkers for future cancer diagnostics will need to be measured in serum, saliva, urine, or blood with DLs below normal concentrations in cancer-free patients (often less than pg mL−1) and sensitivity extending to expected elevated levels up to hundreds of ng mL−1 in cancer patients. Nanoparticles attached to detection antibodies (Ab2) have been used to enhance sensitivity. Examples include nanoparticles that can be dissolved to yield electroactive ions, and Ab2–nanoparticles bearing multiple enzyme labels or multiple redox probes (Fig. 2).4,5,12,13,27–31 These approaches achieve high sensitivity by providing a large number of signal-generating species for each analyte captured by the sensor.
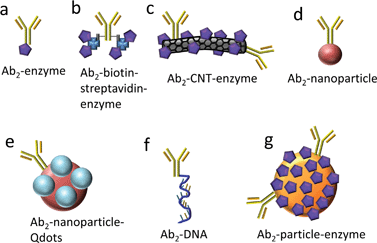 | ||
| Fig. 2 Detection antibody (Ab2)-label conjugates used with electrochemical immunosensors for signal amplification. | ||
Dissolvable metal nanoparticles as labels for electrochemical immunoassays were first reported by Dequaire et al.32 Typically, analyte proteins are captured in microwells coated with primary antibodies, and then Ab2–nanoparticle bioconjugates are introduced into the microwells and they bind to captured analyte. After washing to remove unbound Ab2–nanoparticle bioconjugates, an acid solution is added to the microwells and metal ions released by dissolution of the nanoparticles are detected by anodic stripping voltammetry (ASV) or potentiometric stripping.
Magnetic beads can be used in place of the microwell platform to achieve analyte capture and isolation. Sensitivity can be enhanced when using Au nanoparticles by coupling the detection with Au-catalyzed Ag precipitation.27,33,34 Similarly, magnetic beads can be decorated with CdS quantum dots (Qdots), collected magnetically, and dissolved for stripping analysis detection of Cd.27 Alternatively, Ab2–nanoparticles or Ab2–polymer beads can be loaded with electroactive labels such as ferrocene, and the labels released for subsequent electrochemical detection.27,28,31 Multiplexed protein detection can be achieved by designing bar coded labels on detection antibodies featuring distinct nanoparticles that yield a series of dissolved metal ions with different redox potentials.27,35 Multiple-metal striped rods, spheres or alloy rods have also been used as bar code labels for multiplexing.
Enzymes such as horseradish peroxidase (HRP) and alkaline phosphatase (ALP) are widely used for ELISA, and have also been used in electrochemical immunosensors. Nanoparticles with multiple copies of enzyme labels were first reported by Wang et al. for ultrasensitive electrochemical detection of proteins and DNA.36 Thousands of copies of ALP and detection antibodies (or probe DNA) were attached to single-wall carbon nanotubes (SWCNT), and used to achieve fM detection of IgG in buffer. Analyte was captured and isolated using antibody or probe DNA-labeled 1 μm magnetic beads, and the low detection limit was enabled by adsorption and preconcentration of ALP reaction product α-naphthol at multiwall CNTs used to modify the glassy carbon electrode surface. Alternatively, layer-by-layer (LbL) films of ALP and oppositely charged polyions were grown on SWCNTs to prepare the special bioconjugate CNT–(PDDA/ALP)4–PDDA–PSS–Ab2.37 Through use of these multilabel bioconjugate detection particles, a DL of ∼70 aM for IgG in buffer was achieved.
Greatly enhanced sensitivity can result when heavily labeled detection particles38,39 replace conventional singly-labeled Ab2's in immunoassays. Our research team has exploited multiple copy enzyme-nanoparticles and magnetic beads in immunosensors for a series of prostate and oral cancer biomarkers.4,5,7,10,40–43 Conventional detection antibodies (Ab2) conjugated with HRP (Fig. 2a) were used, as well as carbon nanotubes (CNT) or magnetic beads conjugated with Ab2 and up to a half million HRPs (Fig. 2c and g). With magnetic beads, labeling, antibody attachment, and purification of the bead bioconjugates is facilitated by magnetic separations. In addition, positions of the resulting bioconjugate beads can be magnetically controlled in microfluidic and other biosensor systems. Finally, detection particles equipped with high numbers of detection antibodies facilitate very efficient capture of analyte proteins in off-line or on-line microfluidic protocols, as we discuss later in this article.
2.2. Nanostructured sensor surfaces
Nanostructured sensor surfaces can be combined with multilabel detection to result in even greater improvements in sensitivity. The large nanostructured surface areas enable attachment of large populations of capture antibodies,10,44 and convoluted surface structures of these sensors may also provide better access of protein analytes to the antibodies.9 Strategies for making nanostructured immunosensors include decorating surfaces with films of carbon nanotubes,4,5,10 or gold nanoparticles,2,7 or controlled electrodepositing of noble metals to obtain porous nanostructured surfaces.8,9Numerous types of carbon nanotube (CNT) sensors have been used for detection of proteins.45 CNTs are commonly functionalized by acid-catalyzed oxidations to shorten their lengths and add terminal carboxylate groups, although some oxidation can occur on the sidewalls as well.46 Antibodies can be attached on the functionalized ends by standard amide coupling using 1-(3-(dimethylamino)propyl)-3-ethylcarbodiimide hydrochloride (EDC) and N-hydroxysulfosuccinimide (NHSS).4,5 While such covalent modification strategies of CNTs can result in partial destruction and possibly some loss of favorable electronic properties, non-covalent functionalization of CNTs such as wrapping with polymers or DNA can help preserve the structural integrity and desired properties of CNTs.46,47,48
We have employed sensors and sensor elements featuring densely packed films of oxidatively shortened, upright single wall carbon nanotube (SWCNT) films called SWCNT forests.4,5,41,49 These highly conductive films with large surface areas feature many carboxylate groups to which large amounts of capture antibodies can be coupled by EDC amidization.44 To form the films, end-carboxylated, aged SWCNTs of average length 30 nm are self-assembled from DMF solutions onto thin iron oxide–Nafion underlayers that can be formed on virtually any nominally flat surface. An AFM image of the SWCNT sensors illustrates the large surface areas obtained by immobilizing a population of nanotubes with a relatively broad length distribution (Fig. 3a). These SWCNT forests can achieve up to 17-fold larger surface concentrations of attached antibodies compared to flat carbon surfaces,44 and typically provide a 3 to 10-fold signal enhancement in electrochemical immunoassays.41,49 Attachment of antibodies to the ends of the nanotubes in the forest leads to a “rolling hill” type AFM image (Fig. 3b). Single sensors featuring SWCNT forests on conductive pyrolytic graphite substrates and utilizing multiple HRP–Ab2-labeled CNTs for detection were first validated for the sensitive detection of prostate specific antigen (PSA) in human serum and lysates of cancer cells that had been microdissected from prostate tumors.41
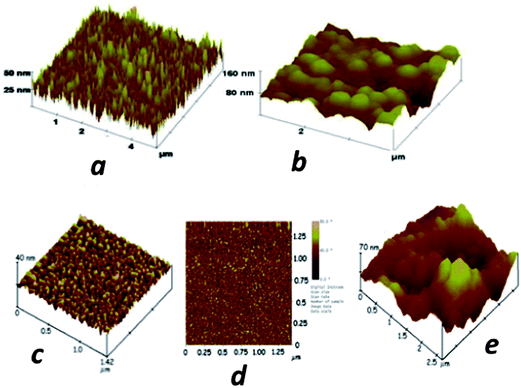 | ||
| Fig. 3 Atomic force microscope images of immunosensor platforms: (a) high surface area SWCNT forest on silicon; (b) SWCNT forest with antibodies chemically attached to their ends; (c) a PDDA/gold nanoparticle (AuNP, 5 nm) bilayer on smooth mica; (d) phase contrast image of the same PDDA/AuNP bilayer; (e) anti-PSA antibodies attached onto carboxylate groups of the AuNP/PDDA bilayer. Reproduced with permission from ref. 49 copyright Royal Society of Chemistry, 2005, and ref. 7 copyright American Chemical Society 2009. | ||
A rudimentary SWCNT forest array consisting of 4 bundled electrodes was used to simultaneously detect four prostate cancer biomarkers: PSA, interleukin-6 (IL-6), platelet factor-4 (PF-4), and prostate specific membrane antigen (PSMA) in the serum of prostate cancer patients and cancer-free controls.50 HRP was employed as a label on detection antibodies in sandwich immunoassays using this array. Biotinylated Ab2's that bind strongly and specifically to streptavidin–HRP conjugates provided 14–16 labels per antibody and gave the higher sensitivity necessary for PF-4 and IL-6. Singly labeled Ab2–HRP conjugates were suitable to detect PSA and PSMA, which are present at higher levels in serum. Calibration curves for this immunosensor array demonstrate good sensitivity in clinically relevant ranges of pg to ng per mL of serum, with detection limits of 0.03 pg mL−1 IL-6, 1 pg mL−1 for PSA and PF-4, and 10 pg mL−1 for PSMA (Fig. 4). Accuracy was confirmed by excellent correlation of array results on patient samples with individual ELISAs on the same samples, giving slopes of linear correlation plots close to 1.0 and intercepts near zero for all four proteins.
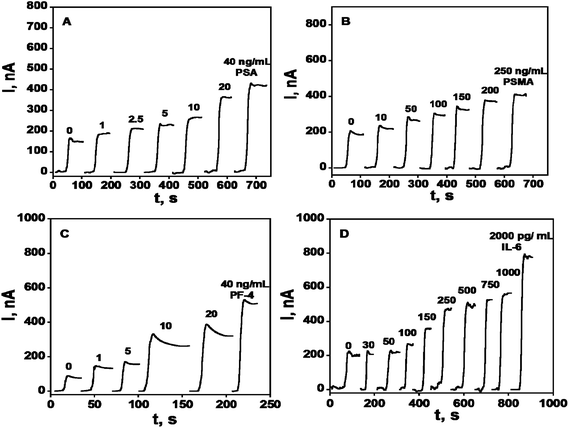 | ||
| Fig. 4 Amperometry in stirred solutions at −0.3 V and 2500 rpm after placing arrays in buffer containing 1 mM hydroquinone and then injecting H2O2 to 0.4 mM for 4-electrode SWCNT immunoarrays incubated with antigen standards in 10 μL undiluted calf serum for 1.25 h followed by Ab2–HRP (A & B) or Ab2–streptavidin–HRP (C & D) in 10 μL 0.4% w/v casein and 0.05% Tween 20 PBS buffer: (A) PSA, (B) PSMA, (C) PF-4, and (D) IL-6. Reproduced with permission from ref. 50 copyright American Chemical Society 2009. | ||
A critical materials-related factor in developing sensitive immunoassays is minimization of non-specific binding (NSB). Binding of macromolecules in the sample that may interfere with the assay, and binding of labeled-Ab2 on non-antigen sites on the sensor needs to be inhibited. Solving this problem involves creating a surface on the sensor that inhibits any binding other than that of the protein antigen with its antibodies. NSB in label-free methods such as impedance is more complex to inhibit, since any biomolecule that binds to the sensor can contribute to the signal. In labeled methods, labeled-Ab2 will give a signal even if it is bound to sites other than the analyte protein–capture antibody complex. Signals arising from NSB will not be differentiated from those originating from antigen–antibody binding, and will not be proportional to concentration of the antigen. NSB increases detection limits (DL) and degrades sensitivity, and generally can be minimized by washing with blocking solutions of bovine serum albumin or casein and nonionic detergents such as Tween-20. Tailoring the sensor surface with appropriate protein-resistant chemistry is also useful, with one of the most effective surfaces featuring polyethylene glycol (PEG) moieties.12,13,28 However, it has been our experience that even with protein resistant surfaces, additional protein or detergent blocking agents may be required for the best detection limits.
More recently, we utilized densely packed films of 5 nm diameter gold nanoparticles (AuNP) as platforms for ultrasensitive electrochemical immunosensors to detect cancer biomarkers in serum.7 These AuNPs are protected by a monolayer of glutathione molecules (Scheme 1) that provide carboxylates facing outward from the sensor surface that were used for attachment of antibodies by amidization. Films are made by the LbL method by first depositing a 0.3–0.5 nm underlayer of cationic PDDA, washing, and then depositing the AuNPs.7 The AFM images of these films are consistent with nearly full coverage (Fig. 3c and d). Attaching antibodies to these films by EDC/NHSS amidization gives AFM images with the familiar rolling hill scenario (Fig. 3e). A single bilayer with one AuNP layer performed as well as a 2-bilayer sensor having 2 AuNP layers.7 Sensitivity of this immunosensor was further amplified by using 1 μm magnetic bead bioconjugates with 7500 HRP labels and multiple Ab2's attached. The advantage of the magnetic beads is ease of magnetic manipulation and separation in the bioconjugation and sample handling steps.39 These sensors provided high sensitivity and detection limit (DL) of 0.5 pg mL−1 for PSA in 10 μL of serum, eight fold better than our previously described SWCNT forest immunosensor featuring multiple labels on carbon nanotubes, and well below the normal serum levels of PSA. We have used these easily fabricated AuNP films extensively in microfluidic arrays, and provide examples in later sections of this article.
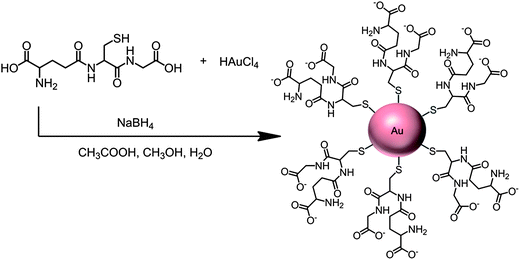 | ||
| Scheme 1 Synthesis of 5 nm gold nanoparticles protected by glutathiones with outer carboxylate groups for eventual linkage of antibodies. | ||
3. Microfluidic arrays for multiple protein detection
3.1. Modular microfluidic system
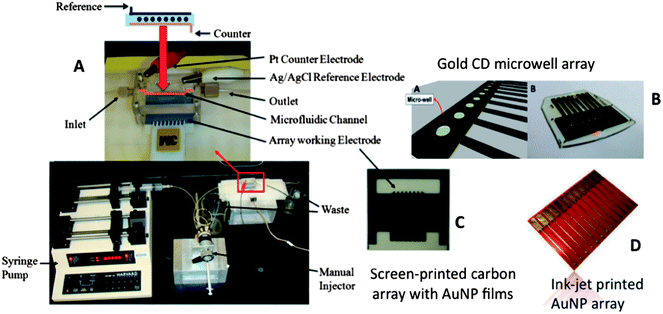
Our current strategies for ultrasensitive multiplexed immunoassay systems combine nanostructured sensor electrodes and massively multi-labeled detection particles into simple modular microfluidic devices. Microfluidics saves on costs by limiting reagent amounts required, improves assay times, provides precise mass transport for amperometric detection, and introduces a degree of automation. Our first microfluidic immunoassay system for multiplexed detection of cancer biomarker proteins was fabricated using a 63 μL molded soft polydimethylsiloxane (PDMS) detection channel sandwiched between 2 machined hard PMMA plates, connected by PEEK tubing to a pump and sample injector (Fig. 5A).51 The PDMS channel is formed on a machined mold, so that lithography is avoided.The amperometric detection chamber features a plastic array chip of 8 screen-printed carbon electrode sensors (Fig. 5C) inserted into the PDMS detection channel. Each sensor is coated with a layer of glutathione–AuNPs on a PDDA underlayer as described in the section above. Capture antibodies (Ab1) were attached to carboxylate groups of glutathione on the AuNP-coated sensors using EDC/NHSS amidization. Treatment of the microfluidic channel with solutions of bovine serum albumin and Tween-20 detergent with the sensor arrays in place effectively blocks NSB of potentially interfering biomolecules in the serum sample.
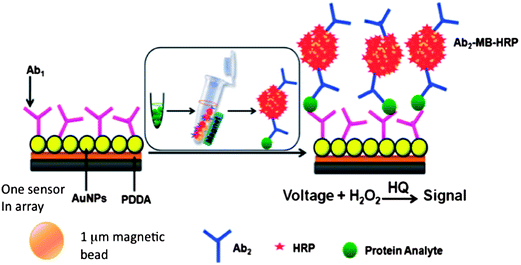
We initially captured protein analytes off-line in microcentrifuge tubes using 1 μm superparamagnetic particles (MP) to which we attached multiple copies of HRP labels and detection antibodies (Ab2) (Fig. 6).51 These beads were then washed, magnetically separated, reconstituted in buffer, and injected into the detection chamber via the sample injection loop. Flow is stopped when the HRP–MP–Ab2 beads fill the chamber, easily seen since the beads are red-brown, for an incubation period to allow the beads bearing analyte proteins to bind to the sensors. Flow was then resumed to flush out beads not bound to the sensors. Then, a mixture of hydrogen peroxide and hydroquinone is injected via the sample valve to simultaneously activate the HRP labels by peroxide and mediate reduction of the resulting ferryloxy HRP by hydroquinone. Under a fixed potential of −0.2 or −0.3 V vs. Ag/AgCl, this mediator–activator injection provides 8 amperometric peaks from the 8 sensors in the detection chamber. We tested this approach first to simultaneously detect cancer biomarker proteins PSA and IL-6 in serum at sub-pg mL−1 levels (Fig. 7A and B). Tosylated MPs were conjugated with ∼90![[thin space (1/6-em)]](https://www.rsc.org/images/entities/char_2009.gif) 000 antibodies and ∼200
000 antibodies and ∼200![[thin space (1/6-em)]](https://www.rsc.org/images/entities/char_2009.gif) 000 HRP labels to provide efficient off-line capture and high sensitivity. Detection limits of 0.23 pg mL−1 for PSA and 0.30 pg mL−1 for IL-6 were obtained in diluted serum in 1.15 h. Array immunoassays of PSA and IL-6 in serum of prostate cancer patients gave excellent correlations with standard ELISA (Fig. 7C and D). This combination of off-line protein capture on magnetic beads, microfluidic sample and reagent delivery, and nanostructured sensor surfaces provided detection limits that were lower by about half compared to single AuNP sensors using magnetic bead capture, and 5–100 fold lower than those of commercial bead-based multi-protein assays.10,51
000 HRP labels to provide efficient off-line capture and high sensitivity. Detection limits of 0.23 pg mL−1 for PSA and 0.30 pg mL−1 for IL-6 were obtained in diluted serum in 1.15 h. Array immunoassays of PSA and IL-6 in serum of prostate cancer patients gave excellent correlations with standard ELISA (Fig. 7C and D). This combination of off-line protein capture on magnetic beads, microfluidic sample and reagent delivery, and nanostructured sensor surfaces provided detection limits that were lower by about half compared to single AuNP sensors using magnetic bead capture, and 5–100 fold lower than those of commercial bead-based multi-protein assays.10,51
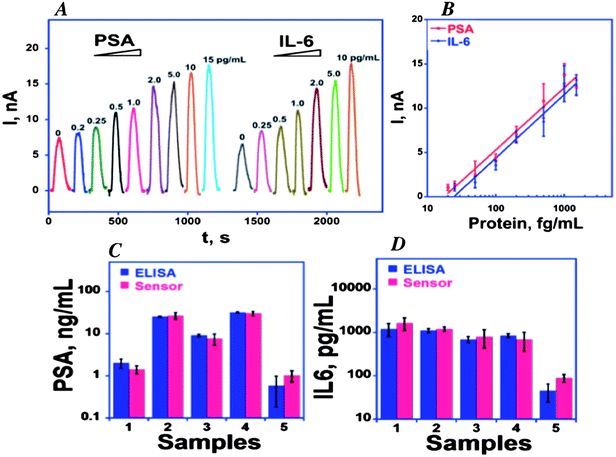 | ||
Fig. 7 Calibration of 8-sensor microfluidic immunoarray using off-line protein capture by multilabel HRP–MP–Ab2 particles with 200![[thin space (1/6-em)]](https://www.rsc.org/images/entities/char_2009.gif) 000 HRP labels per particle at −0.3 V vs. Ag/AgCl: (A) amperometric peaks for PSA and IL-6 mixtures in serum generated by injecting 1 mM hydroquinone + 100 μM H2O2; (B) calibration curves (C) simultaneous determinations by the array and individual ELISAs for PSA and IL-6 in patient serum: 1–4 are from prostate cancer patients; 5 is cancer-free control. Reproduced with permission from ref. 51 copyright Elsevier, 2011. 000 HRP labels per particle at −0.3 V vs. Ag/AgCl: (A) amperometric peaks for PSA and IL-6 mixtures in serum generated by injecting 1 mM hydroquinone + 100 μM H2O2; (B) calibration curves (C) simultaneous determinations by the array and individual ELISAs for PSA and IL-6 in patient serum: 1–4 are from prostate cancer patients; 5 is cancer-free control. Reproduced with permission from ref. 51 copyright Elsevier, 2011. | ||
We later adapted this ultrasensitive microfluidic array to measure a panel of four protein biomarkers, and validated the panel for clinical diagnostics of oral cancer.52 The immunoarray achieved high sensitivity in 50 min assays by using off-line protein capture by magnetic beads modified with 400![[thin space (1/6-em)]](https://www.rsc.org/images/entities/char_2009.gif) 000 HRP labels and 120
000 HRP labels and 120![[thin space (1/6-em)]](https://www.rsc.org/images/entities/char_2009.gif) 000 antibodies. The increase in number of labels and antibodies from the example above was obtained by using streptavidin-derivatized beads and biotin-labeled HRP and Ab2 for attachment. Ultralow detection limits of 5–50 fg mL−1 were obtained for simultaneous measurement of proteins IL-6, IL-8, VEGF and VEGF-C in diluted serum (Fig. 8). Good correlations were found with ELISA for determinations of these proteins in cancer cell media. Normalized means of the 4-protein levels in 78 oral cancer patient serum samples and 49 controls gave clinical sensitivity 89% and specificity 98% for oral cancer detection, demonstrating significantly better diagnostic performance than single protein data. We recently introduced an on-line protein capture module upstream of the detection chamber to replace the off-line capture step and further automate the assays.53
000 antibodies. The increase in number of labels and antibodies from the example above was obtained by using streptavidin-derivatized beads and biotin-labeled HRP and Ab2 for attachment. Ultralow detection limits of 5–50 fg mL−1 were obtained for simultaneous measurement of proteins IL-6, IL-8, VEGF and VEGF-C in diluted serum (Fig. 8). Good correlations were found with ELISA for determinations of these proteins in cancer cell media. Normalized means of the 4-protein levels in 78 oral cancer patient serum samples and 49 controls gave clinical sensitivity 89% and specificity 98% for oral cancer detection, demonstrating significantly better diagnostic performance than single protein data. We recently introduced an on-line protein capture module upstream of the detection chamber to replace the off-line capture step and further automate the assays.53
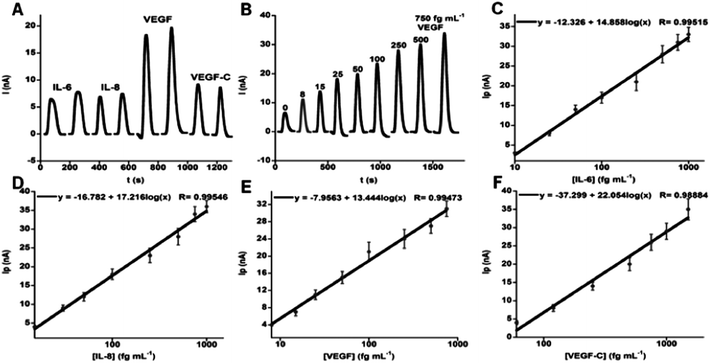 | ||
| Fig. 8 Oral cancer biomarker proteins detected in serum by an amperometric microfluidic array after incubating of Ab2–MB–HRP–analytes in measurement chamber, then injecting mixture of H2O2 and hydroquinone: (A) duplicate responses in simultaneous measurements of standard mixture 10 fg mL−1 IL-6, 15 fg mL−1 IL-8, 25 fg mL−1 VEGF, and 60 fg mL−1 VEGF-C illustrating reproducibility, (B) responses to VEGF in mixtures of biomarker proteins (peaks for VEGF extracted from four-protein determinations and presented together), (C–F) immunoarray calibrations of standard mixtures in calf serum for IL-6 (C), IL-8 (D), VEGF (E), VEGF-C (F), using background corrected peak currents. Standard deviations correspond to 2 sensors each on three separate arrays (n = 6). Reproduced with permission from ref. 52 copyright American Chemical Society 2012. | ||
3.2. High efficiency protein capture on antibody decorated magnetic beads
Clearly, large numbers of label copies on magnetic beads contribute strongly to amplified signals for each protein captured to enhance sensitivity. However, capture efficiency of the beads for the analyte proteins is also a key issue. It is often assumed that DLs for proteins in binding assays are limited by dissociation constants (KD) of antibody–protein complexes, which tend to be in the low nM range. This implies that when using single antibodies not attached to beads in the assay protocol, the DL cannot be very much below that of the KD. However, the use of magnetic beads massively labeled with HRP and antibodies (100![[thin space (1/6-em)]](https://www.rsc.org/images/entities/char_2009.gif) 000 or more) to capture analyte proteins leads to much lower DLs. For example, prostate and oral cancer biomarker proteins have been detected in dilute serum using our amperometric microfluidic device at DLs in the low fg mL−1 (aM) range.43,51
000 or more) to capture analyte proteins leads to much lower DLs. For example, prostate and oral cancer biomarker proteins have been detected in dilute serum using our amperometric microfluidic device at DLs in the low fg mL−1 (aM) range.43,51
High local concentrations of antibodies on the beads greatly favor the binding of protein analytes. Analogously, nanoparticles decorated with less than a thousand antibodies have greatly decreased dissociation constants (i.e., increased binding constants) onto protein-coated surfaces compared to single antibody counterparts.54–61 Affinity of binding to the particles is increased due to multiple co-operative interactions with immobilized proteins. In other words, the equilibrium:
| MP–Ab2–protein ⇌ MP–Ab2 + protein | (1) |
We explored binding kinetics of 1 μm diam. MPs coated with >100![[thin space (1/6-em)]](https://www.rsc.org/images/entities/char_2009.gif) 000 antibodies to proteins attached onto gold surface plasmon resonance (SPR) sensor surfaces.62 The MP–Ab2 showed highly irreversible binding with 100-fold increased association rates compared to free antibodies. Essentially, the MP–Ab2 bind to protein surfaces rapidly, but fail to dissociate in the time scale of hours when a solution of pure buffer is passed over the gold surface. Using PSA and IL-6 as model proteins, we estimated an upper limit of 5 fM for the dissociation constant of MP–Ab2 from the Au–protein surface, even though KD values were 3–8 nM for the free antibodies. SPR results combined with approximate geometric considerations suggested up to 2000 interactions of MP–Ab2 with the protein–Au surfaces. These results help to rationalize the highly efficient capture of proteins in solution by the MP–Ab2 that enables ultrasensitive protein detection into the fM and aM range.
000 antibodies to proteins attached onto gold surface plasmon resonance (SPR) sensor surfaces.62 The MP–Ab2 showed highly irreversible binding with 100-fold increased association rates compared to free antibodies. Essentially, the MP–Ab2 bind to protein surfaces rapidly, but fail to dissociate in the time scale of hours when a solution of pure buffer is passed over the gold surface. Using PSA and IL-6 as model proteins, we estimated an upper limit of 5 fM for the dissociation constant of MP–Ab2 from the Au–protein surface, even though KD values were 3–8 nM for the free antibodies. SPR results combined with approximate geometric considerations suggested up to 2000 interactions of MP–Ab2 with the protein–Au surfaces. These results help to rationalize the highly efficient capture of proteins in solution by the MP–Ab2 that enables ultrasensitive protein detection into the fM and aM range.
In the protein capture protocol, analyte proteins have many MP–Ab2 in their vicinity, leading to a massive concentration of antibodies as possible binding partners. In addition, when a protein bound to one of the Ab2's dissociates, it is initially in the vicinity of very large local antibody concentration on the bead to which it was previously bound. As a result, the protein experiences strong competitive binding to another antibody on that bead compared to a protein that is able to simply diffuse away from an isolated antibody. This is similar to MP–Ab2 on the protein-decorated Au SPR surfaces. Although MP–Ab2 may have numerous individual links to proteins on the surface, if a single MP–Ab2 attachment to a protein breaks, there will be a high probability of the bead binding to another protein on the Au surface.
Moderate aggregation of the MP–Ab2 was also observed by SEM on the gold SPR chip, and may be related to residual magnetic microdomains in the magnetic beads.62,63 Similar sized Ab2–silica particles did not aggregate. About a tenth of the MP–Ab2 were also present in aggregates in aqueous dispersions, and the degree of aggregation was independent of protein analyte concentration or antibody loading. This aggregation may also contribute to sensitivity in immunoassay devices using MP–Ab2.62
3.3. Sensor arrays
Before use, these gold arrays are treated by potential cycling between 1.5 and −0.2 V vs. saturated calomel electrode (SCE) in 0.18 M sulfuric acid to remove gold oxide. To provide surface carboxyl groups for antibody attachment, a self-assembled monolayer (SAM) of mercaptopropionic acid (MPA) was then formed on the AuNP films. Carboxyl groups were subsequently activated by EDC/NHSS to attach capture antibodies (Ab1).
These low-cost inkjet-printed AuNP sensor chips were inserted into the modular microfluidic immunoarray to detect IL-6 and IL-8 proteins in 5 μL of sample. As in the examples above, 1 μm magnetic beads heavily labeled with HRP and antibodies were used to capture the biomarker proteins from samples. In 45 min assays, DLs were 39 fg mL−1 for IL-6 and 19 fg mL−1 for IL-8. However, clinically relevant DLs of 5 pg mL−1 were obtained in 8 min assays by shortening incubations of the HRP–MP–Ab2 with the sample, and of the HRP–MP–Ab2–protein conjugates with the sensor array.65 Immunoassays of IL-6 and IL-8 in conditioned media from head and neck cancer and control cells were similar to those from standard single-protein ELISAs. While the printed AuNP chip is not central to the short time assays, it is much cheaper than the commercial screen-printed chips and avoids the AuNP film deposition step since the conductive material is the printed gold. Electrochemical surface area measurements of these arrays are necessary before use to express signals as current densities to account for small variations in sensor surface area.
We also made gold arrays by wet chemistry processing of gold compact discs (CD-Rs) featuring microwells around the sensor electrodes (Fig. 5B).66 These gold sensor arrays were also fabricated for $0.20 in materials by using computer-printed patterns and selective chemical etching. The gold CD-R was immersed in concentrated nitric acid for 1 min to remove the protective polymer layer, and then cut into desired shapes and sizes. The nitric acid treated CD-R was washed with water, dried under nitrogen, and used immediately for array fabrication. A mask was designed using Canvas 11 software, and printed onto very high gloss paper using a laserjet at 1200 dpi. The mask was then cut and placed face down onto a similar sized cut piece of acid-processed gold CD-R. The CD-R piece and toner mask were sandwiched in a thermal press at 120 °C for 110 s to transfer the laserjet toner to the CD surface. Before wet etching, the contact pad and working electrode were manually covered by inking with a Sharpie® permanent marker which provides an excellent resistance to protect the gold film from the gold etchant used next. The gold etchant solution containing 0.1 M potassium thiosulfate, 1 M potassium hydroxide, 0.01 M potassium ferricyanide, 0.001 M potassium ferrocyanide was used to remove unprotected gold. Gold not covered by the mask is oxidized by ferricyanide, then solubilized by thiosulfate. After etching, arrays were washed with ethanol and water, and dried under nitrogen. This process generated the basic gold array pattern. Next, a second layer of laserjet toner was heat transferred from glossy paper onto the arrays to create hydrophobic microwells around sensor elements capable of holding 1 μL droplets. This pattern defines the areas of the sensing elements and allows solutions to be deposited on one sensor without contaminating the others. In reality, the high contact angle exhibited by the toner layer enables 1 μL droplets to remain separate and distinct from one another for the inter-electrode distance of the design. The microwell around each electrode may be defined by the toner layer thickness. Thus, the microwell defined by the 850 μm diameter electrode at the bottom of the well and estimated 6–14 μm toner layer defining the sides is <10 nL (Fig. 9).
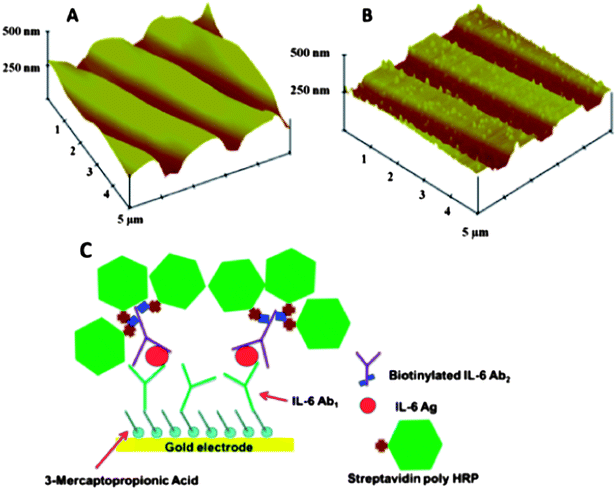 | ||
| Fig. 9 Sensor surfaces in arrays made from gold CDs: (A) tapping mode AFM images of exposed bare gold CD-R surface, which retain original ridges of the CD; (B) AFM of anti-IL-6 capture antibody covalently linked to the gold CD-R surface after treatment with mercaptopropionic acid; (C) detection of proteins bound on the array using streptavidin poly-HRP, which attaches to biotinylated anti-human IL-6 detection antibody bound to IL-6 on the sensor, then hydrogen peroxide and hydroquinone are injected to produce an amperometric peaks. Reproduced with permission from ref. 66 copyright Royal Society of Chemistry, 2011. | ||
The resulting gold sensor elements had electrochemically measured surface areas of 0.42 mm2 (±2%). These arrays were integrated into the modular microfluidic device and used to detect IL-6 in diluted serum by a sandwich immunoassay protocol. Here, for detection we used a biotinylated antibody with polymerized horseradish peroxidase (HRP) labels. The detection limit of IL-6 in diluted serum was 10 fg mL−1, demonstrating their utility.66 These easily fabricated, ultrasensitive, microfluidic immunoarrays are currently being expanded to feature larger numbers of sensors for more extensive multiplexing.
Surface reconstruction of smooth electrodes to provide nano-porosity can increase both surface area and electrocatalytic activity.73–77 Unlike flat surfaces, which are mostly dominated by thermodynamically stable lattice organization, the high surface area of nanostructured metals kinetically freezes unstable crystal facets that can exhibit pronounced electrocatalytic activity.77 Nanoporous gold (Au) has received significant attention, due to its higher natural abundance as compared to other noble metals.8,9,67,78 A variety of methodologies have been used to realize nano-structured Au with the more prominent techniques including (a) electrochemically-based etching and re-building;78 (b) alloying/dealloying of Au with an another metal, which ultimately gets dissolved away;79,80,81 and (c) Au templates within sacrificial matrices.72,82
Our recent studies on long-term stable electrodes, have shown that nanoporous Au, with which it is easy to attain high surface area, still lacks stability and the required electrocatalytic activity for high sensitivity applications.67,69 On the other hand, by decorating these nano-structured Au electrodes with other noble metals like Pt and Pd, electrocatalytic activity and stability can be improved significantly.67,73,83 Pt is well-known for excellent electrocatalytic activity towards both oxidation and reduction of H2O2 and other small molecular weight mediators.67,71,84 Thus, we have focused our efforts to decorate smooth and nanostructured Au electrodes with Pt nanoparticles.67,69,71 Nucleation and growth of Pt nanoparticles onto gold electrodes ensures intimate bonding and low surface resistance using only small amounts of Pt.73–76
Electrode poisoning is a critical issue for electrochemical measurements in biological media. Nanostructured-Au/Pt electrodes exhibit similar propensity to poisoning as flat Pt electrodes, albeit at a bit slower rate.67,69,71,73 This poisoning originates from physisorption of various organic molecules and biomolecules such as proteins, DNA and their fragments onto electrocatalytic Pt sites, which over time can cause significant decreases in sensor sensitivity.67,73 Consequently, this issue must be addressed before high-end applications that require continuous usage of these electrodes can be realized. Various methods have been devised in order to account for such electrode passivation. Cyclic voltammetry (CV) scans for cleaning together with continuous flow can possibly dislodge contaminants and refresh the Pt surface.67 Another approach is to protect the Pt surface with a conformal, semi-permeable membrane, which allows only low molecular weight substances (i.e. H2O2, O2, H2O, H3O+, etc.) to pass through, while polymeric contaminants are prevented from reaching the active surface.71,85 However, conformal, semi-permeable membranes on activated electrodes, while beneficial in reducing poisoning, may also be responsible for partial decreases in sensitivity compared to free, freshly activated Pt surfaces.71,85,86
Our approach to produce highly sensitive, reusable Pt-black on Au electrodes for microfluidic based immunoassay devices typically involves the following steps:67
(1) Au electrode patterning: Au electrodes are photolithographically patterned as thin films (ca. 100 nm) using sputtering or thermal evaporation, but their thickness must be increased in order to accommodate the electrochemical-based etching and rebuilding of porosity. This is typically done by electroplating Au from a gold-plating solution (i.e. 10 μA mm−2 current density for 1 h) to afford localized growth of an extra 5 μm.
(2) Nanostructured Au rebuilding: Nanoporous gold is obtained by applying a repetitive square waveform from +0.8 to −1.0 V vs. Ag/AgCl at frequency of 50 Hz in 2 M NaOH. Under these electrochemical conditions, Au is repeatedly etched by oxidation at +0.8 V and re-deposited onto the electrode's surface at −1.0 V. This occurs with the concurrent generation of micro-bubbles of oxygen at +0.8 and hydrogen at −1.0 V. These microbubbles act as template matrices for Au rebuilding onto the electrode surface to produce a “flowery-looking”, 3-dimensional (3D) micro/nano-structure (Fig. 10a).69,71,73 Our results indicate that the roughness and porosity of these structures can be optimized by controlling the etching time.71 For example, 15 min etching results in maximum porosity, while the smallest domains begin to fuse together at longer times, disrupting the nanoscale morphology. As shown in Fig. 10c, the nanoporous Au electrode gave 20 times higher H2O2 sensitivity vs. that of a bare planar Au electrode when tested at 0.6 V vs. Ag/AgCl.
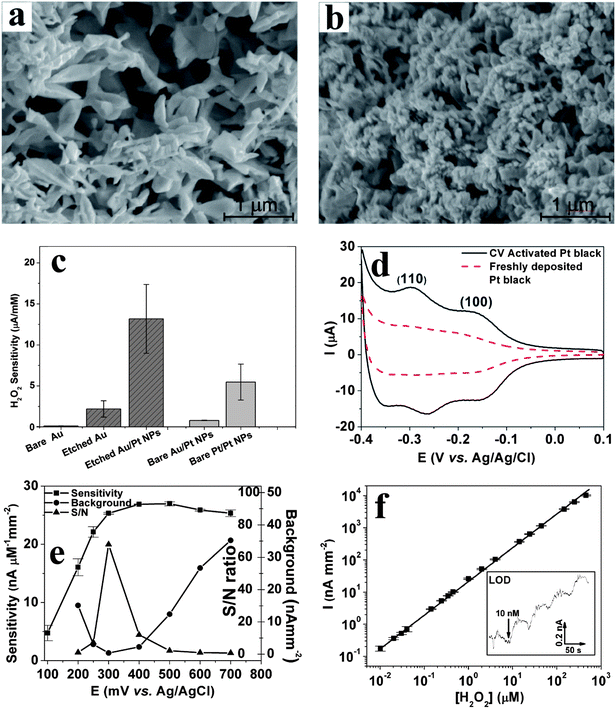 | ||
| Fig. 10 SEM images of electrochemically rebuilt Au nanostructures before (a) and after (b) decorating them with Pt nanoparticles. (c) H2O2 sensitivity (at +0.5 V vs. Ag/AgCl reference) for various working electrodes (see text for details). (d) Cyclic voltammograms of freshly deposited and CV-activated Pt-black electrodes in 0.5 M H2SO4 at 50 mV s−1 (e) H2O2 sensitivity vs. potential of activated nanostructured-Au/Pt electrodes along with background (in the absence of H2O2) and signal to noise (S/N) ratio. (f) Linear dynamic range (y = 46.7 + 23.1x, R2 = 0.995) for H2O2 detection at 0.3 V vs. Ag/AgCl reference in 50 μL min−1 PBS flow. Inset shows staircase amperometric curve for four additions of 10 nM H2O2 at the limit of detection (LOD). Reproduced with permission from ref. 67 and 71, copyright Elsevier, 2010 and 2011. | ||
(3) Pt-nanoparticle decoration: The decoration of Pt nanoparticles onto the porous gold electrodes is realized by applying −0.5 V for 60 s in 10 mM of H2PtCl6 solution. As seen from Fig. 10b, this results in the conformal coverage of micro/nano-structured Au with Pt nanoparticles, with minimal blockage of porosity. These nanostructured-Au/Pt electrodes exhibit 6-fold larger H2O2 sensitivity than the underlying nanostructured Au, and 120 fold higher sensitivity than bare planar Au (Fig. 10c). This sensitivity is 13.4 μA mM−1 for a 0.57 mm2 starting bare Au electrode or 2.26 mA mM−1 cm−2, which is one of the highest reported for larger sized electrodes.71 Controls with Pt nanoparticles grown on either bare Au or Pt surfaces (Fig. 10c) corroborate that 75% of the observed sensitivity enhancement originates from Au nanostructuring, and 25% results from the increased electrocatalytic activity of Pt-nanoparticles.
(4) Pt surface activation: In order to reach and maintain the above H2O2 sensitivity for the nanostructured-Au/Pt electrodes, its surface must be activated and kept free of poisoning. This is accomplished by applying 21 CV scans (from −0.5 to +0.9 V vs. Ag/AgCl, at a scan rate of 100 mV s−1) in flowing phosphate buffer saline (PBS).67 As shown in Fig. 10d, this CV treatment strengthens and exposes two reversible peaks associated with hydrogen adsorption and desorption on Pt (1 1 0) (−0.25 V) and Pt (1 0 0) (−0.15 V) planes.73 This suggests that the CV treatment must either cause preferential etching to expose these planes or desorb contaminants that might block the active sites. The process is also augmented by the flowing PBS solution, which assists in removing poisoning contaminants. If the flow is stopped, the contaminants build back rapidly.67 A number of additional benefits arise from such highly porous and electrocatalytically active electrode geometries:
(a) Decreases in redox potential: Typically, oxidation of H2O2 takes place ca. 0.5 to 0.6 V vs. Ag/AgCl.71,74,87,88 Activated nanostructured-Au/Pt electrodes oxidize H2O2 as low as +0.2 V vs. Ag/AgCl reference (Fig. 10e);
(b) Signal-to-noise (S/N) increase: At low voltages (ca. +0.2 V), reduction of O2 contributes to high background signals (Fig. 10e). Similarly, at high voltages (greater than 0.5 V) a number of redox active endogenous species and/or contaminants can increase the background. As shown in Fig. 10e, the minimum S/N ratio and maximum sensitivity (25.3 nA μM−1 mm2) is attained for H2O2 oxidation at +0.3 V vs. Ag/AgCl reference on the nanostructured-Au/Pt electrodes.
(c) Large dynamic range and low limit of detection (LOD): Fig. 10f illustrates that activated nanostructured-Au/Pt electrodes exhibit a linear response over five decades of H2O2 concentration and a very low LOD of 10 nM. For the slightly bulkier hydroquinone (HQ) mediator, four decades linear dynamic range and 100 nM LOD were observed.67
The superb performance of activated nanostructured-Au/Pt electrodes is quite stable and electrochemical activity is retained for more than one day. For long-term usage, daily CV-activation in flowing PBS should be employed to restore peak electrochemical activity. Our results show that such sensitivity can be maintained in excess of 30 days when daily CV-activation is utilized.67
(5) Microelectrodes & microelectrode arrays to further increase sensitivity: Due to their small size, microelectrodes possesses many advantageous properties compared to macro-sized electrodes including 3D mass-transport of electroactive species to the working electrode as opposed to linear mass transport at larger electrodes, low background charging current and small ohmic drop.69,71,89–91 These three factors lead to significant enhancement in signal-to-noise ratio. In addition, by arraying microelectrodes used with a single electrical contact a further increase in sensitivity can be realized since the recorded current is additive, assuming the diffusion profile of each microelectrode in the array does not overlap with its neighbor electrodes.88,89 Nanostructure rebuilding and surface activation of these microelectrodes can provide an even greater boost in sensor sensitivity. Our studies showed that the sensitivity of activated nanostructured-Au/Pt microelectrodes 25 μm in diameter increases by an additional order of magnitude (33 mA mM−1 cm−2) compared to larger sized electrodes as discussed above. This is one of the highest sensitivities reported for H2O2 detection at +0.4 V vs. Ag/AgCl.67
Last but not least, adhesion and long-term stability of glass-supported electrodes within microfluidic devices requires careful consideration.90 Patterned Au electrodes typically require the introduction of a thin Cr or Ti underlayer to increase adhesion between Au and glass (Fig. 11b). As shown in Fig. 11c, pinholes and patterned edges allow infusion of water and other corrosive reagents to dissolve the Cr or Ti and cause Au delamination (Fig. 11f).90 To prevent this, we have: (i) increased thickness of Au from 100 nm to 5 μm using electroplating in order to close all the pinholes; and (ii) protected the patterned edges with a 2 μm photoresist layer in order to seal and protect the weak Au–glass interface against water seepage. Such electrodes are then ready to receive an electrodeposited Pt-black overlayer (Fig. 11d & g) or be subjected to electrochemical Au rebuilding and Pt nanodecoration to realize higher surface areas and activities. Use of CV cycling protects such electrode geometries against delamination for periods greater than 1 month.67 We are currently evaluating such electrodes for protein detection in systems where the enzyme reaction is upstream of the detection.
 | ||
| Fig. 11 Schematic layout of (a) patterned electrodes together with PDMS microfluidic channel. (b) Microlithographically defined Cr/Au electrode without the side-edge protection and thick gold before and (c) after application of positive bias on electrodes that dissolves the underlying Cr adhesion layer causing the formation of pinholes and edge delamination. (d) Cross-section design of Pt black electrodes, that are resistant to delamination as a result of side-edge protection via a photoresist insulator, and the removal of pinholes by the growth of a thick (5 μm) electroplated gold layer. Optical images of electrodes described in (b) (viewed from the back side) showing the gray layer of Cr before (e) and after (f) 21 cycles of CV from −0.5 to 0.8 V vs. Ag/AgCl, which causes partial Cr dissolution and exposes the gold over layer at the edges and pinholes. (g) SEM image of the top surface of CV-activated Pt-black electrode. Reproduced with permission from ref. 67 copyright Elsevier, 2010. | ||
Small molecules, ions103–108 or enzymes109–111 can be used as co-reactants. Electron donor and acceptor energies of in such processes must be appropriate so that the ECL redox reaction forms the emitting metal complex in an electronically excited state e.g. as [Ru(bpy)32+]* in a singlet excited state. Tripropylamine (TPrA), oxalate,95 and even guanines in DNA112 can serve as ECL co-reactants for Ru(bpy)32+. Quantum dots can also be made in forms that emit ECL. For example, CdSe–CdS nanoparticles immobilized on an electrode were reduced to CdSe–CdS−˙, then the reduced form of S2O82− (SO4−˙) converts CdSe–CdS−˙ to excited state CdSe–CdS* that generates ECL.107
The Ru(bpy)32+/TPrA ECL system provides high sensitivity for bioanalytical applications.12,13,92,95 ECL emission results from complex redox pathways91,92,95 that provide the excited state [Ru(bpy)32+]*. A pathway well-suited to detecting proteins in immunoassays is initiated by oxidation of TPrA at 0.9 V vs. SCE. TprA oxidation products react in a multi-step pathway with Ru(bpy)32+ to yield [Ru(bpy)32+]*. Our first ECL immunosensor was developed on a SWCNT forest underlayer to detect PSA in serum using 100 nm diam. Ru(bpy)32+–silica nanoparticles attached to detection antibodies (RuBPY–silica–Ab2).113 These nanoparticles are synthesized with Ru(bpy)32+ in the reaction medium to trap thousands of ECL-active ions. The SWCNT forests enable the use of 0.9 V applied potential to oxidize TprA, whereas glutathione–AuNP films used for amperometric sensors did not survive this potential due to oxidation of the film itself. Addition of Triton X-100 and Tween 20 to the solution makes the sensor surface hydrophobic via an adsorbed surfactant layer, and improves the sensitivity of the assay. The hydrophobic layer inhibits deprotonation of the key TPrA cationic radical formed by oxidation of TprA and thus increases ECL. The resulting sensor provided a DL of 40 pg mL−1 for PSA in serum, providing good sensitivity in the clinically important range.
The principles above were employed to fabricate an ECL immunoarray constructed on a 1 × 1 in. pyrolytic graphite (PG) chip (Fig. 12A).114 To avoid cross contamination during array fabrication and antibody attachment, microwells capable of holding 10 μL aqueous droplets were painted onto the chip using commercial poly(butadiene)-based PAP pens. SWCNT forests were self-assembled in the well bottoms. AFM reveals images of SWCNT forests and the adjacent poly(butadiene) walls of the well (Fig. 12C). Antibodies attached to the SWCNTs in the wells captured analyte proteins from 5 μL of sample. Subsequently, RuBPY–silica–Ab2 particles with antibodies to both PSA and IL-6 bind to IL-6 and PSA captured on the arrays. After washing to block NSB, a TPrA–detergent solution is added, and oxidation of TPrA begins the catalytic redox process leading to emission of ECL from [Ru(bpy)32+]* in the silica nanoparticles. The emitted light is measured with a sensitive CCD camera after placing the array chip in an open top electrochemical cell in a dark box (Fig. 12B).
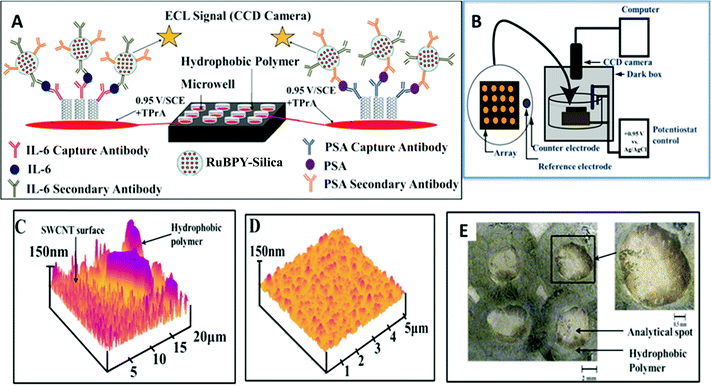 | ||
| Fig. 12 Features of ECL microwell immunoarray: (A) 10 μL wells containing SWCNT forests in red on a 1 × 1 in. pyrolytic graphite chip (black). SWCNT forests with primary antibodies are attached to well bottoms. Wells are filled with sample solutions and incubated to capture analyte proteins. After washing, 100 nm RuBPY–silica–nanoparticles–Ab2 are added and bind to the captured protein analytes. (B) The chip is placed in an open top electrochemical cell, 0.95 V vs. SCE is applied, and ECL is measured with a CCD camera. (C) AFM image showing the microwell polymer wall with adjacent SWCNT forest; (D) SWCNT forest in a microwell bottom after covalent attachment of anti-PSA antibody; (E) optical micrograph of 4 spots on an array showing the light green hydrophobic polymer wall forming the microwells. Inset shows single well at higher magnification. Reproduced with permission from ref. 113, copyright American Chemical Society 2011. | ||
Results for simultaneous detection of IL-6 and PSA in serum using 12-spot chips are illustrated in Fig. 13. Calibration graphs are curved but nevertheless appropriate for determinations at clinical serum levels of the proteins. DLs were 1 pg mL−1 for PSA and 0.25 pg mL−1 for IL-6 in serum.113 These are a significantly larger than those obtained by the microfluidic amperometry immunoarrays described above (see Fig. 5, 7, and 8), but still clinically relevant for serum analyses. Accuracy was confirmed by good correlations of ECL measurements to standard ELISA determinations of IL-6 and PSA in serum of prostate cancer patients. The advantages of ECL detection over the amperometric approach are that no special microelectronic chip or multi-potentiostat is needed, a simple power source can provide the voltage necessary to generate ECL, and a camera and a laptop computer comprise the detection hardware.
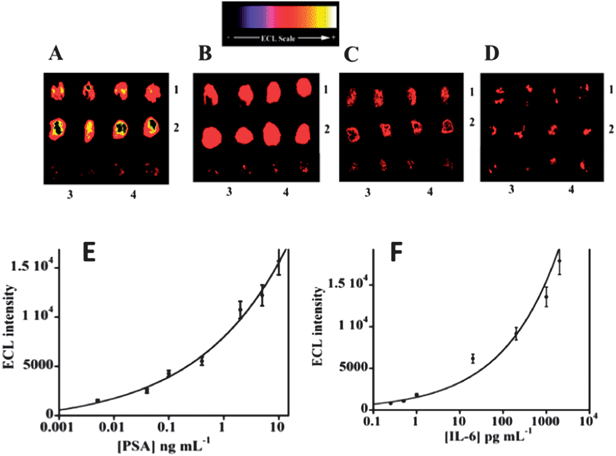 | ||
| Fig. 13 ECL results for microwell immunoarray responses to PSA and IL-6 in serum mixtures at 0.95 V vs. Ag/AgCl using 0.05% Tween 20 + 0.05% Triton-X 100 + 100 mM TprA at pH 7.5. RuBPY–silica nanoparticles (100 nm) used for detection had antibodies attached for both proteins: (A) (1) 5 ng mL−1 PSA, (2) 1 ng mL−1 IL-6, (B) (1) 0.4 ng mL−1 PSA, (2) 0.2 ng mL−1 IL-6, (C) (1) 40 pg mL−1 PSA, (2) 20 pg mL−1 IL-6, and (D) (1) 1 pg mL−1 PSA, (2) 0.25 pg mL−1 IL-6. In all images, controls are duplicate spots in the bottom row: (3) 0 pg mL−1 IL-6, and (4) 0 pg mL−1 PSA. Calibration curves using standards in calf serum are shown for (E) PSA, and (F) IL-6. Reproduced with permission from ref. 113, copyright American Chemical Society 2011. | ||
We then incorporated an ECL immunoarray into a microfluidic device to achieve more sensitive protein detection.115 Modular microfluidics similar to that in Fig. 5 was used, but a detection chamber was constructed to feature three PDMS channels on a conductive 2.5 × 2.5 cm PG chip (Fig. 14). The PDMS channel template was sealed into a machined PMMA chamber and interfaced with a syringe pump, switching valve and sample injector. In the assembled detection chamber, each of the three channels encompasses three microwells. Again, capture-antibodies were attached to SWCNT forests in well bottoms to capture protein antigens. Then, RuBPY–silica–Ab2 nanoparticle labels are injected and bind to analyte proteins on the array, followed by injection of TPrA to produce ECL. For detection, the chip is placed into the open-top ECL measuring cell, with the channel electrolyte in contact with electrolyte in the measuring cell. As in the manual array, potential applied at 0.95 V vs. SCE generates ECL light that is measured by the CCD camera. Compared to our manually operated ECL immunoassays, this approach achieved 10–25 fold lower DLs of 100 fg mL−1 for PSA (9 zeptomol) and 10 fg mL−1 (1 zeptomol) for IL-6 in calf serum (Fig. 15), partly because a 4-fold increase in RuBPY was achieved in the detection nanoparticles. Determinations of PSA and IL-6 in synthetic cancer patient serum correlated well with single-protein ELISAs.
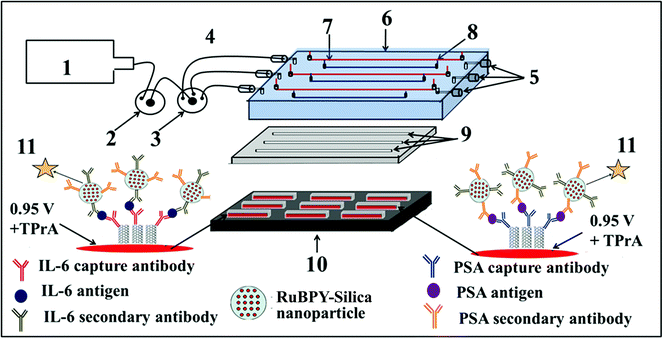 | ||
| Fig. 14 Design of microfluidic ECL array for proteins: (1) syringe pump (2) injector valve, (3) switch valve to guide the sample to the desired channel, (4) tubing for inlet, (5) outlet, (6) poly(methylmethacrylate) (PMMA) plate, (7) Pt counter wire, (8) Ag/AgCl reference wire (wires are on the underside of PMMA plate), (9) polydimethylsiloxane (PDMS) channels, (10) pyrolytic graphite chip (PG) (2.5 cm × 2.5 cm) (black), surrounded by hydrophobic polymer (white) to make microwells. Bottoms of microwells (red rectangles) contain primary antibody-decorated SWCNT forests, (11) ECL label containing RuBPY–silica nanoparticles with cognate secondary antibodies are injected to the capture protein analytes previously bound to cognate primary antibodies. ECL is detected with a CCD camera. Reproduced with permission from ref. 114, copyright Springer-Verlag, 2013. | ||
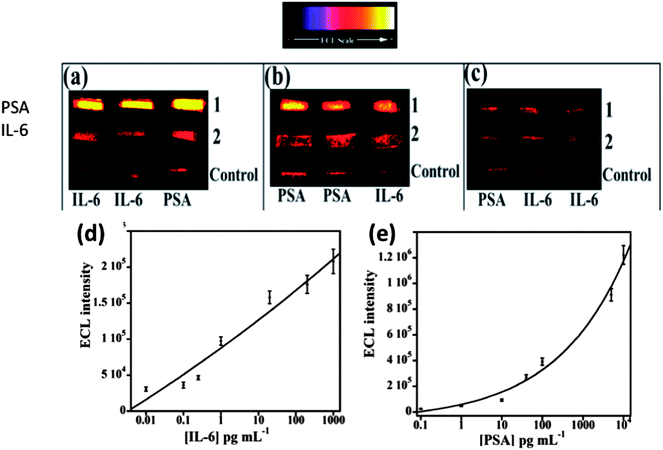 | ||
| Fig. 15 ECL results at 0.95 V vs. Ag/AgCl using 0.05% Tween 20 + 0.05% Triton-X 100 + 100 mM TPrA at pH 7.5 for microfluidic immunoarrays showing detection of PSA and IL-6 mixtures in serum; (a) lanes: (1) 5 ng mL−1 PSA and (2) 20 pg mL−1 IL-6, (b) lanes: (1) 100 pg mL−1 PSA and (2) 200 pg mL−1 IL-6, and (c) lanes: (1) 100 fg mL−1 PSA and (2) 10 fg mL−1 IL-6. Bottom lanes in all images are controls 0 pg mL−1 IL-6 and 0 pg mL−1 PSA. Calibration curves for (d) IL-6 and (e) PSA. ECL intensity plotted after subtracting relative ECL for protein-free controls. Error bars show standard deviations (n = 3). Reproduced with permission from ref. 114, copyright Springer-Verlag, 2013. | ||
4. Future directions
Much of the progress in electrochemical devices for multiple protein detection as described above has resulted from the marriage between nanomaterials and electroanalytical chemistry. In particular, our research has taught us that the combination of nanostructured sensor surfaces, massive multilabel detection strategies, and microfluidics can lead to unprecedented low detection limits and high sensitivities for multiple proteins in a single assay. Microfluidic arrays incorporating these features are now being used in our research to develop and validate biomarker protein panels for prostate, bladder, and oral cancer diagnostics. However, their care and use needs a significant level of technical expertise. These approaches need to be further simplified for widespread clinical and point-of-care diagnostics to put them squarely on the road to the clinic.How do we get on this road to arrive at the clinic? Sample preparation is still a key issue. Although we can process serum semi-automatically in our on-line protein capture device,53 it would be better to assay droplets of blood directly. This feature has been incorporated into a device for detection of antibodies against HIV and syphilis in blood.116 Automated reagent addition is also a desired advance, and has been accomplished in that same device but currently requires manual or robotic loading of a cassette. Clearly, the future holds significant engineering challenges for movement of multi-protein detection devices into POC use.15 In addition, simplified low-tech devices can be envisioned for specific medical applications in low resource environments. Advanced materials and materials processing have contributed greatly to our progress in multi-protein detection devices thus far. We hope that new materials or approaches will aid future progress in this important biomedical endeavor.
Acknowledgements
Preparation of this article was supported by Grant no. EB014586 from the National Institute of Biomedical Imaging and Bioengineering (NIBIB), NIH. The authors thank their co-authors in cited joint publications for their excellent contributions to our collaborative protein detection efforts.References
-
J. T. Stock and M. V. Orna, Electrochemistry, Past and Present, ACS Symposium Series 390, American Chemical Society, Washington, DC, 1989 Search PubMed
.
-
R. N. Adams, Electrochemistry at Solid Electrodes, Marcel Dekker, New York, 1969 Search PubMed
.
- M. Opallo and R. Bilewicz, Adv. Phys. Chem., 2011, 2011, 947637 CrossRef
.
- S.-N. Kim, J. F. Rusling and F. Papadimitrakopolous, Adv. Mater., 2007, 19, 3214–3228 CrossRef CAS PubMed
.
-
J. F. Rusling, X. Yu, B. S. Munge, S. N. Kim and F. Papadimitrakopoulos, in Engineering the Bioelectronic Interface, ed. J. Davis, Royal Soc. Chem., UK, 2009, pp. 94–118 Search PubMed
.
- G. Jo, M. Choe, S. Lee, W. Park, Y. H. Kahng and T. Lee, Nanotechnology, 2012, 23, 112001 CrossRef PubMed
.
- V. Mani, B. V. Chikkaveeraiah, V. Patel, J. S. Gutkind and J. F. Rusling, ACS Nano, 2009, 3, 585–594 CrossRef CAS PubMed
.
- L. Soleymani, Z. Fang, E. H. Sargent and S. O. Kelley, Nat. Nanotechnol., 2009, 4, 844–848 CrossRef CAS PubMed
.
- J. Das and S. O. Kelley, Anal. Chem., 2011, 83, 1167–1172 CrossRef CAS PubMed
.
- J. F. Rusling, C. V. Kumar, J. S. Gutkind and V. Patel, Analyst, 2010, 135, 2496–2511 RSC
.
- J. Wang, Biosens. Bioelectron., 2006, 21, 1887–1892 CrossRef CAS PubMed
.
- J. F. Rusling, Chem. Rec., 2012, 12, 164–176 CrossRef CAS PubMed
.
-
J. F. Rusling, B. Munge, N. P. Sardesai, R. Malhotra and B. V. Chikkaveeraiah, in Nanobioelectrochemistry, ed. F. Crespilho, Springer, Berlin-Heidelberg, 2013, pp. 1–26 Search PubMed
.
- P. D. Wagner, M. Verma and S. Srivastava, Ann. N. Y. Acad. Sci., 2004, 1022, 9–16 CrossRef CAS PubMed
.
- J. F. Rusling, Anal. Chem., 2013, 85, 5304–5310 CrossRef CAS PubMed
.
- Y.-E. Choi, J.-W. Kwak and J. W. Park, Sensors, 2010, 10, 428–455 CrossRef CAS PubMed
.
- S. F. Kingsmore, Nat. Rev. Drug Discovery, 2006, 5, 310–320 CrossRef CAS PubMed
.
- A. Rasooly and J. Jacobson, Biosens. Bioelectron., 2006, 21, 1851–1858 CrossRef CAS PubMed
.
- W. R. Heineman and H. B. Halsall, Anal. Chem., 1985, 75, 1321A–1331A CrossRef
.
-
C. A. Vijayawardhana, H. B. Halsall and W. R. Heineman, in Electroanalytical Methods for Biological Materials, ed. J. Q. Chambers and A. Brajter-Toth, Marcel Dekker, NY, 2002, pp. 195–231 Search PubMed
.
- N. J. Ronkainen-Matsuno, J. H. Thomas, H. B. Halsall and W. R. Heineman, TrAC, Trends Anal. Chem., 2002, 21, 213–225 CrossRef CAS
.
- A. Bange, H. B. Halsall and W. R. Heineman, Biosens. Bioelectron., 2005, 20, 2488–2503 CrossRef CAS PubMed
.
- N. J. Ronkainen-Matsuno, H. B. Halsall and W. R. Heineman, Chem. Soc. Rev., 2010, 39, 1747–1763 RSC
.
- M. S. Wilson, Anal. Chem., 2005, 77, 1496–1502 CrossRef CAS PubMed
.
- M. S. Wilson and W. Nie, Anal. Chem., 2006, 78, 2507–2513 CrossRef CAS PubMed
.
- M. S. Wilson and W. Nie, Anal. Chem., 2006, 78, 6476–6483 CrossRef CAS PubMed
.
- J. Wang, Electroanalysis, 2007, 19, 769–776 CrossRef CAS
.
- J. V. Veetil and K. Ye, Biotechnol. Prog., 2007, 23, 517–531 CrossRef CAS PubMed
.
- X. Luo, A. Morrin, A. J. Killard and M. R. Smyth, Electroanalysis, 2006, 18, 319–326 CrossRef CAS
.
- H. Zhang, Q. Zhao, X.-F. Li and X. C. Le, Analyst, 2007, 132, 724–737 RSC
.
- J. Wang, Small, 2005, 1, 1036–1043 CrossRef CAS PubMed
.
- M. Dequaire, C. Degrand and B. Limoges, Anal. Chem., 2000, 72, 5521–5528 CrossRef CAS PubMed
.
- H. Guo, N. He, S. Ge, D. Yang and J. Zhang, Talanta, 2005, 68, 61–66 CrossRef CAS PubMed
.
- O. D. Velev and E. W. Kaler, Langmuir, 1999, 15, 3693–3698 CrossRef CAS
.
- G. Liu, J. Wang, J. Kim, M. Jan and G. Collins, Anal. Chem., 2004, 76, 7126–7130 CrossRef CAS PubMed
.
- J. Wang, G. Liu and M. R. Jan, J. Am. Chem. Soc., 2004, 126, 3010–3011 CrossRef CAS PubMed
.
- B. Munge, G. Liu, G. Collins and J. Wang, Anal. Chem., 2005, 77, 4662–4666 CrossRef CAS PubMed
.
- G. C. Jensen, X. Yu, B. Munge, A. Bhirde, J. D. Gong, S. N. Kim, F. Papadimitrakopoulos and J. F. Rusling, J. Nanosci. Nanotechnol., 2009, 9, 249–255 CrossRef CAS PubMed
.
- V. Mani, B. V. Chikkaveeraiah and J. F. Rusling, Expert Opin. Med. Diagn., 2011, 5, 381–391 CrossRef CAS PubMed
.
- J. F. Rusling, G. Sotzing and F. Papadimitrakopoulos, Bioelectrochemistry, 2009, 76, 189–194 CrossRef CAS PubMed
.
- X. Yu, V. Patel, G. Jensen, A. Bhirde, J. D. Gong, S. N. Kim, J. Gillespie, J. S. Gutkind, F. Papadimitrakopoulos and J. F. Rusling, J. Am. Chem. Soc., 2006, 128, 11199–11205 CrossRef CAS PubMed
.
- B. S. Munge, C. E. Krause, R. Malhotra, V. Patel, J. S. Gutkind and J. F. Rusling, Electrochem. Commun., 2009, 11, 1009–1012 CrossRef CAS PubMed
.
- R. Malhotra, V. Patel, J. P. Vaqué, J. S. Gutkind and J. F. Rusling, Anal. Chem., 2010, 82, 3118–3123 CrossRef CAS PubMed
.
- R. Malhotra, F. Papadimitrakopoulos and J. F. Rusling, Langmuir, 2010, 26, 15050–15056 CrossRef CAS PubMed
.
- C. B. Jacobs, M. J. Peairs and B. J. Venton, Anal. Chim. Acta, 2010, 662, 105–127 CrossRef CAS PubMed
.
- N. Karousis, N. Tagmatarchis and D. Tasis, Chem. Rev., 2010, 110, 5366–5397 CrossRef CAS PubMed
.
- Y. L. Zhao and J. F. Stoddart, Acc. Chem. Res., 2009, 42, 1161–1171 CrossRef CAS PubMed
.
- Z. Liu, S. Tabakman, K. Welsher and H. Dai, Nano Res., 2009, 2, 85–120 CrossRef CAS PubMed
.
- X. Yu, S. N. Kim, J. Gillespie, J. S. Gutkind, F. Papadimitrakopoulos and J. F. Rusling, Mol. BioSyst., 2005, 1, 70–78 RSC
.
- B. V. Chikkaveeraiah, A. Bhirde, R. Malhotra, V. Patel, J. S. Gutkind and J. F. Rusling, Anal. Chem., 2009, 81, 9129–9134 CrossRef PubMed
.
- B. V. Chikkaveeraiah, V. Mani, V. Patel, J. S. Gutkind and J. F. Rusling, Biosens. Bioelectron., 2011, 26, 4477–4483 CrossRef CAS PubMed
.
- R. Malhotra, V. Patel, B. V. Chikkaveeraiah, B. S. Munge, S. C. Cheong, R. B. Zain, M. T. Abraham, D. K. Dey, J. S. Gutkind and J. F. Rusling, Anal. Chem., 2012, 84, 6249–6255 CrossRef CAS PubMed
.
- B. A. Otieno, C. E. Krause, A. Latus, B. V. Chikkaveeraiah, R. C. Faria and J. F. Rusling, Biosens. Bioelectron., 2014, 53, 268–274 CrossRef CAS PubMed
.
- T. Soukka, H. Harma, J. Paukkunen and T. Lovgren, Anal. Chem., 2001, 73, 2254–2260 CrossRef CAS PubMed
.
- I. V. Safenkova, A. V. Zherdev and B. B. Dzantiev, J. Immunol. Methods, 2010, 357, 17–25 CrossRef CAS PubMed
.
- V. Gubala, C. Crean, R. Nooney, S. Hearty, B. McDonnell, K. Heydon, R. O'Kennedy, B. D. MacCraith and D. E. Williams, Analyst, 2011, 136, 2533–2541 RSC
.
- F. J. Martinez-Veracoechea and D. Frenkel, Proc. Natl. Acad. Sci. U. S. A., 2011, 108, 10963–10968 CrossRef CAS PubMed
.
- J. Huskens, A. Mulder, T. Auletta, C. A. Nijhuis, M. J. Ludden and D. N. Reinhoudt, J. Am. Chem. Soc., 2004, 126, 6784–6797 CrossRef CAS PubMed
.
- V. Martos, P. Castreno, J. Valero and J. de Mendoza, Curr. Opin. Chem. Biol., 2008, 12, 698–706 CrossRef CAS PubMed
.
- J. Huskens, Curr. Opin. Chem. Biol., 2006, 10, 537–543 CrossRef CAS PubMed
.
- M. Mammen, S. K. Choi and G. M. Whitesides, Angew. Chem., Int. Ed., 1998, 37, 2754–2794 CrossRef
.
- V. Mani, D. P. Wasalathanthri, A. A. Joshi, C. V. Kumar and J. F. Rusling, Anal. Chem., 2012, 84, 10485–10491 CrossRef CAS PubMed
.
- S. Krishnan, V. Mani, D. Wasalathanthri, C. V. Kumar and J. F. Rusling, Angew. Chem., Int. Ed., 2011, 50, 1175–1178 CrossRef CAS PubMed
.
- G. C. Jensen, C. E. Krause, G. A. Sotzing and J. F. Rusling, Phys. Chem. Chem. Phys., 2011, 13, 4888–4894 RSC
.
- C. E. Krause, B. A. Otieno, A. Latus, R. C. Faria, V. Patel, J. S. Gutkind and J. F. Rusling, ChemistryOpen, 2013, 2, 141–145 CrossRef CAS PubMed
.
- C. K. Tang, A. Vaze and J. F. Rusling, Lab Chip, 2012, 12, 281–286 RSC
.
- L. Qiang, S. Vaddiraju, J. F. Rusling and F. Papadimitrakopoulos, Biosens. Bioelectron., 2010, 26, 682–688 CrossRef CAS PubMed
.
- H.-X. Ren, X.-J. Huang, J.-H. Kim, Y.-K. Choi and N. Gu, Talanta, 2009, 78, 1371–1377 CrossRef CAS PubMed
.
- L. Zhang, Z. Cao, T. Bai, L. Carr, J.-R. Ella-Menye, C. Irvin, B. D. Ratner and S. Jiang, Nat. Biotechnol., 2013, 31, 553 CrossRef CAS PubMed
.
- S. Vaddiraju, A. Legassey, Y. Wang, L. Qiang, D. J. Burgess, F. Jain and F. Papadimitrakopoulos, J. Diabetes Sci. Technol., 2011, 5, 1044–1051 CrossRef PubMed
.
- L. Qiang, S. Vaddiraju, D. Patel and F. Papadimitrakopoulos, Biosens. Bioelectron., 2011, 26, 3755–3760 CrossRef CAS PubMed
.
- R. Szamocki, A. Velichko, C. Holzapfel, F. Muecklich, S. Ravaine, P. Garrigue, N. Sojic, R. Hempelmann and A. Kuhn, Anal. Chem., 2007, 79, 533–539 CrossRef CAS PubMed
.
- H. Zhu, Y. Liu, L. Shen, Y. Wei, Z. Guo, H. Wang, K. Han and Z. Chang, Int. J. Hydrogen Energy, 2010, 35, 3125–3128 CrossRef CAS
.
- Q. Wu, Y. Li, H. Xian, C. Xu, L. Wang and Z. Chen, Nanotechnology, 2013, 24, 025501 CrossRef PubMed
.
- H. Qiu and X. Huang, J. Electroanal. Chem., 2010, 643, 39–45 CrossRef CAS
.
- S. A. G. Evans, J. M. Elliott, L. M. Andrews, P. N. Bartlett, P. J. Doyle and G. Denuault, Anal. Chem., 2002, 74, 1322–1326 CrossRef CAS PubMed
.
- J. Chen, B. Lim, E. P. Lee and Y. Xia, Nano Today, 2009, 4, 81–95 CrossRef CAS
.
- W. Huang, M. Wang, J. Zheng and Z. Li, J. Phys. Chem. C, 2009, 113, 1800–1805 CAS
.
- M. H. Kim, X. Lu, B. Wiley, E. P. Lee and Y. Xia, J. Phys. Chem. C, 2008, 112, 7872–7876 CAS
.
- J. F. Huang and I. W. Sun, Adv. Funct. Mater., 2005, 15, 989–994 CrossRef CAS
.
- F. Jia, C. Yu, Z. Ai and L. Zhang, Chem. Mater., 2007, 19, 3648–3653 CrossRef CAS
.
- A. Huczko, Appl. Phys. A: Mater. Sci. Process., 2000, 70, 365–376 CrossRef CAS
.
- Y. X. Li, Q. F. Lu, S. N. Wu, L. Wang and X. M. Shi, Biosens. Bioelectron., 2013, 41, 576–581 CrossRef CAS PubMed
.
- P. Karam and L. I. Halaoui, Anal. Chem., 2008, 80, 5441–5448 CrossRef CAS PubMed
.
- X. H. Chen, N. Matsumoto, Y. B. Hu and G. S. Wilson, Anal. Chem., 2002, 74, 368–372 CrossRef CAS PubMed
.
- A. Guerrieri, V. Lattanzio, F. Palmisano and P. G. Zambonin, Biosens. Bioelectron., 2006, 21, 1710–1718 CrossRef CAS PubMed
.
- M. Yang, F. Qu, Y. Lu, Y. He, G. Shen and R. Yu, Biomaterials, 2006, 27, 5944–5950 CrossRef CAS PubMed
.
- S. Hrapovic, Y. L. Liu, K. B. Male and J. H. T. Luong, Anal. Chem., 2004, 76, 1083–1088 CrossRef CAS PubMed
.
- X.-J. Huang, A. M. O'Mahony and R. G. Compton, Small, 2009, 5, 776–788 CrossRef CAS PubMed
.
- I. L. Jones, P. Livi, M. K. Lewandowska, M. Fiscella, B. Roscic and A. Hierlemann, Anal. Bioanal. Chem., 2011, 399, 2313–2329 CrossRef CAS PubMed
.
- T. G. I. Ling, M. Beck, R. Bunk, E. Forsen, J. O. Tegenfeldt, A. A. Zakharov and L. Montelius, Microelectron. Eng., 2003, 67–68, 887–892 CrossRef CAS
.
-
Electrogenerated Chemiluminescence, ed. A. J. Bard, Marcel Dekker, New York, 2004 Search PubMed
.
- W. J. Miao, Chem. Rev., 2008, 108, 2506–2553 CrossRef CAS PubMed
.
- C. A. Marquette and L. J. Blum, Anal. Bioanal. Chem., 2008, 390, 155–168 CrossRef CAS PubMed
.
- P. Bertoncello and R. J. Forster, Biosens. Bioelectron., 2009, 24, 3191–3200 CrossRef CAS PubMed
.
- R. J. Forster, P. Bertoncello and T. E. Keyes, Annu. Rev. Anal. Chem., 2009, 2, 359–385 CrossRef CAS PubMed
.
- H. Qi, Y. Peng, Q. Gao and C. Zhang, Sensors, 2009, 9, 674–695 CrossRef CAS PubMed
.
- L. Hu and G. Xu, Chem. Soc. Rev., 2010, 39, 3275–3304 RSC
.
- H. Wei and E. Wang, Luminescence, 2011, 26, 77–85 CrossRef CAS PubMed
.
- Roche Diagnostics, http://rochediagnostics.ca/lab/solutions/e2010.php.
- Meso Scale Diagnostics, http://www.mesoscale.com.
-
J. B. Debad, E. N. Glezer, J. K. Leland, G. B. Sigal and J. Wholstadter, in Electrogenerated Chemiluminescence, ed. A. J. Bard, Marcel Dekker, NY, 2004, pp. 359–396 Search PubMed
.
- H. E. Van Ingen, D. W. Chan, W. Hubl, H. Miyachi, R. Molina, L. Pitzel, A. Ruibal, J. C. Rymer and I. Domke, Clin. Chem., 1998, 44, 2530–2536 CAS
.
- X. Xu, R. B. Jeffers, J. Gao and B. Logan, Analyst, 2001, 126, 1285–1292 RSC
.
- G. Yan, D. Xing, S. Tan and Q. Chen, J. Immunol. Methods, 2004, 288, 47–54 CrossRef CAS PubMed
.
- X. Li, R. Wang and X. Zhang, Microchim. Acta, 2011, 172, 285–290 CrossRef CAS
.
- C. Li, J. Lin, Y. Guo and S. Zhang, Chem. Commun., 2011, 47, 4442–4444 RSC
.
- G. Jie, L. Wang and S. Zhang, Chem.–Eur. J., 2011, 17, 641–648 CrossRef CAS PubMed
.
- R. Kurita, K. Arai, K. Nakamoto, D. Kato and O. Niwa, Anal. Chem., 2011, 82, 1692–1697 CrossRef PubMed
.
- S. Xu, Y. Liu, T. Wang and J. Li, Anal. Chem., 2011, 83, 3817–3823 CrossRef CAS PubMed
.
- D. Lin, J. Wu, F. Yan, S. Deng and H. Ju, Anal. Chem., 2011, 83, 5214–5221 CrossRef CAS PubMed
.
- L. Dennany, R. J. Forster and J. F. Rusling, J. Am. Chem. Soc., 2003, 125, 5213–5218 CrossRef CAS PubMed
.
- N. P. Sardesai, S. Pan and J. F. Rusling, Chem. Commun., 2009, 4968–4970 RSC
.
- N. P. Sardesai, J. C. Barron and J. F. Rusling, Anal. Chem., 2011, 83, 6698–6703 CrossRef CAS PubMed
.
- N. P. Sardesai, K. Kadimisetty, R. Faria and J. F. Rusling, Anal. Bioanal. Chem., 2013, 405, 3831–3838 CrossRef CAS PubMed
.
- C. D. Chin, T. Laksanasopin, Y. K. Cheung, D. Steinmiller and V. Linder,
et al.
, Nat. Med., 2011, 17, 1015–1019 CrossRef CAS PubMed
.
| This journal is © The Royal Society of Chemistry 2014 |

