 Open Access Article
Creative Commons Attribution 3.0 Unported Licence
Modelling the structural evolution of ternary phosphate glasses from melts to solid amorphous materials
Devis Di Tommaso*,
Richard I. Ainsworth,
Emilia Tang and
Nora H. de Leeuw*
Department of Chemistry, University College London, 20 Gordon Street, London WC1 H0AJ, UK. E-mail: d.tommaso@ucl.ac.uk; n.h.deleeuw@ucl.ac.uk
First published on 30th July 2013
Abstract
The local and medium-range structural properties of phosphate-based melts and glasses have been characterized by means of first principles (density functional theory) and classical (shell-model) molecular dynamics simulations. The structure of glasses with biomedically active molecular compositions, (P2O5)0.45(CaO)x(Na2O)0.55−x (x = 0.30, 0.35 and 0.40), have been generated using first principles molecular dynamics simulations for the full melt-and-quench procedure and the changes in the structural properties as the 3000 K melt is cooled down to room temperature have been compared extensively with those of the final glasses. The melts are characterized by a significant fraction of threefold (P3c) and fivefold (P5c) phosphorus atoms, but structural defects rapidly decrease during the cooling phase and for temperatures lower than 1800 K the system is free of under- and over-coordinated species. The analysis of the structures of the glasses at 300 K shows a prevalence of the metaphosphate Q2 and pyrophosphate Q1 species, whereas the number of Q3 units, which constitute the three-dimensional phosphate network, significantly decreases with the increase of calcium content in the glass. The radial and angular distribution functions indicate that higher calcium concentration in the glass leads to an increase of the rigidity of the phosphate tetrahedral network, which has been explained in terms of the calcium's higher field strength compared to that of sodium. The structural characterization of the melts and glasses obtained from first principles simulations was used to assess and validate a recently developed interatomic shell-model forcefield for phosphate-based materials. For all three compositions, our potential model is in good agreement with the first principles data. In the glass network, the forcefield provides a very good description of the split between the shorter distances of phosphorus to non-bonded oxygen and the longer distances of the phosphorus to bonded oxygen; the phosphorus–phosphorus medium-range distribution; and the coordination environment around the Na and Ca glass modifiers. Moreover, the distribution of the Qn species in the melts and glasses is in excellent agreement with the values extracted from the first principles simulations. In contrast, simulations using standard rigid ion potentials do not provide a satisfactory description of the local short-range structure of phosphate-based glasses and are therefore less suitable to model this class of multicomponent amorphous system.
Introduction
Biomedical materials for use in the body used to be dominated by metal implants, which are designed to have physical properties close to the replaced hard tissue and minimize the toxic response in the host, i.e. bio-inert materials without significant interactions with the surrounding tissue.1 However, one of the most important advances in this field was the development of biomedical implants that play an active, rather than a passive, role in tissue regeneration and degrade after the tissue has healed. This class of implant has been described as a “third generation” bio-active material.2 One commercially available bioactive glass is Bioglass®, composed of 45.0 wt% SiO2, 24.5 wt% CaO, 24.5 wt% Na2O and 6.0 wt% P2O5,3,4 which has been remarkably successful in many clinical applications, especially in dental and orthopaedic fields. However, questions relating to the long term effect of silica,5 and the slow degradation of these glasses, taking one to two years to disappear from the body,6 have prompted a search for more benign materials.An alternative class of “third-generation” biomaterial are phosphate-based bioactive glasses,7,8 containing PO4 units as network formers and sodium and calcium ions as network modifiers. These glasses have a chemical composition that is similar to the surrounding tissue and a dissolution rate that can be controlled by changing the phosphorus–calcium–sodium ratio.9 For example, experimental evidence shows an inverse relation between calcium content and dissolution rate,10 which suggests that the interaction of the Ca ions with the glass network controls the glass degradation. As the solubility of a glass is linked to its structure, insight into the effect of calcium and sodium ions on the P2O5 network is of fundamental interest to the design of phosphate bioglasses for applications in tissue engineering.
In this respect, molecular dynamics (MD) simulations allow for an atomic-level resolution of the structure and dynamics of the simulated system. This technique can thus be extremely useful in complementing and supporting experiments towards a fundamental understanding of the properties of amorphous materials. Classical molecular dynamics simulations have been applied extensively to the simulation of phosphosilicate glasses11–16 and binary phosphate glasses.17–25 However only very recently, a polarizable interatomic forcefield has been developed to model ternary CaO–Na2O–P2O5 systems.26 An alternative computational approach is the ab initio molecular dynamics (AIMD) technique,27 which is usually based on density functional theory.28 First principles simulations are significantly more computationally intensive than classical MD, and hence restricted to much smaller models (approximately 150 atoms) and simulation times (up to several tens of picoseconds).29,30 This methodology explicitly takes into account the electronic structure of the system and enables the accurate modelling of many-body and polarization effects. Therefore, AIMD represents a better computational approach to investigate challenging systems, such as ternary and quaternary bioglasses.11 AIMD methods have indeed been used to model the structural, electronic and dynamical properties of bioactive silicate31–34 and, more recently, binary, ternary and quaternary phosphate glasses.35
A common approach in AIMD simulations of glasses is to conduct the quench-from-the-melt using classical MD, and the glass structure thus generated is then used as the starting point for an AIMD run.20,33,34,36 This protocol allows a partial relaxation of the structure at quantum mechanical level, but other structural features, such as the inter-tetrahedral connectivity and ionic coordination shells, depend on the quality of the forcefields used to generate the glass. Alternatively, the glass structure can be obtained using AIMD for the whole melt-and-quench procedure. This full ab initio procedure is computationally very demanding and much less common than the mixed classical/ab initio approaches.32,35,37 However, the application of the AIMD melt-and-quench procedure allows an accurate investigation of the mechanism of glass formation, and the full ab initio glass produced using this approach is characterised by a quantum mechanical accuracy that extends beyond the short range. Therefore, the structural evolution of ternary phosphate systems, as a function of temperature obtained from ab initio simulations, can be used to assess the quality of interatomic forcefields for modelling the melts and solid amorphous states of this important class of materials. However, it is also important to note that the small simulation boxes that are accessible by AIMD prevent a good statistical analysis of the local- and medium-range structural properties. Using a combination of AIMD simulations and NMR experiments for fluorinated bio-glasses, Pedone and co-workers have shown that the cooling rates used in full ab initio melt-and-quench procedures can lead to glasses with computational defects.38 This disadvantage of AIMD simulations was one of the main reasons why we have developed an accurate shell model potential for PBGs and carried out the comparative study between the two methods reported here.
In this work, we present AIMD simulations of three ternary phosphate-based systems with biomedically applicative molar compositions, (P2O5)0.45(CaO)x(Na2O)0.55−x (x = 0.30, 0.35 and 0.40), both in the melt and in the amorphous state. The study focuses on the structural and dynamical differences between the liquid and the corresponding glass, on the changes of these properties during the glass formation mechanism, and on the effect of the calcium–sodium ratio to the glass structure. The ab initio melt and glass structures have then been used to assess and validate the formal charge shell model interatomic potential that we have recently developed to simulate phosphate-based materials.26
Computational methodology
Ab initio molecular dynamics
AIMD simulations were carried out using the Car-Parrinello code included in the Quantum-ESPRESSO package, version 4.0.1.39 The electronic structure was described by the Perdew–Burke–Ernzerhof (PBE) gradient-corrected density functional.40 Vanderbilt ultrasoft pseudopotentials41,42 represented core–valence electron interactions for all atomic species; semicore shells were explicitly included for Na and Ca. The electronic wavefunctions were expanded in a plane wave (PW) basis set with a kinetic energy cutoff of 40 Ry and k-sampling was restricted to the Γ point of the Brillouin zone. The time step for simulations was set to 0.121 fs and the electronic mass was set to 700 a.u. The temperature was controlled using a Nosé–Hoover chain thermostat.43 Previous ab initio simulations20,33,44,45 have proven the accuracy of the method employed in this work in determining structural, dynamical, and electronic properties of glasses.Classical molecular dynamics
Classical molecular dynamics (MD) simulations were carried out using the DL_POLY code (version 2.20).46 The Evans thermostat47 was used and the timestep between successive integration of the Newtonian equations of motion was set to 2 fs. We have used a full charge shell model (SM) interatomic potential that was recently parameterized26 to reproduce experimental structural48 and first principles (density functional theory) mechanical properties of crystalline phosphorus pentoxide [o′(P2O5)∞].49 Short-range Buckingham potentials were used to describe the interaction of the oxygen shells with each other and with P, Na and Ca. Three-body harmonic potentials were used to control the inter-tetrahedral O–P–O and P–O–P angles. The potential terms and parameters used in this work are reported in Table 1. We have also used the standard rigid ion (RI) partial charge potential of Teter for comparison, with short-range Buckingham terms for the pair interactions between oxygen and P, O,19 Na and Ca.50| Buckingham: Ae−r/ρ − Cr−6 | A (eV) | ρ (Å) | C (eV Å6) | Cutoff (Å) | |
|---|---|---|---|---|---|
| Oshell | Oshell | 22![[thin space (1/6-em)]](https://www.rsc.org/images/entities/char_2009.gif) 764.3000 764.3000 |
0.149000 | 27.88000 | rmin = 0.0/rmax = 5.0 |
| Pcore | Oox,shell | 1020.0000 | 0.343220 | 0.03000 | rmin = 0.0/rmax = 5.0 |
| Nacore | Oshell | 56![[thin space (1/6-em)]](https://www.rsc.org/images/entities/char_2009.gif) 465.3453 465.3453 |
0.193931 | 0.00000 | rmin = 0.0/rmax = 5.0 |
| Cacore | Oshell | 2152.3566 | 0.309227 | 0.09944 | rmin = 0.0/rmax = 5.0 |
| Three-body (the pivot is first atom):
|
k3 (eV rad−2) | θ0 (°) | |||
|---|---|---|---|---|---|
| Pcore | Oshell | Oshell | 3.3588 | 109.470000 | r(1–2)max = 2.2, r(1–3)max = 2.2 |
| Oshell | Pcore | Pcore | 7.6346 | 141.179333 | r(1–2)max = 2.2, r(1–3)max = 2.2 |
| Spring:
|
kcs (eV Å−2) | ||
|---|---|---|---|
| Ocore | Oshell | 74.92 | Applies between oxygen core and its shell |
| Charges | (e) |
|---|---|
| Cacore | +2.0000 |
| Nacore | +1.0000 |
| Pcore | +5.0000 |
| Ocore | +0.8482 |
| Oshell | −2.8482 |
Simulation protocol
The phosphate glasses considered in the present study have the chemical formula (P2O5)0.45(CaO)x(Na2O)0.55−x, with x = 0.30, 0.35 and 0.40 (P45C30N25, P45C35N20 and P45C40N15, where P2O5 = P, CaO = C and Na2O = N). The size and composition of the simulated glass systems are reported in Table 2. Previous studies have shown that the local structures and dynamics of silicate glasses can be reproduced accurately using a periodic cell of ∼10 Å.36,51 The compositions that we have investigated in this work are therefore built for a similar cell, according to the experimental densities at room temperature.52| (P2O5)0.45(CaO)x(Na2O)0.55−x | Composition | Density (g cm−3) | Cell size (Å) | No. of atoms |
|---|---|---|---|---|
| x = 0.30 | P18O56Na10Ca6 | 2.56 | 10.767 | 90 |
| x = 0.35 | P18O56Na8Ca7 | 2.57 | 10.742 | 89 |
| x = 0.40 | P18O56Na6Ca8 | 2.59 | 10.704 | 88 |
The structures of the phosphate glasses P45C30N25, P45C35N20 and P45C40N15 were generated using a full AIMD melt-and-quench procedure. For each glass, the initial configuration was created by randomly placing the atoms in the simulation box, taking care to avoid significant overlaps by means of appropriate distance cut-offs. This configuration was relaxed in the NVE (constant number of particles N, constant volume V, and constant energy E) ensemble and, after an initial quench of all ion velocities, the system was spontaneously (i.e. without external thermostatting) heated up to 1500 K. At this point, a series of 10 subsequent NVT (constant number of particles, volume and temperature) runs of 10–15 ps each were conducted, whose target temperatures were set at 300 K intervals from 3000 K down to 600 K, with the coefficients of the electronic wavefunction re-optimised at each new temperature. This cooling phase corresponds to a nominal cooling rate of 20 K ps−1, which is higher than typical cooling rates accessible in classical MD simulation, but comparable or lower than those used previously in the generation of silicate51 or phosphosilicate32,37 glasses, using a full ab initio melt and quench approach. Finally, at 300 K the production phase was carried out for 20 ps duration. The generation of glasses using classical MD employed the same protocol.
Results and discussion
Short-range structure – AIMD
The radial distribution functions (RDFs) for the 3000 K melts and the glasses at 300 K of the (P2O5)0.45(CaO)x(Na2O)0.55−x (x = 30, 35 and 40) systems, simulated using AIMD, are shown in Fig. 1. The positions and intensities of the peaks are also reported in Table 3. The positions of the peaks do not change significantly with temperature but, due to increased thermal motion and structural disorder in the melt, the intensities of the peaks in the glasses increases by a factor of 1.5–3, compared to the melts with a corresponding increase in the full-width-half-maximum (FWHM) values. The P–O RDFs of the glasses are characterised by two well-defined peaks at 1.52 Å and 1.61–1.64 Å, the separation of which increases slightly with increasing Ca/Na ratio (see Table 3). Fig. 2 reports the temperature evolution of the P–O RDFs for P45C40N15, where it is noted that the P–O splitting occurs at 600 K.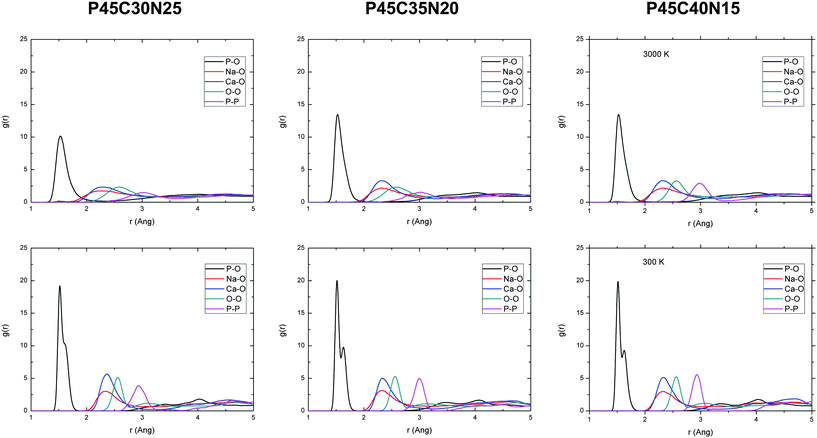 | ||
| Fig. 1 Radial distribution functions of the 3000 K melts (top) and 300 K glasses (bottom) computed from the AIMD simulations of the (P2O5)0.45CaOxNa2O0.55−x (x = 30, 35 and 40) systems. | ||
| Composition | T (K) | P–O | Na–O | Ca–O | O–O | P–P | |
|---|---|---|---|---|---|---|---|
| P45C30N25 | 3000 | rmax (Å) | 1.52 | 2.24 | 2.33 | 2.60 | 3.05 |
| gmax | 10.22 | 1.75 | 2.33 | 2.33 | 1.49 | ||
| 300 | rmax (Å) | 1.51/1.63 | 2.36 | 2.36 | 2.57 | 2.93 | |
| gmax | 21.73 | 3.04 | 5.72 | 5.26 | 3.92 | ||
| P45C35N20 | 3000 | rmax (Å) | 1.52 | 2.33 | 2.33 | 2.60 | 3.05 |
| gmax | 13.84 | 2.19 | 3.32 | 2.33 | 1.53 | ||
| 300 | rmax (Å) | 1.51/1.64 | 2.33 | 2.33 | 2.57 | 2.99 | |
| gmax | 22.94 | 3.14 | 5.07 | 5.42 | 5.04 | ||
| P45C40N15 | 3000 | rmax (Å) | 1.52 | 2.33 | 2.33 | 2.57 | 2.99 |
| gmax | 13.84 | 2.19 | 3.32 | 3.25 | 2.95 | ||
| 300 | rmax (Å) | 1.52/1.64 | 2.33 | 2.33 | 2.57 | 2.93 | |
| gmax | 22.73 | 3.01 | 5.14 | 5.36 | 5.72 |
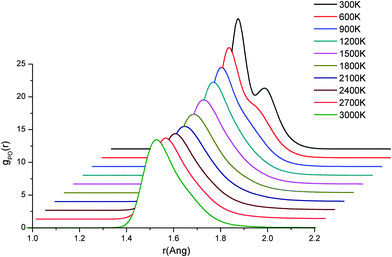 | ||
| Fig. 2 Radial distribution functions of the P–O atomic pair for P45C40N15 at different temperatures. AIMD simulations. | ||
The angular distribution functions (ADFs) of the tetrahedral network (O–P–O and P–O–P) are displayed in Fig. 3 and the positions and intensities of the intra-tetrahedral (O–P–O) and inter-tetrahedral (P–O–P) ADF peaks are reported in Table 4. In the glasses, the O–P–O angle distributions are quite narrow and, depending on the composition, centred at 108.0–109.3 degrees (see Table 4), in good agreement with the theoretical tetrahedral value of 109.5°. The distribution of the P–O and O–O distances (Fig. 1) and of the O–P–O angular distributions (Fig. 3) thus denotes a structural order within each tetrahedron that is essentially constant with the change in composition. In the melts at 3000 K, the ADFs display a significantly broader profile with tails extending below 100° for compositions P45C35N20 and P45C40N15, which will be discussed in greater detail. The P–P distances and P–O–P angles of the glasses, which reflect the interconnectivity between the phosphate tetrahedra, are affected by the glass composition: FWHM of the P–P distances is equal to 0.3 Å in P45C30N25 and reduces to 0.12 Å in the glass with 40% CaO content. The FWHM of the P–O–P angles decreases from the value of 24° in the P45C30N25 glass, to 16° in P45C40N15. This observation indicates that the effect of calcium ions on the structure of the glass is to increase the rigidity of the phosphate P–O–P interconnectivity, which could simply be interpreted in terms of the more rigid coordination shell and higher field strength of calcium,53 compared to that of sodium.54,55 The increased rigidity of the phosphate network with the addition of calcium content could then be linked to the observed slower solubility of glasses with higher CaO content.10 However, it is important to note this conclusion only relies on the structural analysis of the bulk and that in order to verify this hypothesis, the processes that occur at the interface between phosphate bio-glasses and water should also be considered,31 which will be the subject of future work.
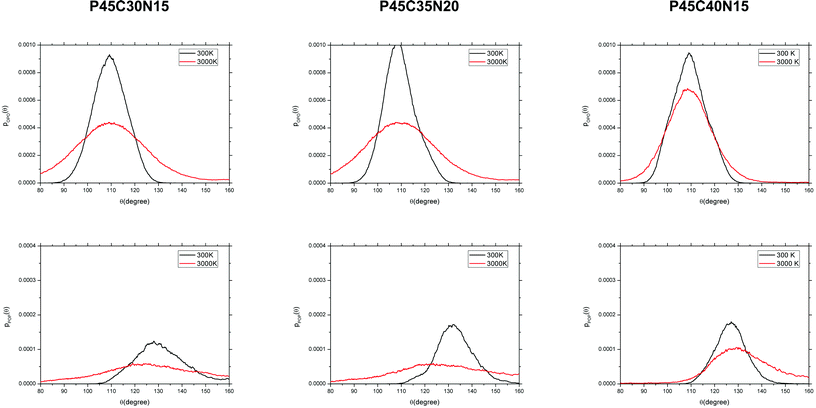 | ||
| Fig. 3 Angular distribution functions of the O–P–O (top) and P–O–P angles (bottom) computed from the AIMD simulations of the (P2O5)0.45(CaO)x(Na2O)0.55−x (x = 30, 35 and 40) systems. | ||
| Composition | T (K) | O–P–O | P–O–P | |
|---|---|---|---|---|
| P45C30N25 | 3000 | θmax (degree) | 108.9 | 123.8 |
| p(θmax) | 4.4 × 10⁻⁴ | 0.6 × 10⁻⁴ | ||
| 300 | θ (degree) | 109.3 | 128.0 | |
| p(θmax) | 9.3 × 10⁻⁴ | 1.2 × 10⁻⁴ | ||
| P45C35N20 | 3000 | θ (degree) | 107.5 | 123.4 |
| p(θmax) | 4.4 × 10⁻⁴ | 0.6 × 10⁻⁴ | ||
| 300 | θ (degree) | 108.0 | 132.4 | |
| p(θmax) | 11.0 × 10⁻⁴ | 1.7 × 10⁻⁴ | ||
| P45C40N15 | 3000 | θ (degree) | 108.4 | 129.3 |
| p(θmax) | 6.9 × 10⁻⁴ | 1.1 × 10⁻⁴ | ||
| 300 | θ (degree) | 109.0 | 127.1 | |
| p(θmax) | 9.5 × 10⁻⁴ | 1.8 × 10⁻⁴ |
In Fig. 4, the P45C40N15 O–P–O and P–O–P angles of the 3000 K melt have been decomposed into the contributions from the twofold (P2c), threefold (P3c), fourfold (P4c) and fivefold (P5c) coordinated P and O atoms. The P–O–P angle is exclusively represented by the P4c–O2c–P4c angle as the contribution from the angles involving threefold and fivefold coordinated P atoms are not significant. This suggests that the broadening of the P–O–P distribution in the melt, compared to that of the glass, is only related to a distortion due to an increased thermal motion, and not to specific under- or over-coordination of the atoms in the phosphate chains. A similar situation occurs for the O–P–O angular distribution, where contributions to O–P–O from O2c–P4c–O2c and O1c–P4c–O1c sequences are centred at 100° and 118° respectively, comparable to the structural geometry found in crystalline o′(P2O5)∞.48
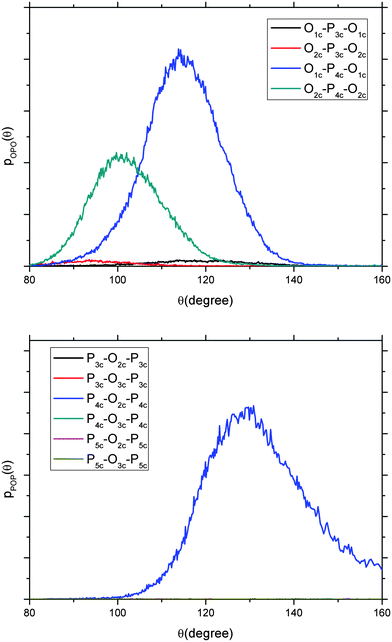 | ||
| Fig. 4 Decomposition of the O–P–O (top) and P–O–P (bottom) angular distribution functions into the contributions from the twofold, threefold, fourfold and fivefold coordinated P and O atoms of the 3000 K melt with composition P45C40N15. AIMD simulations. | ||
Fig. 5 reports the ADFs of the network modifiers (O–Ca–O and O–Na–O). In the melts, the O–Na–O and O–Ca–O distributions display no compositional dependence with first peak positions at approximately 57°. A typical arrangement of oxygen atoms around the calcium and sodium atoms in the glass is reported in Fig. 6. Modifiers coordinate mostly with non-bridging oxygen (NBO) atoms belonging to different PO4 tetrahedra, hence controlling the folding and connectivity of the phosphate network. The O–Na–O distributions in Fig. 5 are characterized by quite a wide range of allowed angles, which can be explained in terms of the higher flexibility of the Na cation compared with Ca. For all compositions, the O–Na–O ADFs have a peak at 50–60°, which is a result of the coordination by the Na to two oxygen atoms (possibly one NBO and one BO) belonging to the same tetrahedron (O1–Na–O2 in Fig. 6). A second peak at 90° results from the coordination with NBO of different tetrahedra (O2–Na–O3 in Fig. 6). O–Ca–O second peak positions decrease from 80° in P45C30N25 to 75° in P45C40N15. Finally, the FWHM values for the second O–Ca–O ADF peaks are 29° and 21° for the P45C30N25 and P45C40N15 compositions respectively, suggesting that the increase of calcium content in the PBG decreases the flexibility of the coordination shell of Ca and consequently increases the rigidity of the glass.
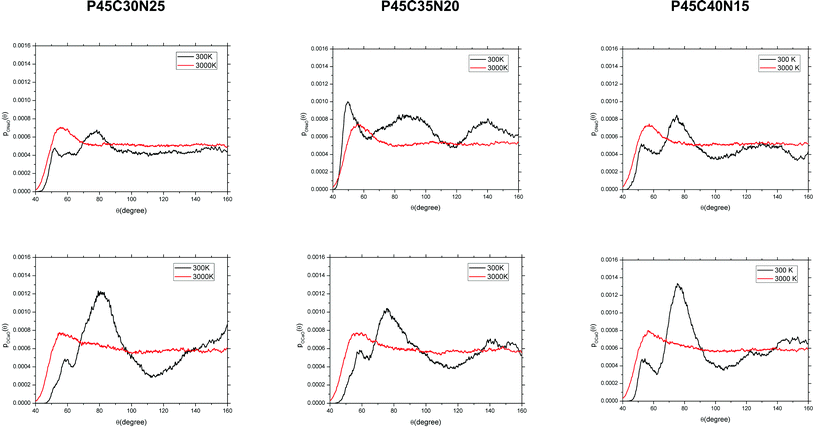 | ||
| Fig. 5 Angular distribution functions of the O–Na–O (top) and O–Ca–O (bottom) angles computed from the AIMD simulations of the (P2O5)0.45(CaO)x(Na2O)0.55−x (x = 30, 35 and 40) systems. | ||
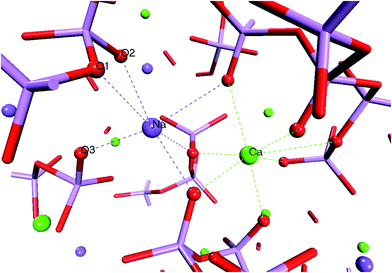 | ||
| Fig. 6 Snapshot from the AIMD trajectory of the P45C30N25 glass showing the typical calcium and sodium coordination shells. Ca, Na, O and P are pictured as green, purple, red and pink spheres, respectively. | ||
Medium-range structure – AIMD
The distributions of the Qn species for the three compositions are reported in Table 5 and displayed in Fig. 7. In the P2O5–CaO–Na2O melts and glasses, the coordination statistics denote a shift of the Qn distribution from 100% Q3 in vitreous P2O5 to lower values of n in the simulated (P2O5)0.45(CaO)x(Na2O)0.55−x (x = 0.30, 0.35 and 0.40) systems. Compared with the Qn distribution of the glasses, the melts display a decrease in the fraction of Q2 species and the fraction of Q1 species is higher (see Table 5). For all three glasses, the calculated Qn distributions show a prevalence of metaphosphate Q2, forming chain-like phosphate fragments and pyrophosphate Q1 species, in agreement with the experimental 31P NMR analysis of PBGs with similar composition.9 Table 5 also indicates that the percentage of Q3 species is considerably smaller than Q1 and Q2: Q3 units are approximately 11% of the total PO4 tetrahedra in the P45C30N25 glass and this value reduces to zero in P45C35N20 and to only 5.6% in P45C40N15. It is interesting to note that the glass with the intermediate composition, P45C35N20, is characterized by the highest concentration of Q2 species, which appears to occur at the expense of the Q3 species. Classical MD simulations of the binary NaPO3 glass found a distribution of Q3 units of 25.4%, which is considerably larger than the percentage found in the ternary glasses. This would suggest that the calcium ion generally has a stronger tendency to break P–BO–P bonds and form P–NBO⋯M species than sodium, and these modify the three-dimensional Q3 network into a chain-like phosphate network, as illustrated by the snapshot of the AIMD simulation of the P45C30N25 glass in Fig. 6. The population of isolated Q0 species, also referred to as orthophosphate units, decreases from 5.6% in P45C30N25 to zero orthophosphate species in the PBGs with 35% and 40% content of CaO (see Fig. 7). It is known from experiment that glasses with higher calcium content show a slower solubility than glasses with higher sodium content,10 whereas the results from our simulations suggest that the concentration of isolated PO4 units in the glass decreases with calcium content, which would suggest that the solubility trends of PBG could not be structurally dominated by the presence of orthophosphate species. However, it is worthy of note that due to the small simulated system sizes, absolute Qn abundances should not be considered representative and medium-range structural trends are subject to large uncertainties.
| Composition | T (K) | Qn distribution | P coordination (%) | |||||||||
|---|---|---|---|---|---|---|---|---|---|---|---|---|
| Q0 | Q1 | Q2 | Q3 | Q4 | Q5 | NC | P2c | P3c | P4c | P5c | ||
| P45C30N25 | 3000 | 8.6 | 31.5 | 50.4 | 8.5 | 0.9 | 0.1 | 1.6 | 0.0 | 10.1 | 88.0 | 1.9 |
| 300 | 5.6 | 22.2 | 61.1 | 11.1 | 0.0 | 0.0 | 1.8 | 0.0 | 0 | 100 | 0 | |
| P45C35N20 | 3000 | 9.7 | 35.5 | 44.1 | 9.3 | 1.1 | 0.1 | 1.6 | 0.4 | 12.9 | 83.8 | 2.8 |
| 300 | 0.0 | 22.2 | 77.8 | 0.0 | 0.0 | 0.0 | 1.8 | 0 | 0 | 100 | 0 | |
| P45C40N15 | 3000 | 12.1 | 36.3 | 40.1 | 9.7 | 1.4 | 0.3 | 1.5 | 0.4 | 15.8 | 80.3 | 3.5 |
| 300 | 0.0 | 27.8 | 66.7 | 5.6 | 0.0 | 0.0 | 1.8 | 0 | 0 | 100 | 0 | |
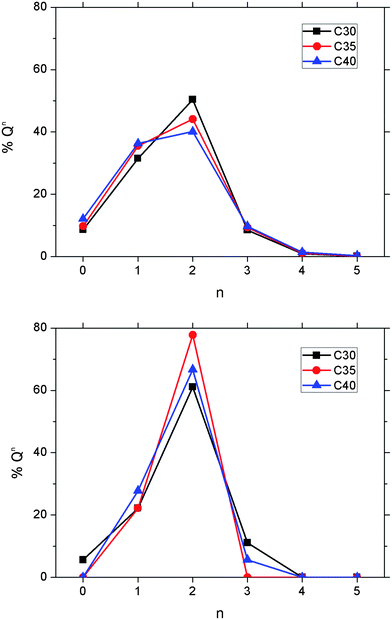 | ||
| Fig. 7 Distribution of Qn species in the 3000 K melts (top) and glasses at 300 K (bottom) computed from the AIMD simulations of the (P2O5)0.45CaOxNa2O0.55−x (x = 30, 35 and 40) systems. | ||
Fig. 8(a) reports the changes in the Qn distribution as the 3000 K melt of the P45C40N15 system is gradually cooled down to 300 K, and shows a decrease in Q0, Q1 and Q3 with a corresponding increase in Q2. Results from classical MD simulations are also presented and comparative analysis will follow in later sections.
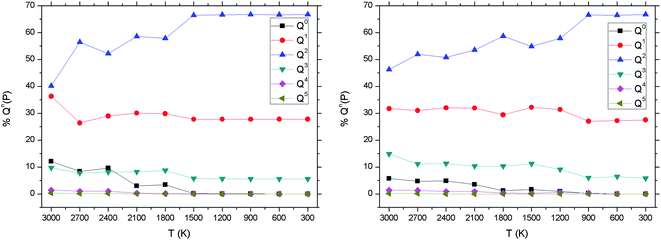 | ||
| Fig. 8 P45C40N15 Qn distribution versus temperature from ab initio (left) and shell model (right) MD simulations. | ||
The coordination statistics reported in Table 5 show that, in the melts, the concentration of under- and over-coordinated species is significant (10.1–15.8% for P3c and 1.9–3.5% for P5c), whereas in the glasses an ideal tetrahedral (P4c) environment for phosphorus is reported. Finally, Fig. 9 reports the change in P and O coordination as the melt is gradually cooled from 3000 K to 300 K, which shows that no defects are present in the system below 1500 K and that the P atoms have the tendency to be under-coordinated in the melt, rather than over-coordinated.
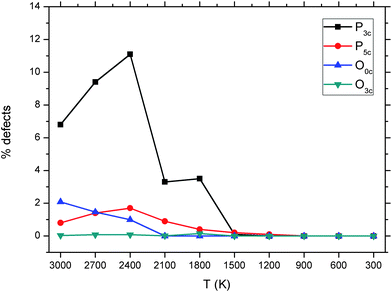 | ||
| Fig. 9 Average total fraction of threefold- and fivefold-coordinated P, threefold coordinated O and uncoordinated O computed from the AIMD simulations melt of the P45C40N15 system. | ||
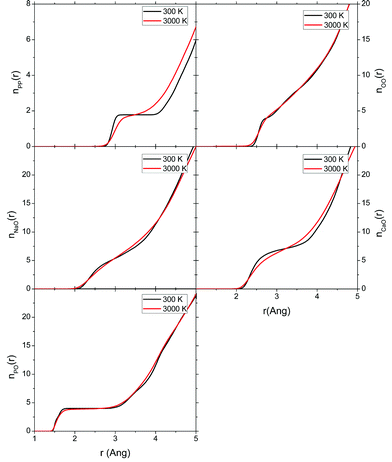 | ||
| Fig. 10 Cumulative (integrated) coordination numbers calculated for the 3000 K melts and glasses at 300 K computed from the AIMD simulations melt of the P45C40N15 system. | ||
| Atomic pair | Cutoff (Å) | 3000 K | 2700 K | 2400 K | 2100 K | 1800 K | 1500 K | 1200 K | 900 K | 600 K | 300 K |
|---|---|---|---|---|---|---|---|---|---|---|---|
| P–O | 2.3 | 3.87 | 3.89 | 3.89 | 3.98 | 3.97 | 4.00 | 4.00 | 4.00 | 4.00 | 4.00 |
| Na–O | 3.3 | 6.82 | 6.82 | 6.82 | 6.90 | 6.78 | 6.83 | 6.82 | 6.65 | 6.61 | 6.47 |
| Ca–O | 3.3 | 7.24 | 7.30 | 7.30 | 7.10 | 7.15 | 7.20 | 7.17 | 7.28 | 7.18 | 7.20 |
Table 7 summarizes the average oxygen coordination shells of P, Na and Ca for the glasses at 300 K and their decomposition into the BO and NBO components. Fig. 11 also reports the decomposition of the P–O, Na–O and Ca–O RDFs into the BO and NBO components. For all three glass compositions, the P–NBO distance is at 1.51 Å, whereas the P–BO RDFs are characterised by a peak at 1.64 Å (see Fig. 11). Neutron diffraction studies of NaPO3 (ref. 57) and XRD measurements of ternary phosphate glasses52 have shown the occurrence of two well-separated peaks located at approximately 1.5 Å and 1.6 Å. These were attributed by the authors to the different bridging and non-bridging P–O bonds, respectively. Our results clearly support this experimental interpretation. The overall BO![[thin space (1/6-em)]](https://www.rsc.org/images/entities/char_2009.gif) :
:![[thin space (1/6-em)]](https://www.rsc.org/images/entities/char_2009.gif) NBO ratio for the decomposed P–O shows a slightly higher NBO fraction, which reflects the prevalence of meta-phosphate. The decomposition of the Na–O and Ca–O into BO and NBO components in Fig. 11 shows that the sodium and calcium are mostly coordinated to the non-bonding oxygens (see Table 7) and that the M–BO and M–NBO distances have two quite distinct values: the Na–NBO and Ca–NBO pairs have well defined peaks at 2.32 Å and 2.35 Å, respectively; Na–BO has a broad peak approximately centered at 2.6 Å; the Ca–BO distance is between 2.6 Å and 2.8 Å in the glasses with composition P45C35N20 and P45C40N15. The P45C30N25 Ca–BO RDF does not have any first coordination shell peak, indicating that for this glass composition, the calcium is not coordinated to bonding oxygen.
NBO ratio for the decomposed P–O shows a slightly higher NBO fraction, which reflects the prevalence of meta-phosphate. The decomposition of the Na–O and Ca–O into BO and NBO components in Fig. 11 shows that the sodium and calcium are mostly coordinated to the non-bonding oxygens (see Table 7) and that the M–BO and M–NBO distances have two quite distinct values: the Na–NBO and Ca–NBO pairs have well defined peaks at 2.32 Å and 2.35 Å, respectively; Na–BO has a broad peak approximately centered at 2.6 Å; the Ca–BO distance is between 2.6 Å and 2.8 Å in the glasses with composition P45C35N20 and P45C40N15. The P45C30N25 Ca–BO RDF does not have any first coordination shell peak, indicating that for this glass composition, the calcium is not coordinated to bonding oxygen.
| Atomic pair | P45C30N25 | P45C35N20 | P45C40N15 |
|---|---|---|---|
| CNav | CNav | CNav | |
| P–O | 4.00 | 4.00 | 4.00 |
| P–BO | 1.78 | 1.78 | 1.78 |
| P–NBO | 2.22 | 2.22 | 2.22 |
| Na–O | 6.22 | 6.74 | 6.47 |
| Na–BO | 0.87 | 1.42 | 0.91 |
| Na–NBO | 5.35 | 5.32 | 5.56 |
| Ca–O | 7.22 | 7.11 | 7.20 |
| Ca–BO | 0.11 | 0.55 | 0.88 |
| Ca–NBO | 7.10 | 6.56 | 6.32 |
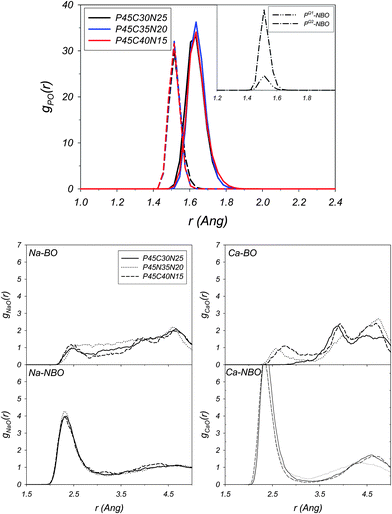 | ||
| Fig. 11 Glass at 300 K with composition P45C30N25. Decomposition of the P–O radial distribution functions into their BO (solid line) and NBO (dashed line) components (top). The inset reports the decomposition of the P–NBO radial distribution function into their PQ1–NBO and PQ2–NBO components. Decomposition of the Na–O and Ca–O into their BO and NBO components (bottom). AIMD simulations. | ||
Comparison of AIMD and classical MD melts and glasses
In this section we report a comparison of the structure of the phosphate melts and glasses obtained from the ab initio and classical MD melt-and-quench procedures. The structural information obtained using first principles simulations can be used as a direct reference to assess and validate the shell model (SM) interatomic forcefield.The RDFs and O–P–O ADF of the glass with composition P45C35N20 are shown in Fig. 12. The SM provides general good agreement with the ab initio data. In particular, the forcefield is able to simulate the split between the P![[double bond, length as m-dash]](https://www.rsc.org/images/entities/char_e001.gif) O and P–O and gives a good description of the intra-tetrahedral geometry, as evidenced by the O–P–O angle distribution in Fig. 12. The most significant difference is found in the P–P distribution, which in the SM glass has a significantly more intense first peak than the ab initio glass. This is most likely due to the strong force constant in the three-body P–O–P potential (see Table 1), which was derived to obtain a good description of the inter-tetrahedral P–O–P angle and mechanical properties of crystalline o′(P2O5)∞.49
O and P–O and gives a good description of the intra-tetrahedral geometry, as evidenced by the O–P–O angle distribution in Fig. 12. The most significant difference is found in the P–P distribution, which in the SM glass has a significantly more intense first peak than the ab initio glass. This is most likely due to the strong force constant in the three-body P–O–P potential (see Table 1), which was derived to obtain a good description of the inter-tetrahedral P–O–P angle and mechanical properties of crystalline o′(P2O5)∞.49
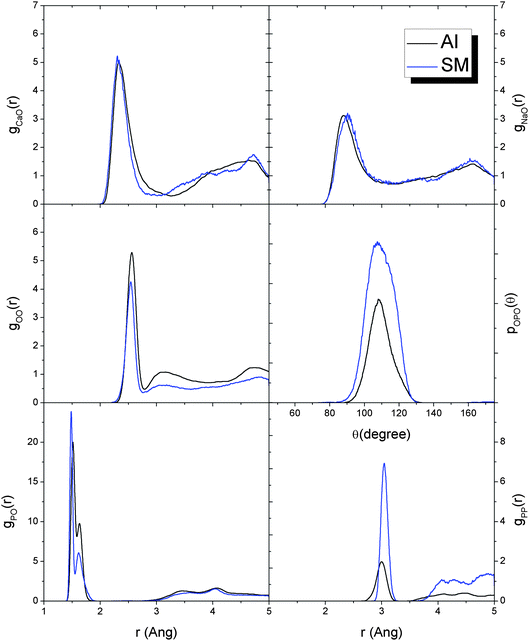 | ||
| Fig. 12 Comparison of the Ca–O, Na–O, O–O, P–O and P–P radial distribution functions and O–P–O angular distribution functions of the P45C35N20 glass at 300 K obtained from full ab initio (AI) and shell model (SM) molecular dynamics melt-and-quench procedures. | ||
A comparison of the P–O, Na–O and Ca–O distances in the glasses (P2O5)0.45(CaO)x(Na2O)0.55−x (x = 0.30, 0.35 and 0.40), decomposed into the BO and NBO components, is reported in Table 8, together with the short-range structural data for P45C30N25 obtained from XRD experiments.52 Also reported are the structures of the glasses simulated with the rigid ion (RI) potential model, using a modified Teter potential. However, for the systems with composition P45C30N25 and P45C40N15, it was not possible to generate the structures of the glasses at 300 K from a full melt-and-quench approach; during the high temperature molecular dynamics simulations, the temperature of these systems did not equilibrate to the target temperature but their energies and temperatures diverged to very large unphysical values. Therefore, for P45C30N25 and P45C40N15, we have used the glass structure generated with the shell model potential to carry out 40 ps of NVT (300 K) simulations, using the RI model from which the P–O, Na–O and Ca–O distances were extracted. Table 8 shows that the split between P–BO and P–NBO in the SM glasses (0.09–0.15 Å) is similar to that in the AI glasses (0.12–0.13 Å). This classical potential predicts an average P–O distance, which is slightly shorter, but very close to the experimental estimates (see Table 8). We can therefore conclude that the SM potential provides an accurate description of the P–O distances. Compared with the ab initio results, the RI model describes quite accurately the Na–O and Ca–O distances (see Table 8) but predicts a difference between P–BO and P–NBO distances of 0.06 Å, approximately one-half of that found in the SM and AI glasses and experiment. The mixed character of the P–O bonds, whose ionic-covalent balance depends on the local coordination environment, such as the composition and geometry of the Na/Ca cations surrounding the PO4 tetrahedra,11 implies that a satisfactory description of the local- and medium-range structural features of ternary phosphate-based glasses requires the application of a shell model approach to explicitly include the oxide polarization in the potential.
| Composition | AI | SM | RI | Exp. | |
|---|---|---|---|---|---|
| a XRD experiments.52b Average of BO and NBO distances.c ND and NMR experiments. | |||||
| P45C30N25 | r(P–BO) | 1.63 (1.8) [0.06] | 1.63 (1.8) [0.08] | 1.54 (1.8) [0.04] | 1.60 ± 0.02a |
| r(P–NBO) | 1.51 (2.2) [0.04] | 1.48 (2.2) [0.03] | 1.48 (2.2) [0.03] | 1.52 ± 0.02a | |
| r(Na–BO) | 2.51 (1.0) [0.20] | 2.41 (0.9) [0.21] | 2.53 (2.4) [0.17] | 2.41 ± 0.02a,b | |
| r(Na–NBO) | 2.35 (5.4) [0.21] | 2.32 (5.5) [0.17] | 2.35 (4.0) [0.18] | ||
| r(Ca–BO) | −(0.1) | 2.65 (0.7) [0.15] | 2.47 (2.8) [0.20] | 2.40 ± 0.02a,b | |
| r(Ca–NBO) | 2.35 (7.1) [0.16] | 2.29 (6.2) [0.15] | 2.41 (3.9) [0.16] | ||
| P45C35N20 | r(P–BO) | 1.64 (1.8) [0.05] | 1.60 (1.8) [0.06] | 1.54 (1.8) [0.03] | |
| r(P–NBO) | 1.51 (2.2) [0.04] | 1.48 (2.2) [0.03] | 1.48 (2.2) [0.04] | ||
| r(Na–BO) | 2.54 (1.4) | 2.47 (1.8) [0.19] | 2.47 (3.1) [0.19] | ||
| r(Na–NBO) | 2.30 (5.3) [0.19] | 2.35 (5.4) [0.21] | 2.38 (3.5) | ||
| r(Ca–BO) | 2.56 (0.6) [0.17] | −(0.4) | 2.41 (2.0) [0.16] | ||
| r(Ca–NBO) | 2.35 (6.6) [0.15] | 2.30 (6.2) [0.15] | 2.38 (4.5) [0.14] | ||
| P45C40N15 | r(P–BO) | 1.64 (1.8) [0.06] | 1.57 (1.8) [0.06] | 1.54 (1.8) [0.04] | |
| r(P–NBO) | 1.52 (2.2) [0.04] | 1.48 (2.2) [0.03] | 1.48 (2.2) [0.03] | ||
| r(Na–BO) | 2.46 (0.9) [0.20] | 2.56 (2.1) [0.20] | 2.35 (3.2) [0.18] | ||
| r(Na–NBO) | 2.34 (5.6) [0.15] | 2.38 (4.9) [0.18] | 2.35 (3.3) [0.18] | ||
| r(Ca–BO) | −(0.1) | −(0.7) | 2.44 (2.4) [0.18] | ||
| r(Ca–NBO) | 2.35 (7.1) [0.16] | 2.35 (6.5) [0.17] | 2.38 (4.2) [0.16] | ||
| P50C40N10 | r(P–BO) | 1.60 ± 0.02b,c | |||
| r(P–NBO) | 1.49 ± 0.02b,c | ||||
| r(Na–O) | 2.33 ± 0.02b,c | ||||
| r(Ca–O) | 2.34 ± 0.02b,c | ||||
The coordination environment of the modifiers Na and Ca is also described fairly accurately by the SM (see Table 8). In particular, for the sodium ion, the SM predicts a coordination shell of 7.0–7.4, slightly larger than in the ab initio glasses (6.4–6.5), whereas for the calcium ion the agreement is much closer: 6.8–6.9 from SM calculations, compared with 7.2 from AI simulations. Moreover, the SM correctly and quantitatively predicts that Na and Ca ions coordinate mostly to non-bonding oxygens, whereas the RI potential gives almost equal values of the M–BO and M–NBO coordination shells (M = Na or Ca).
As previously stated, Fig. 8 shows the Qn distribution evolution as a function of time for each methodology, using the same initial configurations and analogous simulation protocols. Results for both AIMD and classical SMMD methodologies show good agreement. For P45C40N15, the Q2 proportion from AIMD results increases from 40.1% in the 3000 K melt to 66.7% at 300 K, compared with 46.3% to 66.7% respectively using classical MD. Similar good agreement is shown for the temperature trends and absolute values of all other Qn species.
For simulations of bioactive phosphosilicate glasses and melts, Tilocca58 has shown that SM potentials also perform better than RI models in these systems. The correct description of the dynamical balance between the interconversion of Qn species during the cooling of a melt is achieved with SM as evaluated by higher level reference data.58
Finally, Table 9 reports a comparison of the distribution of the Qn species for the three compositions, both in the melt and in the glass, computed using the AI and SM models. The small samples considered in the present study clearly do not provide an exhaustive test of the accuracy of the SM potential to describe Qn abundances; however, they still provide an adequate representation of the local dynamics of the individual Qn species.58 Table 9 shows that for both melts and glasses, and for all three different compositions, the distribution obtained using the polarizable forcefield follows very closely the one obtained from ab initio calculations. These results therefore indicate that the full charge shell model interatomic potential that we have developed and used in this study is capable of modelling the structure of ternary phosphate systems both in the melt and in the amorphous state.
| Qn distribution | P coordination (%) | ||||||||||||
|---|---|---|---|---|---|---|---|---|---|---|---|---|---|
| Q0 | Q1 | Q2 | Q3 | Q4 | Q5 | NC | P2c | P3c | P4c | P5c | |||
| P45C30N25 | Melt (3000 K) | AI | 8.6 | 31.5 | 50.4 | 8.5 | 0.9 | 0.1 | 1.6 | 0.0 | 10.1 | 88.0 | 1.9 |
| SM | 5.4 | 28.6 | 50.8 | 13.6 | 1.5 | 0.1 | 1.8 | 0.0 | 7.1 | 88.1 | 4.8 | ||
| Glass (300 K) | AI | 5.6 | 22.2 | 61.1 | 11.1 | 0.0 | 0.0 | 1.8 | 0.0 | 0.0 | 100.0 | 0.0 | |
| SM | 0.0 | 33.3 | 55.6 | 11.1 | 0.0 | 0.0 | 1.8 | 0.0 | 0.0 | 100.1 | 0.0 | ||
| P45C35N20 | Melt (3000 K) | AI | 9.7 | 35.5 | 44.1 | 9.3 | 1.1 | 0.1 | 1.6 | 0.4 | 12.9 | 83.8 | 2.8 |
| SM | 5.6 | 32.0 | 49.0 | 12.1 | 1.2 | 0.1 | 1.7 | 0.0 | 7.6 | 88.2 | 4.2 | ||
| Glass (300 K) | AI | 0.0 | 22.2 | 77.8 | 0.0 | 0.0 | 0.0 | 1.8 | 0.0 | 0.0 | 100.0 | 0.0 | |
| SM | 0.0 | 21.8 | 77.8 | 0.4 | 0.0 | 0.0 | 1.8 | 0.0 | 0.0 | 99.6 | 0.4 | ||
| P45C40N15 | Melt (3000 K) | AI | 12.1 | 36.3 | 40.1 | 9.7 | 1.4 | 0.3 | 1.5 | 0.4 | 15.8 | 80.3 | 3.5 |
| SM | 5.7 | 31.7 | 46.3 | 14.8 | 1.4 | 0.1 | 1.7 | 0.0 | 7.7 | 87.3 | 4.8 | ||
| Glass (300 K) | AI | 0.0 | 27.8 | 66.7 | 5.6 | 0.0 | 0.0 | 1.8 | 0.0 | 0.0 | 100.0 | 0.0 | |
| SM | 0.0 | 27.5 | 66.7 | 5.8 | 0.0 | 0.0 | 1.8 | 0.0 | 0.0 | 88.7 | 0.3 | ||
Conclusions
The local and medium-range structures of ternary phosphate-based systems with composition (P2O5)0.45(CaO)x(Na2O)0.55−x (x = 0.30, 0.35 and 0.40), both in the melt and in the amorphous state, have been investigated using ab initio and classical molecular dynamics simulations. The structure of the glasses has been obtained using a full melt-and-quench procedure. The changes in the structural properties, as the 3000 K melt is cooled down at room temperature, have been compared extensively with that of the final glasses. The melts are characterized by a significant fraction of threefold (P3c) and fivefold (P5c) phosphorus atoms but structural defects rapidly decrease during the cooling phase. At temperatures lower than 1800 K, the system is free of under- and over-coordinated species. Structural analysis of the glasses at 300 K shows a prevalence of metaphosphate Q2 and pyrophosphate Q1 species, whereas the number of Q3 units, which constitute the three-dimensional phosphate network, significantly decreases with increased calcium content. Calculation of the pair and angular distribution functions suggests that the rigidity of the phosphate tetrahedral glass network increases with the concentration of calcium, an observation which is interpreted in terms of the tendency of the calcium ion to be a stronger coordinator than sodium.Moreover, because the AIMD quench from the melt allowed the full relaxation of the medium-range structure at the ab initio level, it provides us with a very accurate reference structure of the glass, which has been used to assess the quality of a formal charge shell model interatomic potential. The former has been parameterized from experimental and density functional theory calculations of structural and mechanical properties of crystalline o′(P2O5)∞. For all three compositions, our potential model gives good agreement with the ab initio data. In particular, the shell model simulates a value for the splitting between the P–BO and P–NBO distances (0.09–0.15 Å) very close to that obtained for the AI glasses (0.12–0.13 Å); the SM and AI glasses have similar intra-tetrahedral O–P–O angle distributions; the coordination shell of M–BO and M–NBO (M = Na or Ca) are in close agreement. On the other hand, the use of a standard rigid ion potential is unable to provide a satisfactorily accurate description of the local short-range structure and, as previously shown by Tilocca for soda-lime phosphosilicate systems,58 the inclusion of polarization in the interatomic potential is necessary in order to model multicomponent glasses.
Acknowledgements
D.D.T would like to thank the U.K.'s Royal Society for the award of a Royal Society Industry Fellowship. The authors would like to thank the Engineering and Physical Sciences Research Council (United Kingdom) EPSRC (GB) (Grant no. EP/J008095) for funding. Via our membership of the UK's HPC Materials Chemistry Consortium, which is funded by EPSRC (EP/F067496), this work made use of the facilities of HECToR, the UK's national high-performance computing service, which is provided by UoE HPCx Ltd at the University of Edinburgh, Cray Inc and NAG Ltd and funded by the Office of Science and Technology through EPSRC's High End Computing Programme.References
- L. L. Hench, Science, 1980, 208, 826–831 CAS.
- L. L. Hench and J. M. Polak, Science, 2002, 295, 1014–1017 CrossRef CAS.
- P. Saravanapavan, J. R. Jones, R. S. Pryce and L. L. Hench, J. Biomed. Mater. Res., Part A, 2003, 66, 110–119 Search PubMed.
- R. M. Day and A. R. Boccaccini, J. Biomed. Mater. Res., Part A, 2005, 73, 73–79 CrossRef.
- V. Salih, K. Franks, M. James, G. W. Hastings, J. C. Knowles and I. Olsen, J. Mater. Sci.: Mater. Med., 2000, 11, 615–620 CrossRef CAS.
- E. S. Tadjoedin, G. L. de Lange, P. J. Holzmann, L. Kuiper and E. H. Burger, Clin. Oral Impl. Res., 2000, 11, 334–344 CrossRef CAS.
- J. C. Knowles, J. Mater. Chem., 2003, 13, 2395–2401 RSC.
- E. A. Abou Neel, D. M. Pickup, S. P. Valappil, R. J. Newport and J. C. Knowles, J. Mater. Chem., 2009, 19, 690–701 RSC.
- I. Ahmed, M. Lewis, I. Olsen and J. C. Knowles, Biomaterials, 2004, 25, 491–499 CrossRef CAS.
- K. Franks, I. Abrahams and J. C. Knowles, J. Mater. Sci.: Mater. Med., 2000, 11, 609–614 CrossRef CAS.
- A. Tilocca, J. Mater. Chem., 2010, 20, 6848–6858 RSC.
- A. Tilocca, Proc. R. Soc. A, 2009, 465, 1003–1027 CrossRef CAS.
- G. Malavasi, A. Pedone and M. C. Menziani, J. Phys. Chem. B, 2013, 117, 4142–4150 CrossRef CAS.
- A. Tilocca and A. N. Cormack, J. Phys. Chem. B, 2007, 111, 14256–14264 CrossRef CAS.
- A. Pedone, G. Malavasi and M. C. Menziani, J. Phys. Chem. C, 2009, 113, 15723–15730 CAS.
- G. Lusvardi, G. Malavasi, F. Tarsitano, L. Menabue, M. C. Menziani and A. Pedone, J. Phys. Chem. B, 2009, 113, 10331–10338 CrossRef CAS.
- T. M. Alam, J. J. Liang and R. T. Cygan, Phys. Chem. Chem. Phys., 2000, 2, 4427–4432 RSC.
- B. Al-Hasni and G. Mountjoy, J. Non-Cryst. Solids, 2011, 357, 2775–2779 CrossRef CAS.
- E. B. Clark, R. N. Mead and G. Mountjoy, J. Phys.: Condens. Matter, 2006, 18, 6815–6826 CrossRef CAS.
- D. Donadio, M. Bernasconi and F. Tassone, Phys. Rev. B: Condens. Matter Mater. Phys., 2004, 70, 214205 CrossRef.
- R. A. Martin, G. Mountjoy and R. J. Newport, J. Phys.: Condens. Matter, 2009, 21, 075102–075109 CrossRef.
- E. Sourial, T. Peres, J. A. Capobianco, A. Speghini and M. Bettinelli, Phys. Chem. Chem. Phys., 1999, 1, 2013–2018 RSC.
- A. Speghini, E. Sourial, T. Peres, G. Pinna, M. Bettinelli and J. A. Capobianco, Phys. Chem. Chem. Phys., 1999, 1, 173–177 RSC.
- Y. Suzuki, K. Takase, I. Akiyama, K. Suzuya, N. Umesaki and N. Ohtori, Mater. Trans., 2001, 42, 2242–2246 CrossRef CAS.
- G. G. Boiko, N. S. Andreev and A. V. Parkachev, J. Non-Cryst. Solids, 1998, 238, 175–185 CrossRef CAS.
- R. I. Ainsworth, D. Di Tommaso, J. K. Christie and N. H. de Leeuw, J. Chem. Phys., 2012, 137, 234502 CrossRef.
- R. Iftimie, P. Minary and M. E. Tuckerman, Proc. Natl. Acad. Sci. U. S. A., 2005, 102, 6654–6659 CrossRef CAS.
- R. Car and M. Parrinello, Phys. Rev. Lett., 1985, 55, 2471–2474 CrossRef CAS.
- X. J. Wang, H. Y. Xiao, X. T. Zu, Y. Zhang and W. J. Weber, J. Mater. Chem. C, 2013, 1, 1665–1673 RSC.
- C. Cazorla, V. Rojas-Cervellera and C. Rovira, J. Mater. Chem., 2012, 22, 19684–19693 RSC.
- A. Tilocca and A. N. Cormack, Proc. R. Soc. A, 2011, 467, 2102–2111 CrossRef CAS.
- J. K. Christie, A. Pedone, M. C. Menziani and A. Tilocca, J. Phys. Chem. B, 2011, 115, 2038–2045 CrossRef CAS.
- A. Tilocca and N. H. de Leeuw, J. Phys. Chem. B, 2006, 110, 25810–25816 CrossRef CAS.
- A. Tilocca and N. H. de Leeuw, J. Mater. Chem., 2006, 16, 1950–1955 RSC.
- A. J. Parsons, I. Ahmed, C. D. Rudd, G. J. Cuello, E. Pellegrini, D. Richard and M. R. Johnson, J. Phys.: Condens. Matter, 2010, 22, 485403–485411 CrossRef CAS.
- S. Ispas, M. Benoit, P. Jund and R. Jullien, Phys. Rev. B: Condens. Matter Mater. Phys., 2001, 6421, 214206–214215 CrossRef.
- A. Tilocca, Phys. Rev. B: Condens. Matter Mater. Phys., 2007, 76, 224202 CrossRef.
- A. Pedone, T. Charpentier and M. C. Menziani, J. Mater. Chem., 2012, 22, 12599–12608 RSC.
- P. Giannozzi, S. Baroni, N. Bonini, M. Calandra, R. Car, C. Cavazzoni, D. Ceresoli, G. L. Chiarotti, M. Cococcioni, I. Dabo, A. Dal Corso, S. de Gironcoli, S. Fabris, G. Fratesi, R. Gebauer, U. Gerstmann, C. Gougoussis, A. Kokalj, M. Lazzeri, L. Martin-Samos, N. Marzari, F. Mauri, R. Mazzarello, S. Paolini, A. Pasquarello, L. Paulatto, C. Sbraccia, S. Scandolo, G. Sclauzero, A. P. Seitsonen, A. Smogunov, P. Umari and R. M. Wentzcovitch, J. Phys.: Condens. Matter, 2009, 21, 395502–395521 CrossRef.
- J. P. Perdew, K. Burke and M. Ernzerhof, Phys. Rev. Lett., 1996, 77, 3865–3868 CrossRef CAS.
- D. Vanderbilt, Phys. Rev. B: Condens. Matter Mater. Phys., 1990, 41, 7892–7895 CrossRef.
- K. Laasonen, R. Car, C. Lee and D. Vanderbilt, Phys. Rev. B: Condens. Matter Mater. Phys., 1991, 43, 6796–6799 CrossRef CAS.
- G. J. Martyna, M. L. Klein and M. Tuckerman, J. Chem. Phys., 1992, 97, 2635–2643 CrossRef.
- J. Sarnthein, A. Pasquarello and R. Car, Science, 1997, 275, 1925–1927 CrossRef CAS.
- M. Benoit, S. Ispas and M. E. Tuckerman, Phys. Rev. B: Condens. Matter Mater. Phys., 2001, 64, 224205 CrossRef.
- W. Smith and T. R. Forester, J. Mol. Graphics, 1996, 14, 136–141 CrossRef CAS.
- D. J. Evans and G. P. Morriss, Comput. Phys. Rep., 1984, 1, 297–343 CrossRef CAS.
- D. Stachel, I. Svoboda and H. Fuess, Acta Crystallogr., Sect. C: Cryst. Struct. Commun., 1995, 51, 1049–1050 CrossRef.
- R. I. Ainsworth, D. Di Tommaso and N. H. de Leeuw, J. Chem. Phys., 2011, 135, 234513 CrossRef.
- A. Tilocca, N. H. de Leeuw and A. N. Cormack, Phys. Rev. B: Condens. Matter Mater. Phys., 2006, 73, 104209 CrossRef.
- R. M. Van Ginhoven, H. Jonsson and L. R. Corrales, Phys. Rev. B: Condens. Matter Mater. Phys., 2005, 71, 24208–24223 CrossRef.
- D. Carta, D. M. Pickup, J. C. Knowles, I. Ahmed, M. E. Smith and R. J. Newport, J. Non-Cryst. Solids, 2007, 353, 1759–1765 CrossRef CAS.
- T. Ikeda, M. Boero and K. Terakura, J. Chem. Phys., 2007, 127, 74503–74511 CrossRef.
- T. Ikeda, M. Boero and K. Terakura, J. Chem. Phys., 2007, 126, 34501–34510 CrossRef.
- J. A. White, E. Schwegler, G. Galli and F. Gygi, J. Chem. Phys., 2000, 113, 4668–4673 CrossRef CAS.
- G. Walter, J. Vogel, U. Hoppe and P. Hartmann, J. Non-Cryst. Solids, 2001, 296, 212–223 CrossRef CAS.
- K. Suzuki and M. Ueno, J. Phys., 1985, 46, 261–265 Search PubMed.
- A. Tilocca, J. Chem. Phys., 2008, 129, 084504 CrossRef.
| This journal is © The Royal Society of Chemistry 2013 |


