 Open Access Article
Creative Commons Attribution 3.0 Unported Licence
(Oligo)mannose functionalized hydroxyethyl starch nanocapsules: en route to drug delivery systems with targeting properties†
Hélène
Freichels‡
a,
Manfred
Wagner
a,
Patricia
Okwieka
ab,
Ralf Georg
Meyer
b,
Volker
Mailänder
ab,
Katharina
Landfester
a and
Anna
Musyanovych
*a
aMax Planck Institute for Polymer Research, Ackermannweg 10, 55128 Mainz, Germany. E-mail: musyanov@mpip-mainz.mpg.de; Fax: +49 (0)6131-379100; Tel: +49 (0)6131-379248
bDepartment of Hematology, Medical Oncology, and Pneumology, University Medical Center Mainz, Langenbeckstr. 1, 55131 Mainz, Germany
First published on 26th June 2013
Abstract
Hydroxyethyl starch nanocapsules (NCs) are potentially interesting hydrophilic drug delivery carriers, since they do not show non-specific interactions with the living cells. Only the presence of a targeting agent on their surface allows them to target specifically the desired site of action. In this paper, we report the synthesis and cell uptake of crosslinked hydroxyethyl starch (HES) NCs decorated with (oligo)mannose, which is an effective targeting agent for macrophage and dendritic cells. The crosslinked HES NCs were prepared via the interfacial polyaddition of HES with 2,4-toluene diisocyanate (TDI) in inverse (water-in-oil) miniemulsion and then functionalized with (oligo)mannose following two different strategies. To compare the activity and availability of a targeting agent, different types of mannose molecules such as α-D-mannopyranosylphenyl isothiocyanate, 3-O-(α-D-mannopyranosyl)-D-mannose and α3,α6-mannotriose were used for the functionalization of NCs. The availability of the mannose was unambiguously assessed by interaction with a fluorescent lectin. Moreover, the accessibility of the pilot molecule was improved by the presence of a PEG linker at the surface of the NCs. To simulate in vivo conditions, where proteins interact with nanoparticles with a possible hindrance of the accessibility to the targeting agent, the mannosylated NCs were first incubated with human serum before interaction with the fluorescent lectin. Enhancement of uptake into dendritic cells demonstrates the targeting ability in in vitro studies.
Introduction
Mannosylated nanocarriers that are able to transport hydrophilic drugs like nucleic acids, peptides or proteins have received considerable attention for medical purposes including vaccination, and treatment of inflammatory and bacterial infectious diseases by targeting specifically macrophages1 and dendritic cells (DCs).2–4 In this area, several systems were described: liposomes,5–8 polyester nanoparticles (NPs),9–12 polyanhydride NPs,13 gelatin NPs,14,15 pH-sensitive dextran nanoparticles,16 and chitosan based complexes.17–19Although many different kinds of carriers decorated with mannose are described in the literature, until now there have been no reports that describe the synthesis of nanocapsules (NCs) having covalently attached mannose residues. NCs consist of an aqueous core surrounded by a thin protective polymeric shell and are very promising carriers, since they possess a high loading efficiency. Additionally, the drug is protected inside the core avoiding degradation, leakage and/or rapid release of the drug. In order to obtain targeting nanocarriers, non-specific interaction and uptake of the nanoparticles into non-target cells have to be minimized; only then the specificity to the target tissue or cell type can be achieved by the molecules (or ligands) that are attached to the nanocarrier and they can interact specifically with the target structures in tissue.
Hydroxyethyl starch (HES) is a hydroxyethylated glucose polymer. As a medical agent HES improves the transport of oxygen to all organs of the body, maintains the normal blood pressure/volume and is widely used for treatment of hypovolemia. The enzymatic degradation of HES is reduced with increasing molar substitution (MS).
Until now only a few studies have been published describing the formulation of HES capsules. For example, HES microcapsules with encapsulated bovine serum albumin (BSA) were synthesized by crosslinking with terephthaloyl chloride at the emulsion droplet interface.20 The release of BSA from the obtained microcapsules upon enzymatic degradation was studied in vivo (after intraperitoneal application) and in vitro (using melanoma cells). The use of a miniemulsion approach makes it possible to benefit from the reduced size of the obtained nanocapsules (below 300 nm).21,22 Furthermore, it was shown that NCs composed of HES are very promising nanocarriers as they are biocompatible23 and do not show any non-specific cellular interactions.24
In the present work, two strategies for the synthesis of crosslinked HES NCs functionalized with different mannose molecules, namely α-D-mannopyranosylphenyl isothiocyanate (ITC-Man), 3-O-(α-D-mannopyranosyl)-D-mannose (di-Man), and α3,α6-mannotriose (tri-Man), were developed. The HES NCs were prepared by interfacial crosslinking of HES with 2,4-toluene diisocyanate (TDI) in inverse miniemulsion (Scheme 1). After the synthesis, some amount of non-reacted isocyanate groups remain on the surface of capsules and are converted into amine groups after redispersion of the capsules in water, as was shown for starch24,25 and polyurethane26 NCs. These amine groups can be used for further functionalization of NCs, e.g., introduction of a PEG linker via a glutaraldehyde linkage,27,28 to improve the accessibility of the targeting unit (Scheme 2). In this paper, two different approaches for conjugation of HES NCs are developed (Scheme 3). Amine groups on the surface of NCs were reacted either directly with the isothiocyanate group (ITC-Man) or through reductive amination (di-Man and tri-Man). The access and specificity of mannose residues was studied by their interaction with the fluorescence-labeled lectin, Galanthus nivalis agglutinin (GNA-FITC), which is known for its specific interaction with mannose.29 The studies described herein provide the evidence that mannose-functionalized HES NCs possess promising future for targeted delivery to dendritic cells.
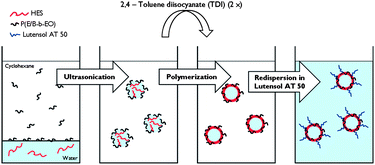 | ||
| Scheme 1 A schematic representation of the procedure for the synthesis of crosslinked HES NCs in an inverse miniemulsion and transfer of NCs from cyclohexane into the water phase. | ||
 | ||
| Scheme 2 Introduction of a PEG linker onto the surface of NCs. | ||
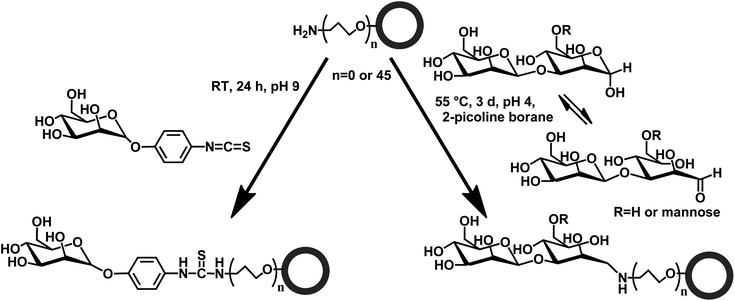 | ||
| Scheme 3 Functionalization of nanocapsules with α-D-mannopyranosyl-phenyl isothiocyanate (ITC-Man), 3-O-(α-D-mannopyranosyl)-D-mannose (di-Man) and α3,α6-mannotriose (tri-Man). | ||
Experimental section
Materials
Hydroxyethyl starch, HES (10 wt% solution with 154 mM NaCl, Mw = 200![[thin space (1/6-em)]](https://www.rsc.org/images/entities/char_2009.gif) 000 g mol−1, DS = 0.40, MS = 0.45), was purchased from Fresenius Kabi. The synthesis of HES starts from the hydrolysis of corn starch (consists of amylopectin), followed by the hydroxyethylation reaction and ultrafiltration to get a fraction with exact molecular weight. Tolylene 2,4-diisocyanate, TDI (Sigma, > 98%), cyclohexane (Sigma-Aldrich, > 99%), fluoresceinisothiocyanate (FITC) (Fluka, > 90%), α-D-mannopyranosylphenyl isothiocyanate (ITC-Man) (Sigma), DMSO (Sigma-Aldrich, 99.9%), GNA-FITC (Linaris), phenol (Acros Organics, 99+%), sulfuric acid (Sigma-Aldrich, 95–97%), 1,6-hexanediol (Sigma-Aldrich, 99%), 3-O-(α-D-mannopyranosyl)-D-mannose (di-Man) (Carbosynth Limited), α3,α6-mannotriose (tri-Man) (Carbosynth Limited), 2-picoline borane (Sigma-Aldrich), citric acid (Sigma-Aldrich), mannose (Fluka), PEG bis(amine) Mw = 2000 g mol−1 (Aldrich), glutaraldehyde (25% solution, Serva GmbH), anthranilic acid (Acros Organic), and D-[1,2-13C2] mannose (Omicron Biochemicals, Inc) were used as received. Human serum (HS, 69 g mol−1) was collected from healthy blood donors. The lipophilic block copolymer poly[(ethylene-co-butylene)-b-(ethylene oxide)], P(E/B-b-EO), consisting of a poly(ethylene-co-butylene) block (Mw = 3700 g mol−1) and a poly(ethylene oxide) block (Mw = 3600 g mol−1), was synthesized starting from ω-hydroxypoly(ethylene-co-butylene), which was dissolved in toluene, by adding ethylene oxide under the typical conditions of anionic polymerization.30,31 The non-ionic surfactant Lutensol AT50, which is a poly(ethylene oxide)-hexadecyl ether with an ethylene oxide (EO) block length of about 50 units, was a gift from BASF. MilliQ water was used throughout the work.
000 g mol−1, DS = 0.40, MS = 0.45), was purchased from Fresenius Kabi. The synthesis of HES starts from the hydrolysis of corn starch (consists of amylopectin), followed by the hydroxyethylation reaction and ultrafiltration to get a fraction with exact molecular weight. Tolylene 2,4-diisocyanate, TDI (Sigma, > 98%), cyclohexane (Sigma-Aldrich, > 99%), fluoresceinisothiocyanate (FITC) (Fluka, > 90%), α-D-mannopyranosylphenyl isothiocyanate (ITC-Man) (Sigma), DMSO (Sigma-Aldrich, 99.9%), GNA-FITC (Linaris), phenol (Acros Organics, 99+%), sulfuric acid (Sigma-Aldrich, 95–97%), 1,6-hexanediol (Sigma-Aldrich, 99%), 3-O-(α-D-mannopyranosyl)-D-mannose (di-Man) (Carbosynth Limited), α3,α6-mannotriose (tri-Man) (Carbosynth Limited), 2-picoline borane (Sigma-Aldrich), citric acid (Sigma-Aldrich), mannose (Fluka), PEG bis(amine) Mw = 2000 g mol−1 (Aldrich), glutaraldehyde (25% solution, Serva GmbH), anthranilic acid (Acros Organic), and D-[1,2-13C2] mannose (Omicron Biochemicals, Inc) were used as received. Human serum (HS, 69 g mol−1) was collected from healthy blood donors. The lipophilic block copolymer poly[(ethylene-co-butylene)-b-(ethylene oxide)], P(E/B-b-EO), consisting of a poly(ethylene-co-butylene) block (Mw = 3700 g mol−1) and a poly(ethylene oxide) block (Mw = 3600 g mol−1), was synthesized starting from ω-hydroxypoly(ethylene-co-butylene), which was dissolved in toluene, by adding ethylene oxide under the typical conditions of anionic polymerization.30,31 The non-ionic surfactant Lutensol AT50, which is a poly(ethylene oxide)-hexadecyl ether with an ethylene oxide (EO) block length of about 50 units, was a gift from BASF. MilliQ water was used throughout the work.
Preparation of NCs
The HES and PU NCs were prepared as previously reported.24–26 Briefly, for HES NCs: 1.4 g of HES solution (10 wt%) was mixed with 7.5 g of cyclohexane containing 100 mg of P(E/B-b-EO). For the synthesis of PU NCs the dispersed phase consisting of 0.07 g of 1,6-hexanediol, 0.015 g of sodium chloride and 1.2 g of MilliQ water was mixed with 7.5 g of cyclohexane containing 100 mg of P(E/B-b-EO). The obtained mixture (in both cases of NCs) was stirred over 1 h at 25 °C and then sonicated for 180 s at 70% amplitude in a pulse regime (20 s sonication, 10 s pause) using a Branson Sonifier W450-Digital and a 1/2′′ tip. The sonication was performed under ice cooling in order to prevent evaporation of the solvent. A solution consisting of 5 g of cyclohexane, 30 mg of P(E/B-b-EO), and 100 mg of TDI was prepared and added dropwise over 5 min to the obtained miniemulsion at room temperature. The mixture was stirred overnight and after that it was purified twice by centrifugation/redispersion in cyclohexane at 4000 rpm for 20 min. Then, 10−3 mol of TDI per g of NCs (solid content 0.6 wt%) were added dropwise to the dispersion and stirred at room temperature overnight. The NCs were purified twice by centrifugation at 4000 rpm for 20 min and redispersed in cyclohexane. To transfer the capsules to an aqueous medium, the following procedure was used: 0.15 mL of NCs in cyclohexane (solid content 0.8 wt%) were slowly added to 2.5 mL of 0.1 wt% of Lutensol AT50 in an ultrasonication bath and kept for 3 min. Then the dispersion was sonicated for 1 min at 10% amplitude in a pulse regime (5 s pulse, 5 s pause). The NC dispersion was stirred in an open vial overnight at 25 °C in order to evaporate the cyclohexane.Quantification of amine groups
The concentration of amine groups on the surface of NCs was determined by conductometric and fluorescence titrations. For conductometric titration, the excess amount of 0.1 M HCl aqueous solution was added to the aqueous dispersion of HES (or PU) NCs with a solid content of 0.25 wt%. After 20 min of stirring, the titration was started by slow addition of the standard 0.1 M NaOH solution to NC dispersion using a Titronic universal unit (SCHOTT Instruments GmbH). The conductivity measurements were performed at 22 °C in the pH range from 2.5 to 12.5. The amount of amine groups per gram of capsules was calculated from the conductivity curve as a function of consumed NaOH solution. The fluorescence titration method was based on the reaction of fluorescamine with primary amine groups, yielding a highly fluorescent product.27,32 The amount of amine groups was measured directly on the HES NCs. The calibration curve (Fig. S2†) was obtained by mixing known concentrations of hexylamine and polystyrene particles (240 nm in diameter), stabilized by the same amount of Lutensol AT50 as HES NCs. Polystyrene nanoparticles were used in order to have the same turbidity in the calibration sample as it is in the measured samples of HES NCs, thus avoiding the error in the obtained values due to the light scattering caused by the presence of NCs. The concentration (number) of polystyrene particles in the calibration samples was adjusted to the concentration (number) of NCs used in the analysed sample. Briefly, 0.1 mL of NC dispersion (solid content 0.15 wt%) was mixed with 2.9 mL of borate buffer (0.1 M, pH 9.2) and then 1 mL of fluorescamine solution (0.3 g L−1 in acetone) was added. The excitation wavelength was 410 nm, and the emission was measured at a wavelength of 470 nm.Functionalization of NCs with a PEG bis(amine) linker (Mw = 2000 g mol−1) (Scheme 2)
The dispersion of NCs was dialyzed for 2 h against PBS pH 7.4 containing 0.1 wt% Lutensol AT50. Then 20 eq. of glutaraldehyde (with respect to the amount of amine groups on NCs) was added and the dispersion was stirred for 4 h at room temperature. The capsules were purified from the non-reacted glutaraldehyde through dialysis against Lutensol AT50 (0.1 wt%) aqueous solution (2 days) and subsequently with PBS containing Lutensol AT50 (0.1 wt%) (2 h). The dispersion was diluted twice, then 50 eq. of PEG bis(amine) (with respect to the amount of amine groups on NCs) and 50 eq. of 2-picoline borane, dissolved in DMSO, were added and the dispersion was stirred for 16 h before purification by dialysis against Lutesol AT50 solution (0.1 wt%).Functionalization of NCs with fluoresceinisothiocyanate (FITC) and α-D-mannopyranosylphenyl isothiocyanate (ITC-Man)
The NCs were dialyzed for 13 h against 0.1 M carbonate buffer (pH 9), containing 0.1 wt% of Lutensol AT50. Then, 10 eq. of isothiocyanate molecules (with respect to the amount of amine groups on NCs), dissolved in DMSO (maximum of 5% of DMSO in the reaction mixture), were added. After 20 h of reaction, NCs were purified by dialysis against Lutensol AT50 solution (0.1 wt%). FITC-functionalized NCs were used for the calculation of the functionalization yield. After synthesis, FITC-functionalized NCs were centrifuged and the amount of non-reacted FITC was determined by fluorescence spectroscopy. The excitation wavelength was 490 nm, and the emission was measured at 525 nm.Functionalization of NCs with 3-O-(α-D-mannopyranosyl)-D-mannose (di-Man) and α3,α6-mannotriose (tri-Man)
50 mg of citric acid per g of NC dispersion (0.15 wt%) was added to NC dispersion. Then, the pH was adjusted to pH 4 with 1 N NaOH and 2 eq. of carbohydrate dissolved in water and 20 eq. of 2-picoline borane (dissolved in DMSO, with respect to the amount of amine groups on NCs) were added. The reaction mixture was stirred at 55 °C for 3 days, and 20 eq. of 2-picoline borane were added every 12 h. The NCs were purified by dialysis against Lutensol AT50 0.1 wt%.Quantification of mannose on the surface of NCs
The phenol–sulfuric acid colorimetric assay is known to be very sensitive to quantify the amount of carbohydrate.33 However, in the presence of phenol–sulfuric acid, both HES (shell of NCs) and mannose will undergo similar reactions and lead to the formation of furan derivatives. Therefore HES NCs, which were treated in the same way as mannose functionalized HES NCs, but without addition of the mannose derivative, were used as a reference sample.In addition, polyurethane (PU) NCs were synthesized and used as the second reference NCs for the mannose quantification. The amount of sugar was determined by measuring the absorbance at 486 nm and using the calibration curve obtained with a known amount of mannose or 3-O-(α-D-mannopyranosyl)-D-mannose (di-Man). In the case of HES NCs the value was calculated as a difference between the values obtained for the mannosylated and non-mannosylated HES NCs. The absorbance value of the colorimetric assay performed on PU NCs, which were treated under the same conditions, but without the addition of mannose derivatives, was negative (−3.36 × 10⁻⁷ mol g−1 NCs) thus indicating that PU NCs do not contribute to any absorption under the working coupling conditions.
Briefly, 0.5 mL of 5% aqueous phenol solution and 2.5 mL of concentrated sulfuric acid were rapidly added to 0.5 mL of redispersed NCs (0.15 wt%). The vial was allowed to stand for 10 min at room temperature, before it was vigorously shaken and placed in a water bath at 23 °C for 20 min before measuring the absorbance at 486 nm.
Specific interaction of mannose with fluorescence-labeled Galanthus nivalis agglutinin (GNA-FITC)
The access and specificity of mannose on the surface of NCs was studied with fluorescence-labeled Galanthus nivalis agglutinin (GNA-FITC). 30 μL of GNA-FITC in HEPES buffer (0.25 mg mL−1) were added to 400 μL of HES NCs (0.1 wt%) in HEPES buffer (0.1 M, pH 7.5). The dispersion was stirred at room temperature in the dark for 3 h and then overnight at +4 °C. The separation of non-reacted GNA-FITC was done by centrifugation at 4000 rpm for 20 min at 15 °C. After centrifugation, the supernatant was replaced by the HEPES buffer and the capsules were redispersed using vortex. The fluorescence intensity of the supernatant was measured at 520 nm after excitation at 494 nm. For the experiment in the presence of HS, 400 μL of HES NC dispersion were incubated with 50 μL of HS (69 g L−1) for 1 h at 37 °C before interaction with GNA-FITC.Characterization
The size and size distribution of NCs were measured by dynamic light scattering (DLS) using a Nicomp particle sizer (model 370, PSS Santa Barbara, CA, USA) at a fixed scattering angle of 90° at 23 °C. The zeta potential was measured using a Zeta Nanosizer (Malvern Instruments) at 23 °C. The samples were diluted in 10−3 M KCl. The morphology of the capsules was studied by scanning electron microscopy (SEM) and transmission electron microscopy (TEM). One droplet of the diluted sample (solid content about 0.01 wt%) was placed onto a silica wafer (for SEM) or onto a 300 carbon-coated copper mesh (for TEM) and dried under ambient conditions. SEM images were recorded using a field emission scanning electron microscope LEO GEMINI 1530 at an acceleration voltage of 0.1 kV. TEM studies were carried out with a Philips EM400 electron microscope operating at an acceleration voltage of 80 kV. UV-visible absorbance and fluorescence measurements were performed using a M1000 multimode Plate reader (Tecan GmbH) controlled via i-Control software (Tecan GmbH, version 1.6.19.2). 13C-NMR spectra of the chemicals dissolved in D2O were obtained on an AVANCE 500 MHz Bruker. The 13C-NMR experiments were performed with a 5 mm BBFO z-gradient probe on the 500 MHz system. The quantitative 13C-NMR studies were carried out with an external reference compound (4,4-dimethyl-4-silapentane-1-sulfonic acid (DSS) in D2O) in a special tube (diameter 1.3 mm in the centre of a 5 mm tube). The temperature during the measurements (298.3 K or 353 K) was defined with a standard 1H methanol or glycol NMR sample. The control of the temperature was realized with a VTU (variable temperature unit) and an accuracy of ± 0.1 K, which was checked with the standard Bruker Topspin 2.1 software. The spectra were obtained with π/2-pulse lengths of 13 μs (13C) and a sweep width of 220 ppm for 13C. A relaxation delay of 3 s was chosen for the 13C experiment and the used pulse program for quantitative spectra was inverse gated decoupling. The relaxation time (T1) of the labeled carbons that is equal to 1.01 s in the mannose derivative was measured with the inversion recovery method and the Carr–Purcell–Meiboom–Gill (CPMG) method was used to determine the relaxation time (T2). Carbon spectra were referenced using DSS as a standard at 0 ppm. The 13C-NMR study of the reductive amination between model compounds was realized as follows: anthranilic acid (0.5 mg, 3.8 × 10⁻³ mmol) was added to a solution of citric acid (25 mg in 500 μL of D2O adjusted to pH 4 with 1 N NaOH), followed by 10 μL of 140 mg mL−1 D2O 13C labeled mannose (2 eq., 7.7 × 10⁻³ mmol, 1.4 mg) and 100 μL of 83 mg mL−1 2-picoline borane in DMSO (77.7 × 10⁻³ mmol, 8.3 mg, 20 eq.).Generation of immature dendritic cells (iDCs)
Peripheral blood mononuclear cells (PBMCs) were purified from healthy human donor buffy coats by standard Ficoll separation. Donor blood was obtained according to the declaration of Helsinki. Immature DCs (iDCs) were derived from monocytes selected by plastic adherence. 1.5 × 10⁷ PBMCs were seeded in one well of a 6-well plate and allowed to adhere in a humidified environment at 37 °C with 5% CO2 for 1 h in 3 mL of DC-medium (RMPI with 2% heat-inactivated pooled human serum (HS), 100 U mL−1 streptomycin (Sigma)). Non-adhering cells were removed by washing three times with phosphate buffered saline (PBS, Invitrogen). Monocytes were cultured for two days in DC-medium containing 800 U mL−1 granulocyte/macrophage-colony stimulating factor (GM-CSF, Genzyme) and 500 U mL−1 interleukin (IL)-4 (PromoKine) at 37 °C/5% CO2. The medium was replaced by DC-medium supplemented with 1600 U mL−1 GM-CSF and 1000 U mL−1 IL-4 on days 3 and 5. The cells were harvested on day 6 by incubation with PBS/EDTA (2 mM) for 10 min at 37 °C and subsequent washing with cold PBS. For treatment with nanocapsules, cryopreserved iDCs were thawed in DC medium.Loading of iDCs with nanocapsules
1.5 × 10⁵ iDCs were seeded per well of a 48-well plate containing 1 mL of DC-Medium with 1600 U mL−1 GM-CSF and 500 U mL−1 IL-4. After 1 h of incubation at 37 °C, 300 μg mL−1 of each nanocapsule were added per well. Cells were incubated with nanocapsules for 16 h at 37 °C/5% CO2. Afterwards the nanocapsule containing medium was discarded and the cells were washed two times with pre-warmed DC-medium. Finally iDCs were harvested by multiple washing with cold PBS.Analysis of nanocapsule-uptake by flow cytometry
Flow cytometry was performed using a LSR-Fortessa FACS analyzer equipped with FACSDivaTM software (both Becton Dickinson). The fluorescence intensity of nanocapsules carrying the dye SR101 was measured using a 586/15 nm bandpass filter with excitation by a 100 mW/561 nm laser. iDCs were stained with a FITC-conjugated monoclonal antibody against CD11c (Miltenyi Biotec), a DC specific expression marker and measured with a 530/30 nm bandpass filter with excitation by a 100 mW/488 nm laser. NC uptake was assessed by using FlowJo 7.6.5 (Tree Star Inc.).Confocal laser scanning microscopy (CLSM) of NC loaded iDCs
To confirm binding and intracellular localization of NCs in iDCs, a Zeiss LSM 710-UV confocal laser scanning microscope equipped with Zeiss LSM Image Examiner software (Version 3.2.0.115, both Carl Zeiss) was used. iDCs were loaded and incubated with NCs as described above. The cytoplasm of the cells was stained using CellTracker™ Green CMFDA (Life Technologies) and the nucleus was stained with DRAQ-5 (New England Biolabs). About 105 DCs were resuspended in PBS and transferred onto a Lab-Tek 8-well chamber slide (Thermo Fisher Scientific).Results and discussion
Preparation and characterization of functionalized HES NCs
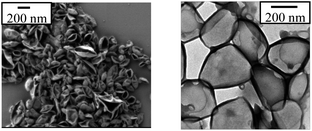
HES-based NCs were prepared via an interfacial polyaddition reaction in inverse miniemulsion (Scheme 1) as previously described.26 The aqueous dispersed phase consisted of HES solution and the continuous phase consisted of cyclohexane with the oil-soluble block copolymer surfactant [P(B/E-b-EO)]. Miniemulsification by ultrasonication led to the formation of nanosized kinetically stable droplets. The addition of TDI allowed the reaction of the hydroxyl group from HES molecules with the isocyanate groups from TDI, and results in the formation of a crosslinked polymeric shell. The obtained nanoparticulates have the core–shell structure: water surrounded by the crosslinked HES. SEM and TEM studies performed on the NC dispersion reveal the core–shell morphology (Fig. 1). The shell thickness was measured to be in the range between 10 and 20 nm.After the synthesis and thesecond addition of TDI (to increase the content of the amine groups on the NC surface), the capsules were redispersed in a nonionic surfactant solution (Lutensol AT50 0.1 wt%). The hydrodynamic average sizes of the NCs after different reaction steps are shown in Fig. 2. As model NCs for the coupling studies of different mannose molecules, PU NCs were synthesized and characterized as well.
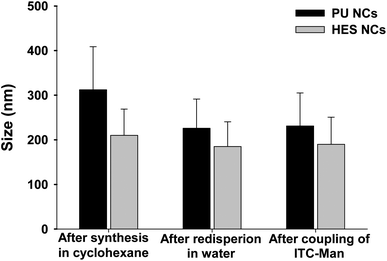 | ||
| Fig. 2 Average hydrodynamic diameter of PU and HES NCs after different reaction steps. | ||
The amount of amine groups present on the surface of NCs was determined by two different methods, i.e. conductometric and fluorescent titrations.
The conductometric titration was performed by adding an excess of hydrochloric acid in order to protonate the entire amine groups and follow the conductivity after each addition of sodium hydroxide. From the titration curves (Fig. S1†) and the solid content of NCs, the amount of amine groups on the surface of NCs was calculated for both types of NCs (Table 1). The fluorescent titration also allows the determination of the amine content. In this method, fluorescamine reacts with the amine group to form a highly fluorescent compound.27,32
A comparison of the fluorescence intensity of the NC sample with a calibration curve permits the quantification of amine groups on the NC surface (Table 1). From the obtained results it could be seen that the amounts of amine groups determined by conductometric titration are higher than those obtained from the fluorescent titration. On one hand, this might be due to the difference in size of the reagents. The size of fluorescamine molecules is bigger as compared to the size of Na+ ions, and therefore the ions can reach more amine groups than fluorescamine. On the other hand, it could be also due to quenching of the fluorescence (after reaction with the fluorescamine) when the amine groups are placed very near to each other.
Functionalization of NCs with a PEG-bis(amine) linker
The functionalization of the NC surface with a PEG linker was realized in a two-step strategy (Scheme 2). In the first step, the amine group was reacted with glutaraldehyde to form a Schiff base. In the second step, PEG-bis(amine) (Mw = 2000 g mol−1) was reacted with the aldehyde group by reductive amination to give NCs with a PEG linker possessing an amine group at the end of the molecule. As the chemicals used are bifunctional, crosslinking between NCs was avoided by adding an excess of glutaraldehyde (20 times) and PEG-bis(amine) (50 times). Indeed, the DLS measurements did not indicate the presence of aggregates of NCs after modification. Moreover, as expected, a slight increase of the size was observed by DLS after coupling of PEG-bis(amine) (185 and 200 nm before and after coupling, respectively). The amount of surface amine groups remaining after each step was determined by fluorescent titration. This test revealed the disappearance of amine groups after reaction with glutaraldehyde. Subsequently, about 83% of the initial amount of the amine groups were determined after reaction with PEG bis(amine). We assume that the residual 17% are not detectable due to the possible reaction of PEG bis(amine) with both ends, thus resulting in loop formation.Functionalization of NCs with fluorescein isothiocyanate (FITC) and α-D-mannopyranosylphenyl isothiocyanate (ITC-Man)
As isothiocyanate reacts directly with amine groups, the amine groups at the surface of NCs were used to react with commercially available mannose isothiocyanate (ITC-Man) (Scheme 3). For characterization and quantification, fluorescein isothiocyanate (FITC) was chosen as a model molecule for the coupling on PU (used as a reference sample) and HES NCs, that was realized in a 0.1 M carbonate buffer with 10 eq. of FITC in a DMSO solution (5% volume with respect to the water volume). After reaction the NC dispersion was centrifuged and the amount of non-reacted FITC was determined in the supernatant by fluorescence spectroscopy. For both kinds of NCs, the amount of coupled FITC is similar to the amount of amine groups on the surface (Table 2), meaning that all amine groups are accessible for the reaction with FITC. Moreover, the chosen conditions are mild enough to avoid the degradation or aggregation of NCs, as proved by DLS measurements (Fig. 1). In fact, the size, i.e., 231 and 185 nm for PU and HES NCs respectively, remains similar after the reaction.| HES NCs | PU NCs | |||||
|---|---|---|---|---|---|---|
| FITC | ITC-Man | PEG + ITC-Man | FITC | ITC-Man | PEG + ITC-Man | |
| Mol of molecules per g NCs (10−5) | 1.78 | 1.42 | 0.81 | 1.44 | 1.53 | 1.17 |
| Molecules per NC | 87![[thin space (1/6-em)]](https://www.rsc.org/images/entities/char_2009.gif) 000 000 |
68![[thin space (1/6-em)]](https://www.rsc.org/images/entities/char_2009.gif) 000 000 |
41![[thin space (1/6-em)]](https://www.rsc.org/images/entities/char_2009.gif) 000 000 |
70![[thin space (1/6-em)]](https://www.rsc.org/images/entities/char_2009.gif) 000 000 |
75![[thin space (1/6-em)]](https://www.rsc.org/images/entities/char_2009.gif) 000 000 |
58![[thin space (1/6-em)]](https://www.rsc.org/images/entities/char_2009.gif) 000 000 |
| Molecules per nm2 | 0.45 | 0.34 | 0.21 | 0.36 | 0.37 | 0.28 |
Next, α-D-mannopyranosylphenyl isothiocyanate (ITC-Man) was coupled onto the surface of NCs. After the reaction under the same conditions as for FITC, the excess of mannose was removed from the sample by repetitive centrifugation/redispersion and the quantification of the mannose residues on both types of NCs was performed by the phenol–sulfuric acid assay. In the case of HES NCs, due to the overlap of the signals from mannose and HES, the value from HES NCs, which were treated in the same way as mannose functionalized HES NCs, but without addition of the mannose derivative, was taken into consideration during the data evaluation.
The amount of mannose measured on HES and PU NCs corresponds to 1.42 × 10⁻⁵ mol of mannose per g of NCs and 1.53 × 10⁻⁵ mol of mannose per g of NCs, respectively. The values for ITC-Man functionalized NCs are in accordance with the amount of amine groups on the surface of NCs (Table 1). The amount of ITC-Man on NCs possessing a PEG linker is slightly lower, which might be due to the reaction of PEG with both ends, thus reducing the amount of available amine groups.
Functionalization of NCs with 3-O-(α-D-mannopyranosyl)-D-mannose (di-Man) and α3, α6-mannotriose (tri-Man)
Functionalization of HES NCs with di- and tri-Man occurs between the amine group on the NC surface and the aldehyde group present on the acyclic form of the sugar (Scheme 3).34 This form is in equilibrium not only with the cyclic pyrannoses and furanoses, but also with the hydrate form of the aldehyde.35 This strategy has the potential to be extended to every (oligo)sugar and it has been extensively used for the labeling of glycan, for their identification and quantification36–38 as well as for the immobilization of sugars on the surface plasmon resonance (SPR) chips.39 The key factor for success of this reaction is the presence of the acyclic form. The acetalization equilibrium between the cyclic and the acyclic form is catalyzed by carboxylic acid. Evangelista et al.40 have shown that malic, citric and malonic acids are the most efficient carboxylic acids for this function. In this work, citric acid was chosen as a catalyst. Another key factor is the reduction of the Schiff base. Recent publications proved the efficacy of 2-picoline borane for this task.37,41,42 Moreover, this reducing agent has the advantage over sodium cyanoborohydride of being non-toxic and therefore, it was used in the present studies.13C-NMR studies of reductive amination reaction
The reductive amination of mannose with amine was first studied with a model aromatic amine, anthranilic acid, which possesses a structure similar to the amine from the non-reacted and then hydrolyzed isocyanate group at the surface of the NCs. The reaction was performed in water with citric acid (0.26 M) at pH 4 and 55 °C. To be able to quantify the reaction, 13C labeled mannose was used for this study (Fig. S3†).A kinetic study was realized by quantitative 13C-NMR measurements using the pulse sequence, where the Overhauser effect is suppressed.43,44 The measurements revealed that after 20 h of reaction the spectrum did not change anymore (Fig. 3). Moreover, after 5 h, in addition to the peaks from 13C labeled mannose (71 and 94 ppm), from the citric acid (170–185, 75, 44 ppm), from DMSO (39 ppm), from DSS (external standard, 54, 19, 15 and −2 ppm), new peaks appeared at 70 and 49 ppm (orange and green asterisks in Fig. 3). These peaks are attributed to the chemical shifts of C1 and C2 of 13C labeled mannose after reaction with the amine group. The integration values of these peaks increase with time and finally stabilize (15 h of reaction). A comparison of the integration at 70 ppm with the integration of mannose at 94 ppm permits the determination of a reaction yield of around 66%. A closer look at the spectrum shows the appearance of new peaks after 10 h of reaction in the aromatic region (120–160 ppm). These peaks are attributed to 2-methylpyridine, due to the hydrolysis of the reducing agent, 2-picoline borane. Indeed, these peaks were not visible after 5 h of reaction. To support this hypothesis, the 13C-NMR spectrum (Fig. 4) of 2-picoline borane (treated under the conditions of the reductive amination) was recorded after 12 h and revealed the presence of the same peaks. It should be noted that the characteristic peaks from the anthranilic acid are not visible in the 13C spectra, because the concentration of this molecule is too low and in addition this molecule does not possess any labeled carbon. This experiment thus confirmed that the reaction is possible under the chosen conditions. However, due to the hydrolysis of 2-picoline borane, the reducing agent was added in several steps to increase the efficiency of reductive amination.
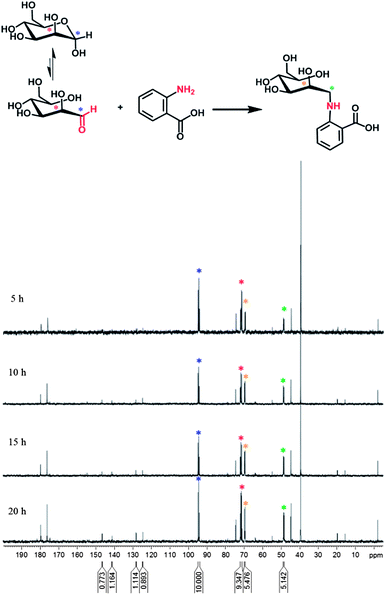 | ||
| Fig. 3 Quantitative 13C-NMR (125 MHz, D2O, 353 K) spectra from the reaction kinetics between 13C labeled mannose (2 eq. with respect to the amount of amine groups that are present in the medium) and anthranilic acid in the aqueous citric acid medium (pH 4) with 2-picoline borane as a reducing agent (20 eq.). The blue and red asterisks show the characteristic carbon peaks of the labeled mannose (at positions C1 and C2, respectively) and the orange and green – of the end-product. The attribution of the other peaks is given in Fig. 4. | ||
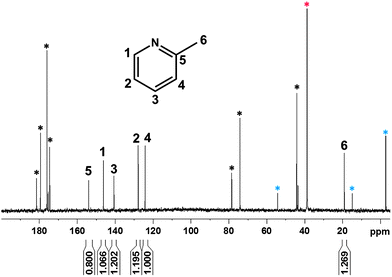 | ||
| Fig. 4 Quantitative 13C-NMR (125 MHz, D2O, 353 K) spectrum from 2-picoline borane under the conditions of the reductive amination reaction. Peaks marked with black, blue and red asterisks are attributed to the carbon from citric acid, DSS (external standard) and DMSO, respectively. | ||
Since the spin–spin relaxation time (T2) of mannose coupled onto the surface of the NCs is too short, which leads to broad or vanished peaks, it was not possible to perform 13C quantitative NMR on the HES NCs. Therefore, PU NCs were used to determine the coupling yield. 3-O-(α-D-Mannopyranosyl)-D-mannopyranose (di-Man) was coupled to the PU NCs. After 1, 2 and 3 days of reaction, a sample was picked up, washed by repetitive centrifugation/redispersion and freeze-dried. Quantification of the mannose residue on the PU NCs was performed by the phenol–sulfuric acid assay as described in the experimental part. In the present case, a disaccharide is grafted onto NCs and it remains in the form of monosaccharide after the reaction (Scheme 3).
Since the response of mannitol in comparison to mannose is of the same order of magnitude as water in this colorimetric assay (Fig. S4†), the values for different PU NC samples taken after each day of the reaction were compared with a calibration curve obtained from mannose. The blank value, obtained from PU NCs treated under the same conditions, but without addition of di-Man, was subtracted from the value of each sample. The comparison with the initial amine content shows a coupling yield that increases during the reaction: 8.5%, 25%, 39% after 1, 2 and 3 days, respectively. This yield signified that each PU NC possesses around 24![[thin space (1/6-em)]](https://www.rsc.org/images/entities/char_2009.gif) 000 molecules of mannose on its surface (0.12 molecules per nm2) after 3 days of reaction. The same procedure (3 days of reaction) was employed on HES and PU NCs with and without a PEG linker. The obtained results (see Table 3) show that the type of coupled sugar does not influence the coupling yield.
000 molecules of mannose on its surface (0.12 molecules per nm2) after 3 days of reaction. The same procedure (3 days of reaction) was employed on HES and PU NCs with and without a PEG linker. The obtained results (see Table 3) show that the type of coupled sugar does not influence the coupling yield.
| HES NCs without a PEG linker | HES NCs with a PEG linker | PU NCs without a PEG linker | PU NCs with a PEG linker | |||||
|---|---|---|---|---|---|---|---|---|
| tri-Man | di-Man | tri-Man | di-Man | tri-Man | di-Man | tri-Man | di-Man | |
| Mol of molecules per g NCs (10−6) | 2.83 | 3.24 | 3.26 | 3.67 | 4.45 | 5.24 | 4.79 | 5.13 |
| Molecules per NC | 13![[thin space (1/6-em)]](https://www.rsc.org/images/entities/char_2009.gif) 000 000 |
15![[thin space (1/6-em)]](https://www.rsc.org/images/entities/char_2009.gif) 000 000 |
16![[thin space (1/6-em)]](https://www.rsc.org/images/entities/char_2009.gif) 000 000 |
17![[thin space (1/6-em)]](https://www.rsc.org/images/entities/char_2009.gif) 000 000 |
22![[thin space (1/6-em)]](https://www.rsc.org/images/entities/char_2009.gif) 000 000 |
26![[thin space (1/6-em)]](https://www.rsc.org/images/entities/char_2009.gif) 000 000 |
23![[thin space (1/6-em)]](https://www.rsc.org/images/entities/char_2009.gif) 000 000 |
25![[thin space (1/6-em)]](https://www.rsc.org/images/entities/char_2009.gif) 000 000 |
| Molecules per nm2 | 0.07 | 0.08 | 0.08 | 0.09 | 0.11 | 0.13 | 0.12 | 0.13 |
Recognition of surface-exposed mannose by interaction with a fluorescent lectin
The ability of mannose-functionalized HES NCs to interact with the FITC labeled Galanthus nivalis agglutinin (GNA-FITC) was investigated as a function of the mannose type that was coupled onto the surface, the density of mannose and the presence of a PEG linker. As seen in Fig. 5, the fluorescence intensity is always higher for mannose coated NCs as for the blank, proving the availability of sugar to bind with the lectin. Moreover, fluorescence intensity became more significant for mannose-coated NCs with a PEG linker, due to the better accessibility of the targeting agent on the surface of the NCs. Even if the binding affinity for mannose is low (e.g. binding constant for: methyl-α-mannoside is 41 M−1;45 di-Man is 3.3 × 10³ M−1;46 tri-Man is 3.3 × 10³ M−1 (ref. 46)), the interaction was possible due to the multivalence or cluster-glycoside effects such as the higher binding affinity and specificity observed for a multivalent ligand than for the sum of its parts.47,48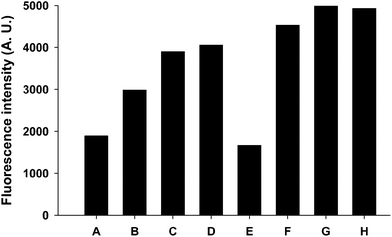 | ||
| Fig. 5 Fluorescence of washed NC dispersion measured after interaction between mannosylated HES NCs and GNA-FITC. The legend of the X-axis corresponds to the following samples: (A) non-modified HES NCs; (B) HES NCs with ITC-Man; (C) HES NCs with di-Man; (D) HES NCs with tri-Man; (E) HES NCs with a PEG linker; (F) HES NCs with PEG/ITC-man; (G) HES NCs with PEG/di-Man; (H) HES NCs with PEG/tri-Man. Di-Man, tri-Man, PEG correspond to 3-O-(α-D-mannopyranosyl)-D-mannose, α3,α6-mannotriose and the PEG linker, respectively. | ||
A comparison of different mannose molecules coupled onto the surface shows a better interaction for 3-O-(α-D-mannopyranosyl)-D-mannose (di-Man) and α3,α6-mannotriose (tri-Man) in comparison to ITC-Man coated NCs in spite of a lower density. This observation reflects the significantly higher binding affinity of the lectin for these sugars, despite the fact that in the present case one sugar is in the open form.
This might be due to the participation of some of the hydroxyl groups in the hydrogen bonding with amino acid from the lectin thus favoring the interaction.49 Similar fluorescent values for di- and tri-Man coated NCs are obtained for the NCs with and without a PEG linker, because the binding constants are quite similar.
To mimic the in vivo conditions an additional set of experiments was performed by incubating the NCs with human serum before interaction with the fluorescent lectin. Indeed, it is well known that proteins present in the biological medium interact with the nanoparticles very fast.50 Therefore, this additional step is important before testing these NCs in vivo. The fluorescence intensities for NCs pre-incubated with the human serum (HS) are lower than those for the NCs that were not incubated with HS (Fig. 6).
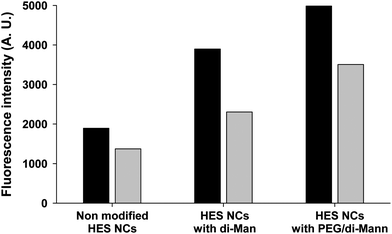 | ||
| Fig. 6 Fluorescence on washed NC dispersion measured after interaction between mannosylated HES NCs and GNA-FITC without incubation with HS (dark grey columns) and with incubation with HS (light grey columns). | ||
This difference was ascribed to the partial shielding of the mannose molecules by the adsorption of the protein. Indeed, the NCs are negatively charged (zeta potential around −15 mV) and at physiological pH (pH 7.2), most of the proteins are above their isoelectric point, leading to the electrostatic interaction between the proteins and NCs. Nevertheless, the interaction with the lectin was still possible, since a significant difference in fluorescence is observed between the non-modified and the mannosylated HES NCs. The observed tendency is similar to that of the experiment without incubation with HS, i.e., a better availability of the 3-O-(α-D-mannopyranosyl)-D-mannopyranose (di-Man) was observed in the presence of a PEG linker. This experiment proved unambiguously that despite the presence of proteins, the targeting agent is still available for the interaction with a receptor.
Interaction of tri-Man functionalized HES NCs with dendritic cells
In order to demonstrate the effectiveness of the mannosylated NCs a cell culture experiment was performed. Dendritic cells are one of the most interesting cell populations in immunological applications and have been investigated widely e.g., for vaccination trials and are also targets in other immunological diseases.51,52 The uptake of NCs is highly enhanced by the mannose on the surface of NCs as has been investigated by flow cytometry and is demonstrated in Fig. 7. By using confocal laser scanning microscopy (CLSM) we demonstrate that mannosylated NCs are indeed taken up into the target cells (Fig. 8).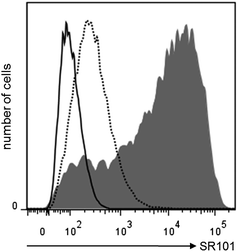 | ||
| Fig. 7 Flow cytometry analysis of NCs uptake by iDCs. Cells were gated for expression of CD11c. Solid histogram indicates cells that were not treated with NCs. Dashed histogram represents iDCs loaded with non-modified HES NCs, while filled histogram shows cells treated with HES/tri-Man NCs. | ||
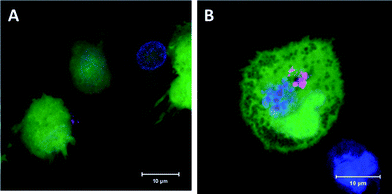 | ||
| Fig. 8 Confocal laser scanning microscopy of NCs loaded iDCs (maximum intensity projection). The cytoplasm is stained in green, nuclear membrane in blue and NCs in red. Non-modified HES NCs were only non-specifically attached to the cells (A), whereas mannosylated HES/tri-Man NCs were taken up to a much greater extent (B). | ||
Conclusions
Taking advantage of the residual amine group from the cross-linking coupling reaction for the formation of the NCs, two strategies for the coupling of different (oligo)mannose molecules onto the surface of the NCs were developed and characterized. The first relies on the reaction of the amine with the isothiocyanate function present on mannose (ITC-Man), the second with the aldehyde group of the open form of 3-O-(α-D-mannopyranosyl)-D-mannose (di-Man) and α3,α6-mannotriose (tri-Man). The first strategy allowed a higher functionalization of the amine present on the NCs by mannose (100% vs. ∼40%), while the second is more versatile, since all saccharide molecules possessing a reductive sugar can be coupled.The interaction of these functionalized NCs with a fluorescent lectin shows the availability of the mannose coupled by both strategies to interact with a model receptor. A better binding was observed with di- and tri-Man coupled onto the NC surface, due to the significantly higher binding affinity of the lectin for these sugars in comparison to mannose (one unit). Also the introduction of a PEG linker between the NCs and the saccharide leads to the increased interaction with the receptor, which is mainly due to the better accessibility of the sugar moiety.
The availability of the sugar at the surface to interact specifically with the mannose-receptor was evidenced by interaction with a fluorescent lectin. The targeting function of mannosylated HES NCs was shown in the example of dendritic cells in in vitro studies.
Acknowledgements
H.F. thanks the Max Planck Society for financial support. Gunnar Glasser (MPI-P) and Malte Paulsen (Institute of Molecular Biology, Mainz) are acknowledged for their highly skilled technical help with SEM and flow cytometry measurements, respectively. Steffen Lorenz and Dennis Strand (Department of Internal Medicine, University Medical Centre, Johannes Gutenberg University, Mainz) are gratefully acknowledged for their support in CLSM measurements.Notes and references
- F. Chellat, Y. Merhi, A. Moreau and L. H. Yahia, Biomaterials, 2005, 26, 7260 CrossRef CAS.
- E. P. McGreal, J. L. Miller and S. Gordon, Curr. Opin. Immunol., 2005, 17, 18 CrossRef CAS.
- P. Guermonprez, J. Valladeau, L. Zitvogel, C. Thery and S. Amigorena, Annu. Rev. Immunol., 2002, 20, 621 CrossRef CAS.
- S. J. van Vliet, J. J. Garcia-Vallejo and Y. van Kooyk, Immunol. Cell Biol., 2008, 86, 580 CrossRef CAS.
- G. Barratt, J. P. Tenu, A. Yapo and J. F. Petit, Biochim. Biophys. Acta, Biomembr., 1986, 862, 153 CrossRef CAS.
- S. Kawakami, J. Wong, A. Sato, Y. Hattori, F. Yamashita and M. Hashida, Biochim. Biophys. Acta, 2000, 1524, 258 CrossRef CAS.
- M. P. Leal, M. Assali, I. Fernández and N. Khiar, Chem.–Eur. J., 2011, 17, 1828 CrossRef CAS.
- J. Shao and J. K. H. Ma, Drug Delivery, 1997, 4, 43 CrossRef CAS.
- V. Fievez, L. Plapied, A. des Rieux, V. Pourcelle, H. Freichels, V. Wascotte, M. L. Vanderhaeghen, C. Jerome, A. Vanderplasschen, J. Marchand-Brynaert, Y. J. Schneider and V. Preat, Eur. J. Pharm. Biopharm., 2009, 73, 16 CrossRef CAS.
- M. Nahar and N. Jain, Pharm. Res., 2009, 26, 2588 CrossRef CAS.
- J. Rieger, H. Freichels, A. Imberty, J.-L. Putaux, T. Delair, C. Jerome and R. Auzely-Velty, Biomacromolecules, 2009, 10, 651 CrossRef CAS.
- Z. Ghotbi, A. Haddadi, S. Hamdy, R. W. Hung, J. Samuel and A. Lavasanifar, J. Drug Targeting, 2011, 19, 281 CrossRef CAS.
- B. Carrillo-Conde, E. H. Song, A. Chavez-Santoscoy, Y. Phanse, A. E. Ramer-Tait, N. L. Pohl, M. J. Wannemuehler, B. H. Bellaire and B. Narasimhan, Mol. Pharmaceutics, 2011, 8, 1877 CrossRef CAS.
- S. K. Jain, Y. Gupta, A. Jain, A. R. Saxena, P. Khare and A. Jain, Nanomedicine: Nanotechnology, Biology and Medicine, 2008, 4, 41 CrossRef CAS.
- M. Nahar, V. Dubey, D. Mishra, P. K. Mishra, A. Dube and N. K. Jain, J. Drug Targeting, 2010, 18, 93 CrossRef CAS.
- L. N. Cui, J. A. Cohen, K. E. Broaders, T. T. Beaudette and J. M. J. Frechet, Bioconjugate Chem., 2011, 22, 949 CrossRef CAS.
- M. Hashimoto, M. Morimoto, H. Saimoto, Y. Shigemasa, H. Yanagie, M. Eriguchi and T. Sato, Biotechnol. Lett., 2006, 28, 815 CrossRef CAS.
- H.-L. Jiang, Y.-K. Kim, R. Arote, D. Jere, J.-S. Quan, J.-H. Yu, Y.-J. Choi, J.-W. Nah, M.-H. Cho and C.-S. Cho, Int. J. Pharm., 2009, 375, 133 CrossRef CAS.
- T. H. Kim, H. Jin, H. W. Kim, M. H. Cho and C. S. Cho, Mol. Cancer Ther., 2006, 5, 1723 CrossRef CAS.
- J. Devy, E. Balasse, H. Kaplan, C. Madoulet and M. C. Andry, Int. J. Pharm., 2006, 307, 194 CrossRef CAS.
- K. Landfester, A. Musyanovych and V. Mailander, J. Polym. Sci., Part A: Polym. Chem., 2010, 48, 493 CrossRef CAS.
- K. Landfester, Angew. Chem., Int. Ed., 2009, 48, 4488 CrossRef CAS.
- S. Mizrahy and D. Peer, Chem. Soc. Rev., 2012, 41, 2623 RSC.
- G. Baier, D. Baumann, J.-M. Siebert, A. Musyanovych, V. Mailänder and K. Landfester, Biomacromolecules, 2012, 13, 2704 CrossRef CAS.
- G. Baier, A. Musyanovych, M. Dass, S. Theisinger and K. Landfester, Biomacromolecules, 2010, 11, 960 CrossRef CAS; K. Landfester, A. Musyanovych and V. Mailander, J. Polym. Sci., Part A: Polym. Chem., 2010, 48, 493 CrossRef.
- U. Paiphansiri, J. Dausend, A. Musyanovych, V. Mailänder and K. Landfester, Macromol. Biosci., 2009, 9, 575 CrossRef CAS.
- A. Musyanovych and H. J. P. Adler, Langmuir, 2005, 21, 2209 CrossRef CAS.
- I. Migneault, C. Dartiguenave, M. J. Bertrand and K. C. Waldron, BioTechniques, 2004, 37, 790 CAS.
- E. J. M. Van Damme, A. K. Allen and W. J. Peumans, FEBS Lett., 1987, 215, 140 CrossRef CAS.
- H. Schlaad, H. Kukula, J. Rudloff and I. Below, Macromolecules, 2001, 34, 4302 CrossRef CAS.
- A. Thomas, H. Schlaad, B. Smarsly and M. Antonietti, Langmuir, 2003, 19, 4455 CrossRef CAS.
- F. Sauzedde, F. Ganachaud, A. Elaissari and C. Pichot, J. Appl. Polym. Sci., 1997, 65, 2331 CrossRef CAS.
- M. Dubois, K. A. Gilles, J. K. Hamilton, P. A. Rebers and F. Smith, Anal. Chem., 1956, 28, 350 CrossRef CAS.
- J. C. Gildersleeve, O. Oyelaran, J. T. Simpson and B. Allred, Bioconjugate Chem., 2008, 19, 1485 CrossRef CAS.
- Y. Zhu, J. Zajicek and A. S. Serianni, J. Org. Chem., 2001, 66, 6244 CrossRef CAS.
- L. R. Ruhaak, G. Zauner, C. Huhn, C. Bruggink, A. M. Deelder and M. Wuhrer, Anal. Bioanal. Chem., 2010, 397, 3457 CrossRef CAS.
- L. R. Ruhaak, E. Steenvoorden, C. A. M. Koeleman, A. M. Deelder and M. Wuhrer, Proteomics, 2010, 10, 2330 CrossRef CAS.
- L. R. Ruhaak, R. Hennig, C. Huhn, M. Borowiak, R. Dolhain, A. M. Deelder, E. Rapp and M. Wuhrer, J. Proteome Res., 2010, 9, 6655 CrossRef CAS.
- Y. Suda, A. Arano, Y. Fukui, S. Koshida, M. Wakao, T. Nishimura, S. Kusumoto and M. Sobel, Bioconjugate Chem., 2006, 17, 1125 CrossRef CAS.
- R. A. Evangelista, F. T. A. Chen and A. Guttman, J. Chromatogr., A, 1996, 745, 273 CrossRef CAS.
- V. A. Cosenza, D. A. Navarro and C. A. Stortz, ARKIVOC, 2011, 182 CrossRef CAS.
- S. Sato, T. Sakamoto, E. Miyazawa and Y. Kikugawa, Tetrahedron, 2004, 60, 7899 CrossRef CAS.
- R. Freeman, H. D. W. Hill and R. Kaptein, J. Magn. Reson., 1972, 7, 327 CAS.
- M. L. Martin, J. J. Delpuech and G. J. Martin, Practical NMR Spectroscopy, Heyden, London, 1980, pp. 231–235 Search PubMed.
- H. Kaku and I. J. Goldstein, Carbohydr. Res., 1992, 229, 337 CrossRef CAS.
- M. C. Chervenak and E. J. Toone, Biochemistry, 1995, 34, 5685 CrossRef CAS.
- J. J. Lundquist and E. J. Toone, Chem. Rev., 2002, 102, 555 CrossRef CAS.
- Y. C. Lee and R. T. Lee, Acc. Chem. Res., 1995, 28, 321 CrossRef CAS.
- W. I. Weis and K. Drickamer, Annu. Rev. Biochem., 1996, 65, 441 CrossRef CAS.
- G. Baier, C. Costa, A. Zeller, D. Baumann, C. Sayer, P. H. H. Araujo, V. Mailänder, A. Musyanovych and K. Landfester, Macromol. Biosci., 2011, 11, 628 CrossRef CAS.
- H. K. Kim, H. Wei, A. Kulkarni, R. M. Pogranichniy and D. H. Thompson, Biomacromolecules, 2012, 13, 636 CrossRef CAS.
- X. Sun, S. Chen, J. Han and Z. Zhang, Int. J. Nanomed., 2012, 7, 2929 CrossRef CAS.
Footnotes |
| † Electronic supplementary information (ESI) available: Conductometric titration curves for HES and PU NCs, calibration curve for the determination of the amine content by reaction with fluorescamine, chemical structure of 13C-labeled mannose at position C1 and C2 and its 13C-NMR spectrum, comparative phenol/sulfuric acid assay of mannose and mannitol. See DOI: 10.1039/c3tb20138d |
| ‡ Present address: Interactive Materials Research, DWI an der RWTH Aachen e.V., Forckenbeckstraβe 50, 52056 Aachen, Germany. |
| This journal is © The Royal Society of Chemistry 2013 |

