 Open Access Article
 This Open Access Article is licensed under a Creative Commons Attribution-Non Commercial 3.0 Unported Licence
Electrochemical synthesis of coaxial TiO2–Ag nanowires and their application in photocatalytic water splitting
A. Wouter
Maijenburg
a,
Janneke
Veerbeek
a,
Roy
de Putter
a,
Sjoerd A.
Veldhuis
a,
Michel G. C.
Zoontjes
b,
Guido
Mul
b,
Josep M.
Montero-Moreno
c,
Kornelius
Nielsch
c,
Helmut
Schäfer
d,
Martin
Steinhart
d and
Johan E.
ten Elshof
*a
aInorganic Materials Science, MESA+ Institute for Nanotechnology, University of Twente, P.O. Box 217, 7500 AE Enschede, The Netherlands. E-mail: j.e.tenelshof@utwente.nl
bPhotocatalytic Synthesis, MESA+ Institute for Nanotechnology, University of Twente, P.O. Box 217, 7500 AE Enschede, The Netherlands
cMultifunctional Nanostructures, Institute of Applied Physics, University of Hamburg, Jungiusstrasse 11, 20355 Hamburg, Germany
dPhysikalische Chemie, Institut für Chemie neuer Materialien, Universität Osnabrück, Barbarastr. 7, D-49069 Osnabrück, Germany
First published on 5th December 2013
Abstract
A new method for the formation of coaxial TiO2–Ag nanowires is presented, in which TiO2 nanotubes were formed by the templated electrochemically induced sol–gel method, followed by thermal annealing. The as-formed TiO2 nanotubes have been successfully filled with a Ag core using a subsequent electrodeposition step. Coaxial nanowires have a very suitable architecture for photocatalysis, solar cells or batteries due to the high contact area between the two different phases, the large outer surface area exposed to the reactant, and short electron diffusion paths. The coaxial nanowires showed a higher efficiency than empty TiO2 nanotubes and TiO2 nanotubes with attached Ag nanoparticles in photocatalytic water splitting. Coaxial TiO2–Ag nanowires formed H2 at a rate of ∼1.23 × 10⁻³ ± 0.3 × 10⁻³ mol g−1 h−1 without deactivation for at least 6 h.
Introduction
One-dimensional nanostructures, such as nanowires and nanotubes, have attracted increasing attention in the last few years. The unique physical and chemical properties of these nanostructures make them promising building blocks for various kinds of future applications, such as nanosensors,2–4 cell trackers,5–7 and self-propelling nanomotors.8–10 Because of their very high surface-to-volume ratio, some of the most interesting applications of nanowires and nanotubes are in solar cells and photocatalytic water splitting.1,11–13 The physical properties of most semiconductors demand the use of one-dimensional nanostructures, since the diffusion length of minority charge carriers in most semiconductors is of the order of 100 nm, while the absorption depth near the bandgap is of the order of 10 μm.16–19 In this respect, a maximum of solar light can be absorbed over the nanowire length, while the nanowire diameter is small enough for efficient electron and hole diffusion, thereby leading to high efficiency.20With a band gap of 3.0 eV, high chemical stability and low synthesis costs, TiO2 in the anatase phase is a very interesting material for efficient solar hydrogen formation.20–22 TiO2 is therefore the most commonly used material for photocatalytic water splitting and solar cells.23–25 TiO2 nanotubes are also often used for photocatalytic water splitting,14,15,26–30 although few authors present actual H2 formation rates.14,15,29 Alternatively, TiO2 nanowires and nanotubes can also be used as micromotors, microfireworks or micropumps upon excitation by UV light,31 as catalysts for methanol (electro)oxidation32,33 or as anode materials in Li-ion batteries.34–36 The formation of a core–shell structure based on TiO2 nanotubes may also be advantageous for such applications.
TiO2 nanowires and nanotubes can be formed via several techniques, i.e. hydrothermal treatment,37 anodization of titanium foils,38–40 atomic layer deposition (ALD),41,42 modified sol–gel route,11,43,44 sol–gel electrophoresis,45,46 electrochemical deposition,47,48 and electrochemically induced sol–gel synthesis.49,50 As sol–gel electrophoresis and the modified sol–gel route provide nanowires or nanotubes consisting of smaller sol–gel particles, the resulting nanostructures are very brittle with rough surfaces, which decreases the mechanical stability of the formed nanowires. Although a large area of single crystalline TiO2 nanotubes with tuneable dimensions can be made by anodization of Ti foil, the main disadvantage of this technique is that the formed nanotubes do not contain a conductive back electrode, so that extra steps need to be applied before these nanotubes can be filled with a second material.51 In contrast, the availability of a back electrode and the synthesis of smooth films or nanostructures make the electrochemically induced sol–gel method a very promising technique for the synthesis of core–shell nanostructures with a TiO2 shell.
The electrochemically induced sol–gel method for the cathodic electrodeposition of titanium dioxide thin films was first introduced by Natarajan and Nogami52 and was further improved by Karuppuchamy et al.53,54 This method involves dissolving titanium oxysulfate (TiOSO4) powder in an aqueous solution of hydrogen peroxide (H2O2), yielding a peroxotitanate complex (Ti(O2)SO4) (eqn (1)):
| TiOSO4 + H2O2 → Ti(O2)SO4 + H2O. | (1) |
At potentials more negative than −0.9 V vs. Ag/AgCl, nitrate is reduced to form hydroxyl ions (eqn (2)),54 and consequently the pH in the vicinity of the electrode surface is increased:49
| NO3− + H2O + 2e− → NO2− + 2OH−. | (2) |
This local increase in pH is necessary for the formation of a titanium hydroxide gel as shown in eqn (3):54
| Ti(O2)SO4 + 2OH− + (x + 1)H2O → TiO(OH)2·xH2O + H2O2 + SO42−. | (3) |
According to differential thermal analysis data of Natarajan and Nogami, water is removed from the gel during thermal annealing around 283 °C (eqn (4)), resulting in an amorphous TiO2 phase.52 When the temperature is increased above 365 °C, crystallization into the anatase phase occurs:52,55
| TiO(OH)2·xH2O → TiO2 + (x + 1)H2O. | (4) |
By employing the electrochemically induced sol–gel method within the pores of an anodic aluminium oxide (AAO) template, nanowires and nanotubes can be formed. Nanowires were previously made using templates with pores of 50 nm diameter and smaller.49,50 In the present study, AAO templates with a diameter of 200 nm were used, which resulted in nanotube formation. The mechanism of nanotube formation was previously described by Maas et al., and occurs by removal of water from the titanium hydroxide gel.56 The first 6 steps in Fig. 1 provide a schematic representation of TiO2 nanotube formation according to the above reactions.
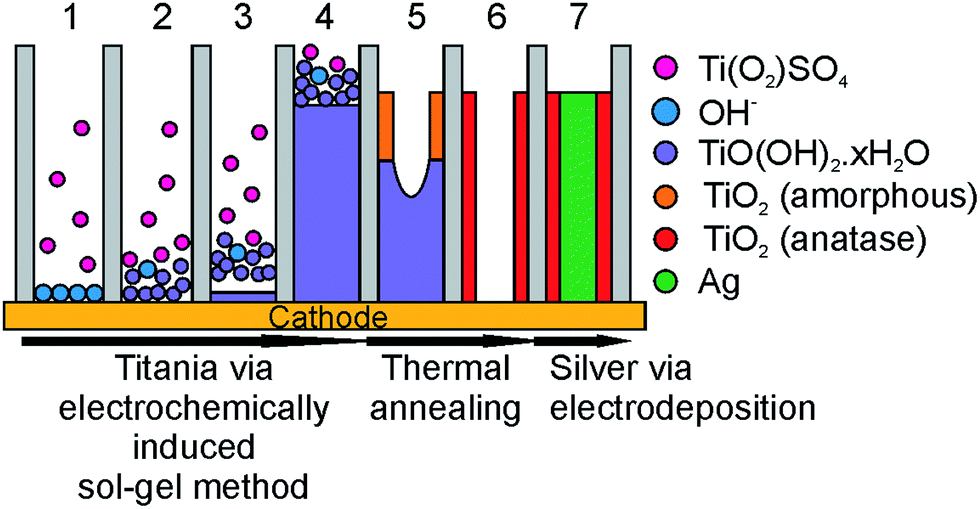 | ||
| Fig. 1 Schematic overview of the preparation of coaxial TiO2–Ag nanowires using the electrochemically induced sol–gel method: formation of OH− at the electrode (step 1, reaction (2)), reaction of Ti(O2)SO4 with OH− to form TiO(OH)2·xH2O and filling of the template (steps 2–4, reaction (3)), drying and thermal annealing of the titanium hydroxide gel to TiO2 (steps 5–6, reaction (4)), and filling of the TiO2 nanotubes with Ag (step 7). | ||
As mentioned above, an advantage of the electrochemically induced sol–gel method for TiO2 nanotube formation is the availability of a cathode at one end of the AAO membrane or template. This allows for the formation of coaxial nanowires by filling the TiO2 nanotubes in a subsequent deposition step with a second phase like silver (step 7 in Fig. 1). By combining an n-type semiconductor like TiO2 with a noble metal, a Schottky barrier is formed when the work function of the metal is smaller than that of the n-type semiconductor, which diminishes electron–hole recombination.20 This is schematically depicted in Fig. 2. Upon illumination, electrons and holes are formed in the TiO2 shell layer (step 1). As the electrons are transferred to the silver core of the wires, the holes go to the surface of the TiO2 phase (steps 2), where they are known to react with water to form H+ ions and O2 (steps 3). In the Ag phase, at the outer ends of the coaxial nanowire, electrons and protons can combine to form H2 (step 4).20–22
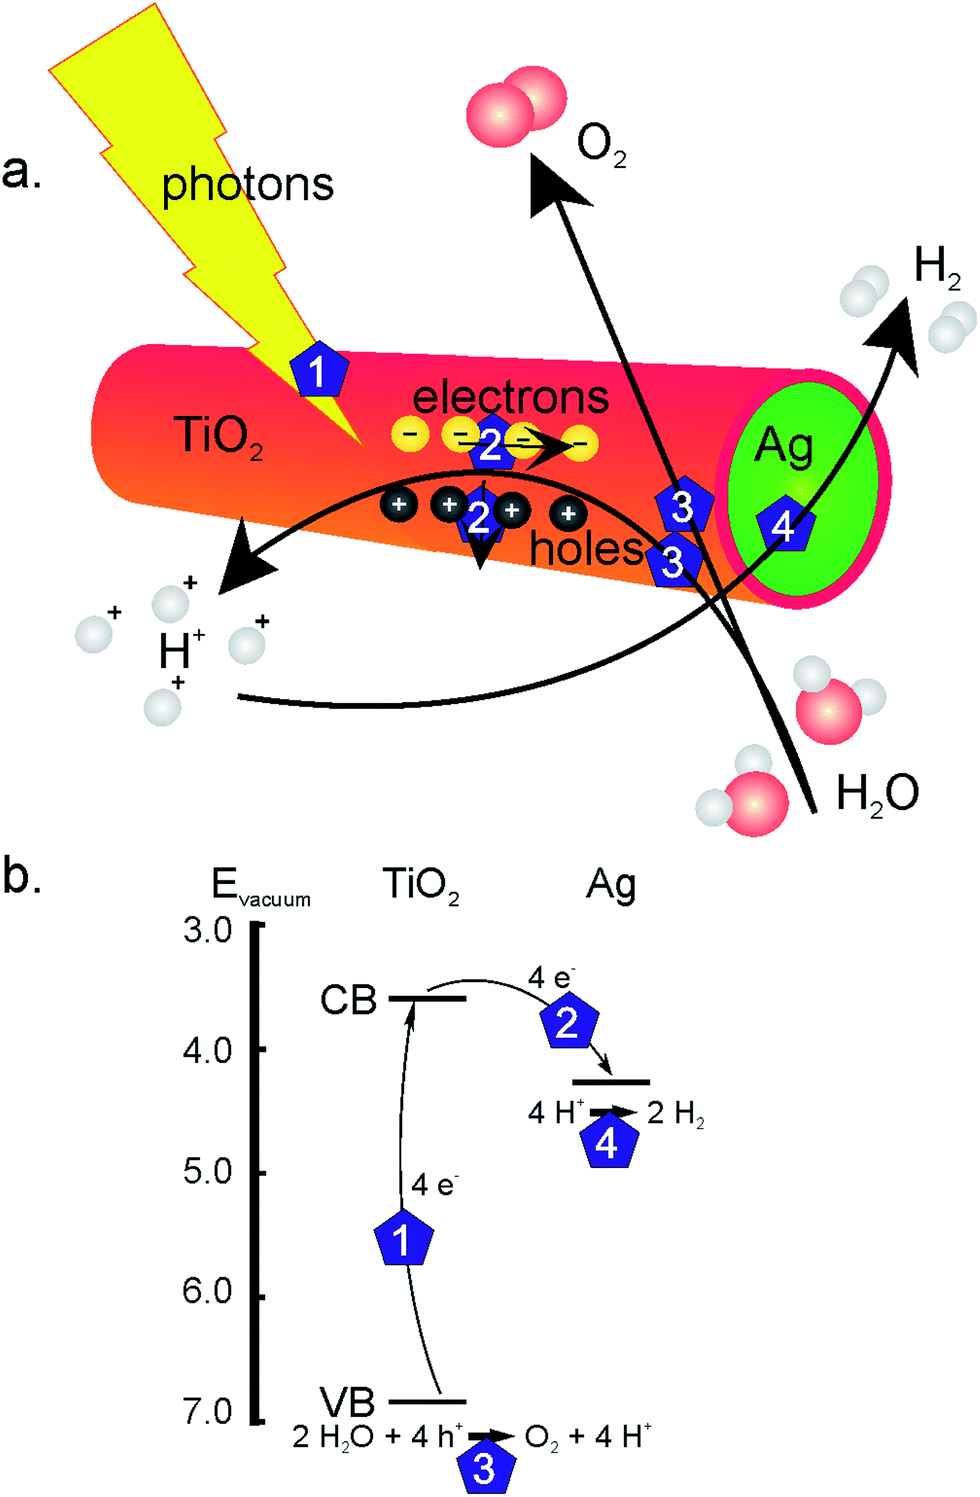 | ||
| Fig. 2 (a) Schematic representation and (b) band energy diagram of water splitting by coaxial TiO2–Ag nanowires in an alkaline solution: formation of electrons and holes in the TiO2 phase (step 1), electron–hole separation at the TiO2–Ag interface (steps 2), water oxidation at the TiO2 surface (steps 3) and H2 formation at the Ag surface (step 4). | ||
In this study, we employed the electrochemically induced sol–gel method for the formation of TiO2 nanotubes and filled these nanotubes with a silver phase using electrodeposition. The photocatalytic activity of the coaxial TiO2–Ag nanowires in splitting water was investigated in an alkaline solution. Furthermore, the photocatalytic activity of the coaxial TiO2–Ag nanowires was compared with similar TiO2 nanostructures with/without Ag that were also prepared in this study, and with values reported in other studies.
Results and discussion
Since it was found that annealing within a template resulted in crystallization at a higher temperature than in films, we investigated the crystallinity of different samples annealed at variable temperatures (Fig. 3). The figure shows that TiO2 within an AAO template crystallized into a mixture of anatase, rutile and brookite between 525 °C and 550 °C, while an unconstrained TiO2 gel made via the same procedure crystallized below 400 °C (data not shown, see e.g. Natarajan and Nogami).52 Also for TiO2 powder made via a different sol–gel process, it is known that TiO2 crystallizes below 400 °C.57 A possible explanation for the large difference found in crystallization temperatures between TiO2 powder and the nanotubes formed in this study may be clamping of the TiO2 phase on the sidewalls of the AAO template. Clamping was also previously found to retard the crystallization of BaTiO3 and SrRuO3 films.58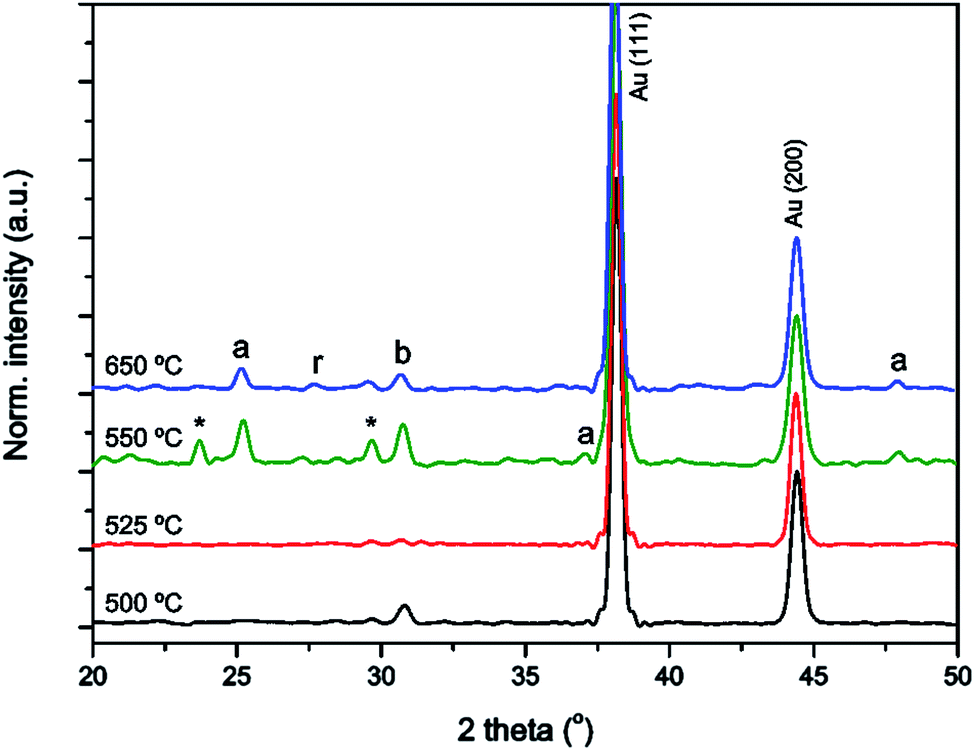 | ||
| Fig. 3 XRD patterns of TiO2 nanotubes annealed for 2 h at 500 °C (black line), 525 °C (red line), 550 °C (green line), and 650 °C (blue line), with the tubes still inside an AAO membrane; diffraction peaks were assigned to Au (PDF # 00-004-0784), anatase TiO2 (a, PDF # 00-021-1272), rutile TiO2 (r, PDF # 00-021-1276) and brookite TiO2 (b, PDF # 00-029-1360); an unknown impurity phase is denoted with an asterisk (*). | ||
After annealing the titania gel inside an AAO membrane for 2 h at 650 °C, the TiO2 gel was crystallized into a polycrystalline mixture of anatase, rutile and brookite polymorphs of TiO2, with no preferred orientation. It is noted that the presence of all three polymorphs of TiO2 is known to have a positive influence on the photocatalytic activity as previously discussed in several other studies.59,60 After annealing at 550 °C, the formation of an unidentified impurity phase was observed, which is denoted with an asterisk. For the TiO2 nanotubes, crystallite sizes of approximately 42 and 45 nm were found when annealed at 550 and 650 °C, respectively, showing negligible crystallite growth. For TiO2 films made via the same method we observed exponential crystallite growth with sizes of 19 and 28 nm when annealed at 550 and 650 °C, respectively.
The cross-section of a membrane containing TiO2 nanotubes after annealing at 650 °C shows a gradual decrease in thickness of the TiO2 coating on the AAO pore walls from ∼55 nm at the bottom of the membrane (Fig. 4b), which is the cathode side, to ∼10 nm at the top of the membrane (Fig. 4a). The thickness gradient can be explained by the formation of a thicker gel near the electrode as OH− is formed here. To put the thickness of the TiO2 phase into the perspective of the proposed application in solar water splitting, a wall thickness less than 20 nm would provide efficient charge carrier separation as the minority carrier diffusion length in TiO2 is approximately 20 nm.61 This means that the most efficient charge carrier separation takes place only in the upper part of these nanotubes. On the other hand, the chance that a photon is absorbed by the material is higher when the titania wall is thicker. It is expected that a lower concentration of KNO3 in the electrolyte solution can provide TiO2 nanotubes with thinner walls, but a trade-off has to be made between carrier diffusion length, mechanical stability of the nanotubes and degree of photon absorption. After dissolving the membrane, a droplet of nanotube solution was placed on a silicon wafer for visualization with SEM. These nanotubes appear to be smooth at first sight, but a closer look reveals that they are composed of very small grains (Fig. 4c).
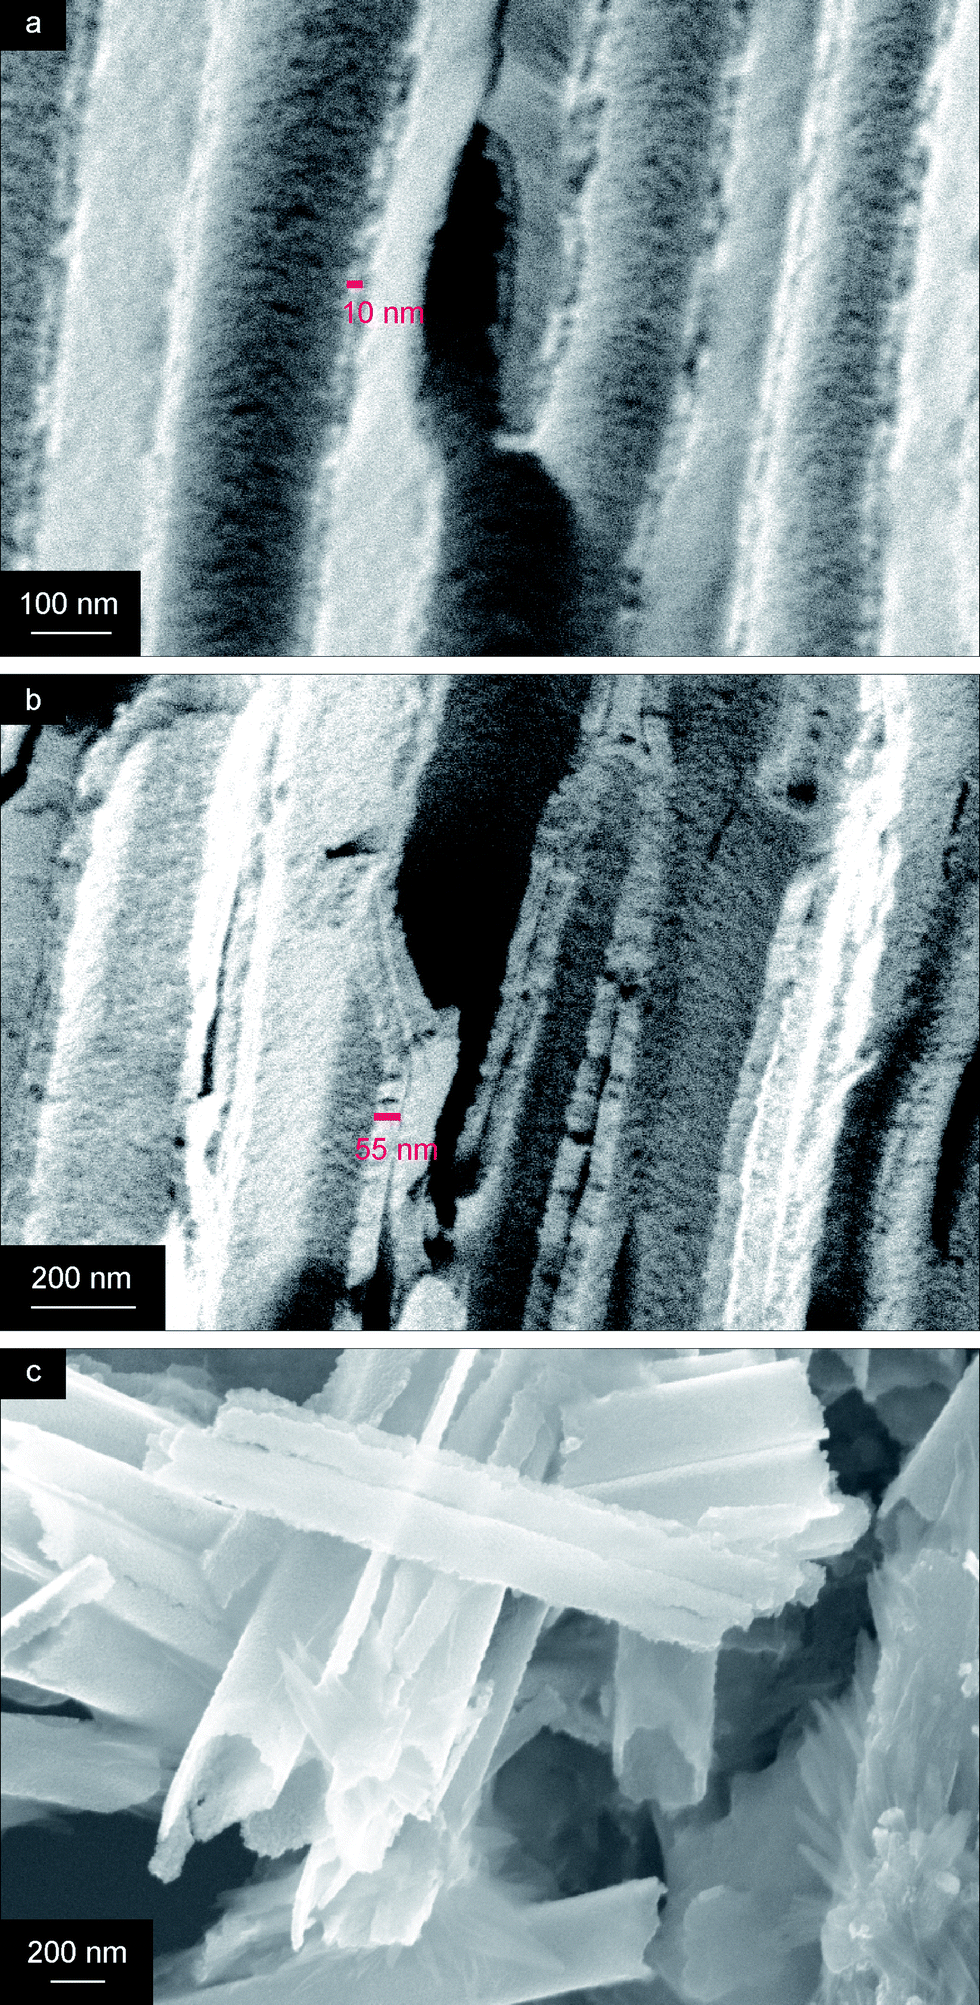 | ||
| Fig. 4 Cross-sectional SEM images of TiO2 nanotubes inside the membrane: (a) at the top of the membrane, (b) at the bottom of the membrane, and (c) TiO2 nanotubes after dissolving the membrane. | ||
After the formation of a titania gel inside the AAO membrane, a fraction of the samples was dried overnight at 100 °C to remove water, while the other fraction was annealed for 2 h at 650 °C to form crystalline nanotubes. When silver was deposited inside a membrane after drying at 100 °C, TiO2 nanotubes containing isolated Ag nanoparticles (TiO2–Ag nanotubes) were formed after Ag electrodeposition and subsequent annealing (Fig. 5a). The reason for this is that the Ag+ ions could penetrate the gel, because the titania phase was not completely dense after exposure to 100 °C. As a result, Ag nuclei formed where such ions combined with an electron. During subsequent heat treatment at 650 °C, these Ag nanoparticles were transported to the pore walls along with the collapse of the titania gel.
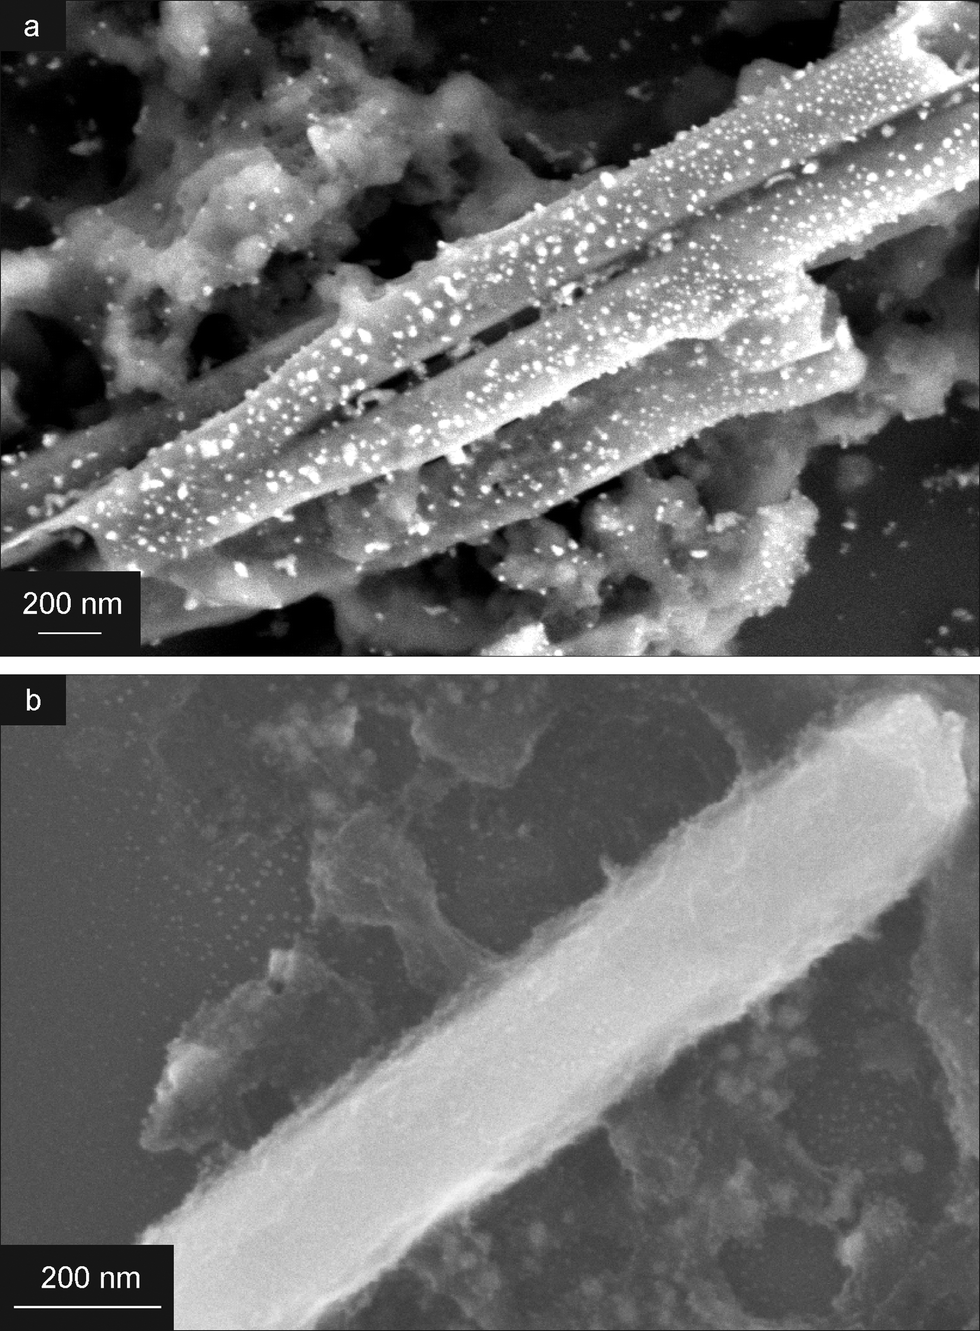 | ||
| Fig. 5 SEM images of (a) TiO2–Ag nanotubes from a two step electrodeposition process with an intermediate TiO2 gel drying at 100 °C, and (b) a coaxial TiO2–Ag nanowire from a two step electrodeposition process with intermediate TiO2 tube solidification at 650 °C. See the main text for details. | ||
However, when Ag was electrodeposited after high temperature annealing of the TiO2 gel at 650 °C, solid TiO2 nanotubes formed first, and dense silver nanowires were deposited inside these tubes. This resulted in the formation of coaxial TiO2–Ag nanowires (Fig. 5b and 6).
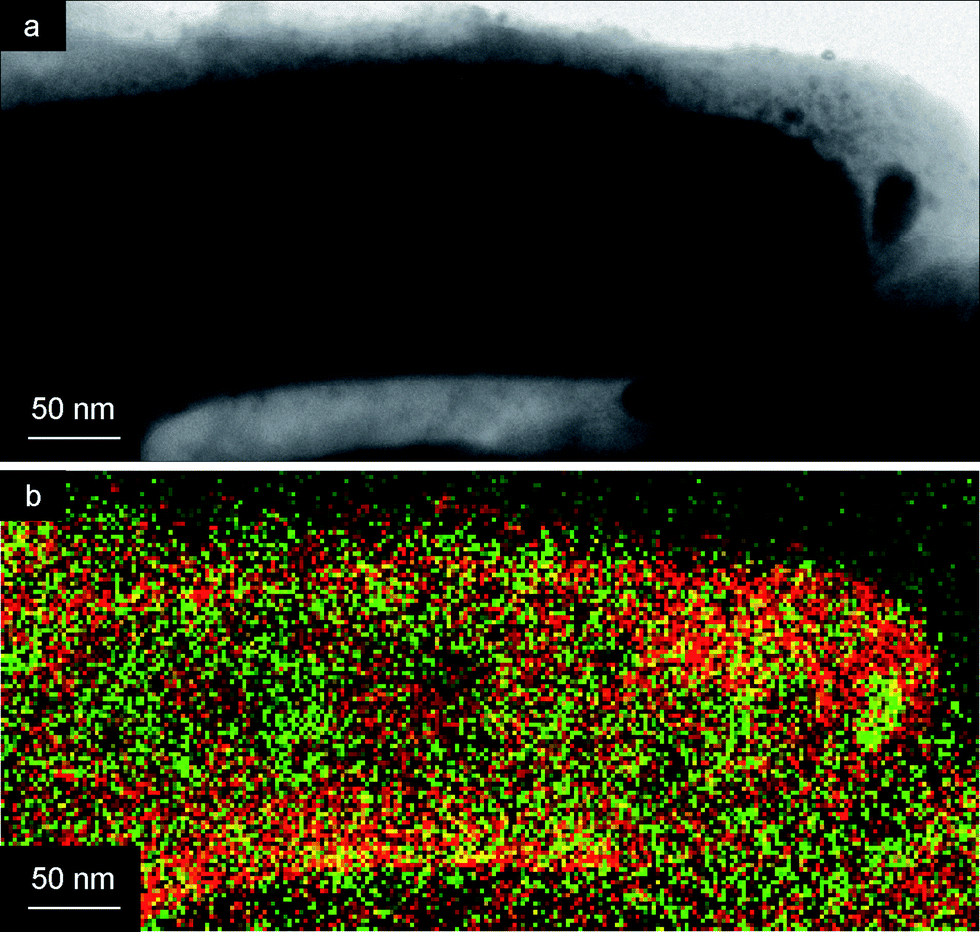 | ||
| Fig. 6 (a) TEM image and (b) EELS TEM map of a TiO2 nanotube (red) filled with Ag (green). | ||
The TEM image of a TiO2 nanotube with a Ag core is shown in Fig. 6a. Especially the Electron Energy Loss Spectroscopy (EELS) TEM map in Fig. 6b clearly shows the architecture of the core–shell structure, with a higher concentration of Ti (red) at the outside of the coaxial nanowire, and a higher concentration of Ag (green) at the interior of the tube.
The photocatalytic activities in photocatalytic water splitting of coaxial TiO2–Ag nanowires, empty TiO2 nanotubes and TiO2–Ag nanotubes with isolated Ag nanoparticles are compared in Fig. 7a after 3.5 h of irradiation. The coaxial TiO2–Ag nanowires formed significantly more H2 than the TiO2 nanotubes and the TiO2–Ag nanotubes. H2 formation was absent in the reference reactor containing aqueous 1 M NaOH solution. Only the intensity of the H2 signals from the coaxial TiO2–Ag nanowires was sufficient for automatic integration, so for this system a long-term measurement was performed (Fig. 7b). Continuous H2 formation was observed for a period of 6 h at a rate of 6.2 ± 1.5 × 10⁻⁶ mol h−1, after which the reaction was terminated.
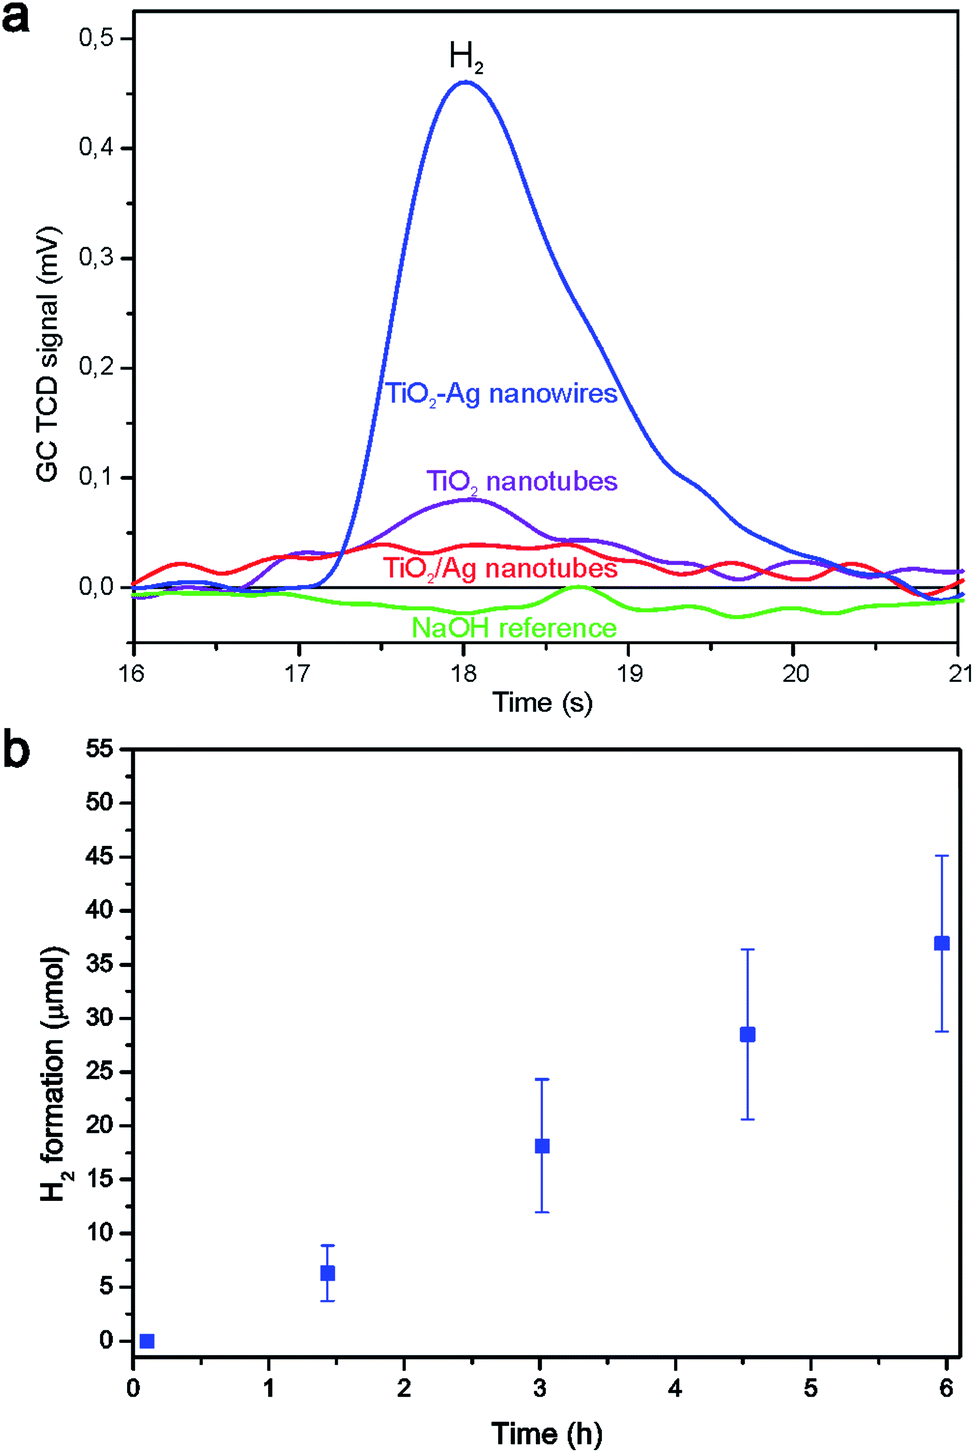 | ||
| Fig. 7 (a) GC TCD peaks showing H2 formation from TiO2 nanotubes (purple line), TiO2/Ag nanotubes (red line), TiO2–Ag nanowires (blue line) and NaOH baseline (green line). (b) Moles of H2 formed from coaxial TiO2–Ag nanowires during 6 h measurement in 1 M NaOH. | ||
Several possible explanations can be given for the higher H2 formation rate by the coaxial TiO2–Ag nanowires compared to the TiO2 nanotubes: (1) the availability of an H2 evolution catalyst such as Ag, which decreases the chance for electron–hole recombination, (2) the use of the metallic Ag core as a mirror to reflect photons back into the TiO2 shell, which could approximately double the number of photons captured by the photocatalyst, and/or (3) the use of the Ag core for enhancement of the light absorption due to localized surface plasmon resonance of the Ag nanowire.
Comparing the TiO2/Ag nanotubes with the coaxial nanowires, several possible explanations can be given for the higher H2 formation rate of the latter: (1) the availability of a larger amount of Ag catalyst with an increased interface between the photocatalyst and H2 evolution catalyst, which shortens the electron diffusion length and decreases the chance for electron–hole recombination in the coaxial nanowires, and/or (2) since most of the Ag particles are located at the outside of the TiO2 nanotubes, these particles may prevent some of the photons from reaching the TiO2 phase which decreases the efficiency of this system. It is however unlikely that the second possibility alone can explain the large difference.
For comparison with other data from the literature, the observed H2 formation rate was corrected for either the weight of nanowires that was put in solution or the initial surface area of the template, resulting in an H2 formation rate of 1.2 × 10⁻³ ± 0.3 × 10⁻³ mol g−1 h−1 and 0.18 × 10⁻⁶ ± 0.04 × 10⁻⁶ mol cm−2 h−1, respectively. As can be seen from Table 1, this was higher than what we measured previously using segmented ZnO|Ag nanowires, where H2 formation at a rate of 6.9 × 10⁻⁶ mol g−1 h−1 was observed.1 Especially the increased surface area between the photocatalytic oxide phase and the H2 evolution catalyst, and the shorter diffusion length for electrons to cross the oxide–metal junction are likely explanations for the difference of ∼3 orders of magnitude. Obviously, the use of different photocatalytic materials and the fact that methanol was used as the hole scavenger by the ZnO|Ag nanowires also influence the efficiency.
| Nanowire/tube system | Ref. | H2 formation mol g−1 h−1 | H2 formation mol cm−2 h−1 | Dimensions diameter (TiO2 thickness) × length | Electrolyte | Light source |
|---|---|---|---|---|---|---|
| Coaxial TiO2–Ag nanowires | This work | 1.2 × 10⁻³ | 0.18 × 10⁻⁶ | 200 nm (10–50 nm) × 40 μm | 1.0 M NaOH | 10 W Hg lamp |
| Coaxial TiO2–Ag nanowires by ALD | This work | 0.26 × 10⁻³ | 175 nm (20 nm) × 8 μm | 1.0 M NaOH | 10 W Hg lamp | |
| Segmented Ag|ZnO nanowires | 1 | 6.9 × 10⁻⁶ | 200 nm × 6 μm | 4![[thin space (1/6-em)]](https://www.rsc.org/images/entities/char_2009.gif) :1 v/v MeOH/H2O :1 v/v MeOH/H2O |
60 W Hg lamp | |
| Anodized TiO2 with Pt mesh counter electrode | 14 | 2.83 × 10⁻³ | 60 nm (10 nm) × 1.5 μm | 0.01 M KOH, 1.0 mM KI | 400 W Hg lamp | |
| Anodized TiO2 with Pt counter electrode in the second compartment | 15 | 97 × 10−6 | 75 nm (20–70 nm) × 6 μm | 1.0 M KOH | 350 W Xe lamp | |
| Anodized TiO2 containing evaporated Pt | 29 | 14 × 10−6 | 150 nm (30 nm) × 650 nm | 0.01 M KOH, 1.0 mM KI | 400 W metal hydride lamp |
We also compared the H2 formation rate from the coaxial TiO2–Ag nanowires with an alternative coaxial TiO2–Ag nanowire system in which the TiO2 phase was prepared by Atomic Layer Deposition (ALD), and the Ag phase by electrodeposition. The SEM image of TiO2 nanotubes made by ALD is shown in Fig. 8. Compared to the SEM image in Fig. 4c, the nanotubes made by both techniques have approximately the same dimensions, but the nanotubes made by ALD appear much smoother. It was confirmed by XRD that the TiO2 nanotubes made by ALD are also polycrystalline without preferred orientation, the difference being that they are composed of large anatase crystallites with a size of 250–300 nm as shown in ref. 62. Using the same setup for photocatalytic water splitting, we found a H2 formation rate of 0.26 × 10⁻³ mol g−1 h−1 for the ALD-based system, which is ∼4.7 times lower than the rate found for the electrochemically deposited TiO2–Ag system and also lower than the TiO2 nanotubes without Ag. Since the TiO2 nanotubes deposited by ALD were polycrystalline anatase with a larger crystallite size, it was expected a priori that the photocatalytic activity of these nanowires would be higher, since the concentration of grain boundaries that can enhance undesired electron–hole recombination is lower. On the other hand, it is known that photocatalytic water splitting is more efficient on specific facets, so when these facets are not exposed to the solution this will lead to a lower H2 evolution rate. Of course, the different TiO2 polymorphs that were observed in both systems, purely anatase for the ALD-based system vs. a mixture of anatase, rutile and brookite for the system prepared via the electrochemically induced sol–gel method, might also influence the photocatalytic activity. Also other effects like impurities or secondary phases can have a positive effect on the photocatalytic properties of the electrochemically synthesized system. As listed in Table 1, there are also some other minor differences between the two systems in nanowire length, diameter and TiO2 shell thickness, but it is not expected that these differences alone can explain the large difference in photocatalytic activity.
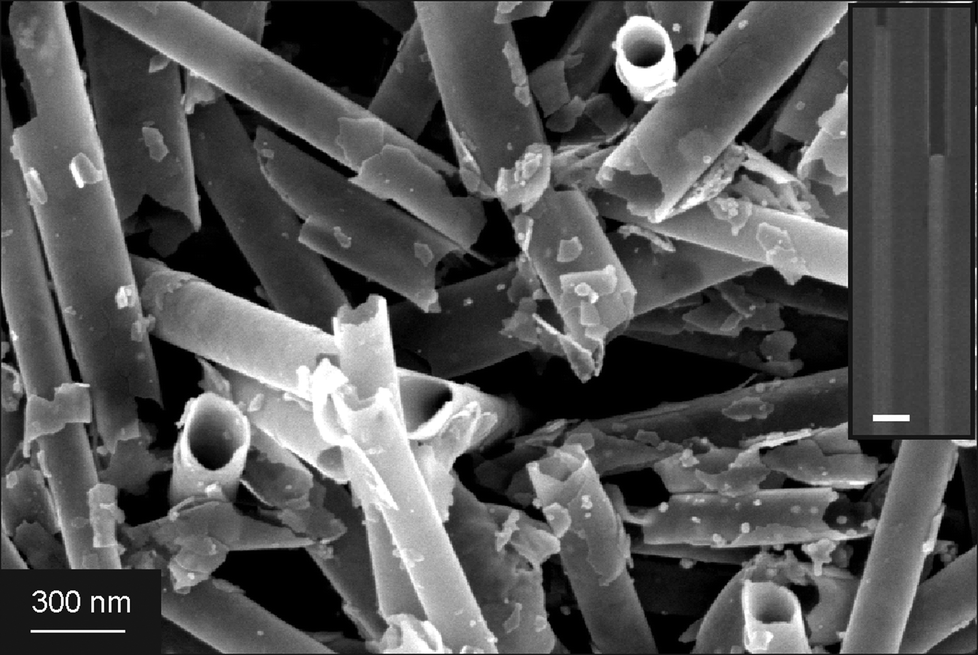 | ||
| Fig. 8 SEM image of TiO2 nanotubes made by ALD before Ag filling, after release from the template. The inset shows coaxial TiO2–Ag nanowires inside the membrane, where the TiO2 phase is visible as a bright white phase covering the pore walls at the top of the figure, and the Ag phase is visible as a solid nanowire at the bottom of the figure. | ||
Only a few other publications report H2 evolution from TiO2 nanotubes, and these are listed in Table 1. The geometries and process conditions vary widely between these studies, so that direct comparison of these data should be done with care. Besides one other publication on hydrogen evolution by autonomous nanowires in methanol,1 all other studies involve photoelectrochemical cells with compositionally distinct, and in some cases spatially separated, hydrogen and oxygen evolution catalysts. Only one publication reports the H2 evolution rate per weight of used material for TiO2 nanotubes, resulting in an evolution rate of 2.83 × 10⁻³ mol g−1 h−1 H2.14 This is a factor of 2.3 higher than our current result, and it might be explained by the difference in crystallinity of TiO2, as anodization can result in the formation of single crystalline TiO2 nanotubes, while polycrystalline TiO2 nanotubes were made in the current research. Two other main differences are that a light source with higher energy is used in ref. 14, and that an IO3−/I− redox couple was used as a redox mediator to prevent the recombination of H2 and O2 into H2O. Both these differences also drastically influence the H2 evolution rate.
Others calculated the H2 formation rate per unit surface area of the anodized Ti foil, resulting in H2 formation rates of 97 × 10−6 mol cm−2 h−1,15 and 14 × 10−6 mol cm−2 h−1,29 which are both much higher than our current result using coaxial TiO2–Ag nanowires made via the electrochemically induced sol–gel method. Part of this difference may be explained by the different methods used to measure the surface area: the surface area of the AAO template before dissolution vs. the anodized surface area of the Ti foil. Both authors used Pt as a counter electrode15 or as a thin layer on top of the nanotubes for enhanced photocatalytic activity.29 Also here a light source with higher energy was used in both studies and an IO3−/I− redox couple was used as a redox mediator in one of the two studies to prevent the recombination of H2 and O2 into H2O.29 Another method to prevent the recombination of H2 and O2 is to split the electrodes in a two-compartment setup.15 On the other hand, even though efficiencies could be increased by preventing H2 and O2 recombination, we have shown that coaxial TiO2–Ag nanowires are able to split water autonomously without addition of sacrificial agents, redox mediators or external power supply. This can be of advantage for self-fuelling nanodevices in aqueous environments or to generate H2 at a specific location.
Next to the possible explanation of different crystallinity, the use of redox mediators and two-compartment setups, it is still difficult to directly compare these results, because every author uses different light sources and electrolytes that both have a large impact on the efficiency for H2 formation. In that respect, a better way for comparison would be to keep the nanowires attached to the substrate for photocurrent measurements. Also the applied potential should be compensated for the reference electrode and pH of the solution, as illustrated by Seabold and Choi.63 Unfortunately, with the AAO templates available for this study, it was not possible to keep the nanotubes or nanowires standing on the substrate after dissolving the template because the nanowire/nanotube connection to the bottom was mechanically too weak. Additionally, standardized simulated AM1.5 solar illumination with an energy of 100 mW cm−2 should be used in all measurements, but unfortunately these solar simulators are expensive and not available in every lab.
Several strategies can be pursued to further improve the activity and H2 formation rate. One of these strategies includes changing the alkaline electrolyte for water splitting to either an acidic or neutral electrolyte.30 The second method includes the use of a sacrificial agent, e.g. methanol, or a redox mediator, e.g. KI, to increase the H2 formation rate.26,64–66 As a third option, the activity for water splitting can be improved by adding an oxidation catalyst, e.g. Mn3O4, for more efficient O2 formation. In the fourth method, the dimensions of the coaxial TiO2–Ag nanowires could be changed in order to find an optimum in total diameter, TiO2 shell thickness and nanowire length. These methods should be systematically investigated in future research.
Experimental
All chemicals were purchased from commercial sources and used without further purification. Titanium oxysulfate (TiOSO4, synthesis grade), hydrogen peroxide (H2O2, 35 wt%), boric acid (H3BO3, purity 99.97%), sodium hydroxide (NaOH, purity >98%) and titanium(IV) isopropoxide (99%) were purchased from Sigma-Aldrich. Silver nitrate (AgNO3, purity >99%), nitric acid (HNO3, 65%), potassium nitrate (KNO3, purity >99%), chromium(VI) oxide (CrO3, purity 99.5%) and phosphoric acid (H3PO4, >85%) were purchased from Acros Organics. Oxalic acid (C2H2O4, p.a. grade) was purchased from Merck Millipore. Silver sulfate (Ag2SO4, purity 99.999%), diammonium citrate (purity >99%) and potassium thiocyanide (KSCN, purity 98%) were purchased from Alfa Aesar. Milli-Q water with a resistivity of 18.2 MΩ cm was used in all experiments.Anodized aluminium oxide (AAO) membranes and templates with a pore diameter of 200 nm were either purchased commercially (Anopore®, Whatman Inc.) or custom-made. The commercial AAO membranes contained open pores on both sides and are therefore referred to as “membrane” in the text. A back electrode of AuPd was sputtered on one side of the commercial membranes as a cathode using a tabletop sputterer (SC7640, Quorum Technologies). Prior to deposition, the backside of the AuPd electrode was isolated to ensure exclusive deposition inside the pores of the membrane and avoid deposition on the external surface of the back electrode.
The custom-made AAO templates (referred to as “template”) contained self-ordered arrays of aligned cylindrical pores with narrow diameter distribution and are closed on one side. Self-ordered AAO was prepared by two-step anodization following procedures introduced by Masuda et al.67 In the first step, an Al chip (Goodfellow, purity >99.999%) was anodized at 195 V for 10 h using 1 wt% H3PO3 cooled to 0–1 °C as the electrolyte solution. The resulting porous alumina layer was selectively removed by etching with an aqueous solution of 0.18 M CrO3 and 0.72 M H3PO4. As a result, patterned Al substrates with hexagonal arrays of indentations were obtained. In the second step, hierarchical pores consisting of macroporous segments branching into dendritic mesopores were obtained by adapting a method introduced by Nielsch et al.68 Using 1 wt% H3PO4 at 0–1 °C as the electrolyte solution, the anodization voltage U(t) was directly reduced from 195 V to 80 V according to
| U(t) = U0e−t/τ, | (5) |
The AAO membranes and templates were used as working electrodes in a three electrode setup, with a Pt sheet (Metrohm Autolab) as the counter electrode and Ag/AgCl in 3 M KCl (Metrohm Autolab) as the reference electrode. All potentials are given with respect to the reference electrode. These electrodes were connected to an Autolab PGSTAT 128N potentiostat. TiO2 nanotubes were formed from an electrolyte containing 0.02 M TiOSO4, 0.03 M H2O2, 0.05 M HNO3 and 0.25 M KNO3 with a pH of 1.4. Deposition occurred at −1.00 V for 6 h. After deposition, the gel was either dried overnight at 100 °C or annealed for 2 h at 650 °C in a tube furnace. Ag was electrodeposited for 15 min at +0.10 V in an aqueous electrolyte containing 0.20 M AgNO3 and 0.10 M H3BO3 with pH adjusted to 1.5 using HNO3. In the final steps, the nanowires or nanotubes were collected by dissolving the AAO membranes or templates in an aqueous solution of 1 M NaOH or in an aqueous solution of 0.18 M CrO3 and 0.72 M H3PO4, respectively, followed by detachment from the back electrode by gentle swirling. In order to eliminate the NaOH or CrO3 in the nanowire/nanotube solution, the solution was washed at least 5 times with water using a Hermle Z36HK centrifuge at 10000 rpm for 5 min.
The TiO2 nanotubes made by Atomic Layer Deposition (ALD) were also prepared inside custom-made AAO membranes with the same dimensions as the templates used for TiO2 nanotube formation by the electrochemically induced sol–gel method. Amorphous TiO2 was deposited at 120 °C using titanium(IV) isopropoxide preheated at 70 °C as the metal containing reactant and water vapor as the oxygen source. The porous membranes were coated using the exposure-mode sequence due to the high aspect ratio of these nanostructures, where a full ALD cycle consisted of 2 s pulse, 40 s exposure and 60 s purging for the titanium precursor, followed by 0.5 s pulse, 40 s exposure, and 60 s purging for the water vapor. Dried Ar was used as the carrier and purging gas and the process was carried out in a commercial ALD reactor SAVANNAH 100 (Cambridge NanoTech Inc., USA). After thermal annealing for 3 h at 400 °C and Au sputtering, Ag was electrodeposited at −1.2 V in a two-electrode setup using Pt as the counter electrode from an aqueous electrolyte containing 0.027 M Ag2SO4, 0.88 M diammonium citrate and 1.08 M KSCN at pH 4.5. The procedures used for dissolution of the AAO membrane and washing were the same as above.
Samples were measured with X-ray powder diffraction (XRD) to confirm the formation of crystalline TiO2 phases in the membranes using a PANalytical X'Pert Pro (PANalytical B.V., Almelo, The Netherlands) instrument. Samples were measured from 2θ = 20–50°, with step sizes of 0.026° and 600 s per step using a PIXcel 1D scanning line detector. The spectra were further analyzed using the X'Pert Highscore Plus software package (version 3.0e). Scanning Electron Microscopy (SEM) images were taken using a Zeiss HR-LEO 1550 FEG SEM or a Zeiss Merlin HRSEM. Transmission Electron Microscopy (TEM) images and Electron Energy Loss Spectroscopy (EELS) maps were taken with an Analytical TEM from FEI Instruments.
The photocatalytic activity of TiO2 nanotubes with and without the Ag core was investigated by water splitting experiments in a custom-made setup consisting of 8 top-illuminated reactors with a volume of 36.4 mL each, connected to a Compact gas chromatograph (GC) (Interscience BV) equipped with a thermal conductivity detector (TCD). 5–14 mg of nanotubes/wires (1 completely filled AAO template with a diameter of ∼3.5 cm) was dispersed in 15 mL of a 1 M NaOH stock solution (pH 13) that was bubbled with Ar gas for at least 30 min to remove a large part of the O2 from the solution. Then the reactors were evacuated to 3 mbar and subsequently filled with Ar to remove all air from the head space in the reactors. After three evacuations, a 120 Watt high pressure Mercury lamp (Dr Gröbel UV-Elektronik GmbG) was turned on, of which the emission was divided over 12 optical fibers. During illumination, the formed H2 was measured subsequently in each reactor. In a standard procedure, the composition in each reactor was measured every 15 min for 13 times. In a long-term measurement, the formed H2 gas was measured 5 times using a measurement interval of 1.5 h.
Conclusions
The electrochemically induced sol–gel method was used to prepare anatase TiO2 nanotubes in AAO membranes and templates with a diameter of 200 nm. By varying the intermediate thermal annealing process of the titania gel phase, the location where Ag deposited during the subsequent electrodeposition step in the same template could be tuned. Intermediate heating at 100 °C resulted in the formation of Ag nanoparticles incorporated in the shell of the TiO2 nanotubes, while thermal annealing at 650 °C led to TiO2 nanotubes filled with a continuous Ag phase, thus forming coaxial TiO2–Ag nanowires. These coaxial TiO2–Ag nanowires showed improved photocatalytic activity for direct water splitting due to the favorable geometry of core–shell systems, which is characterized by a large contact area between the photoactive material (TiO2) and the H2 evolution catalyst (Ag), photon reflection by the Ag core to capture the maximum number of photons in the titania phase, and short diffusion paths from the TiO2 phase to the Ag phase in order to separate the exciton efficiently. During a long-term experiment, H2 was formed at a rate of 1.2 × 10⁻³ mol g−1 h−1 for at least 6 h.This technique is not only limited to the formation of TiO2–Ag nanowires, but basically any combination of core–shell materials can be envisaged as long as electrodeposition or a related technique results in the formation of a nanotube for the shell material and a nanowire for the core material. Just as the choice of materials is not limited to what is described in this paper, also the possible applications are not limited to photocatalysis, but they can be extended to other areas, e.g. solar cells and batteries.
Acknowledgements
Financial support from the Chemical Sciences division of the Netherlands Organization for Scientific Research (NWO-CW) is gratefully acknowledged. Financial support from the center of excellence SFB 986 on Tailor-made Multi Scale Materials Systems funded by the German Science Foundation (DFG) is also gratefully acknowledged by JMMM and KN. C. Hess and H. Tobergte (University of Osnabrück) are gratefully acknowledged for the production of AAO templates used in this research; Chieh-Chao Yang and Rogier Besselink (University of Twente) are gratefully acknowledged for their help.Notes and references
- A. W. Maijenburg, E. J. B. Rodijk, M. G. Maas, M. Enculescu, D. H. A. Blank and J. E. ten Elshof, Small, 2011, 7, 2709–2713 CrossRef CAS PubMed.
- Y. W. Heo, D. P. Norton, L. C. Tien, Y. Kwon, B. S. Kang, F. Ren, S. J. Pearton and J. R. Laroche, Mater. Sci. Eng., R, 2004, 47, 1–47 CrossRef PubMed.
- R. Fan, R. Karnik, M. Yue, D. Li, A. Majumdar and P. Yang, Nano Lett., 2005, 5, 1633–1637 CrossRef CAS PubMed.
- F. Patolsky, G. Zheng and C. M. Lieber, Anal. Chem., 2006, 78, 4260–4269 CrossRef CAS.
- C. D. Keating and M. J. Natan, Adv. Mater., 2003, 15, 451–454 CrossRef CAS.
- L. A. Bauer, D. H. Reich and G. J. Meyer, Langmuir, 2003, 19, 7043–7048 CrossRef CAS.
- J. Wang, J. Mater. Chem., 2008, 18, 4017–4020 RSC.
- W. F. Paxton, S. Sundararajan, T. E. Mallouk and A. Sen, Angew. Chem., Int. Ed., 2006, 45, 5420–5429 CrossRef CAS PubMed.
- Y. Wang, R. M. Hernandez, D. J. Bartlett Jr, J. M. Bingham, T. R. Kline, A. Sen and T. E. Mallouk, Langmuir, 2006, 22, 10451–10456 CrossRef CAS PubMed.
- J. Wang, ACS Nano, 2009, 3, 4–9 CrossRef CAS PubMed.
- T. S. Kang, A. P. Smith, B. E. Taylor and M. F. Durstock, Nano Lett., 2009, 9, 601–606 CrossRef CAS PubMed.
- M. Z. Hu, P. Lai, M. S. Bhuiyan, C. Tsouris, B. Gu, M. Parans Paranthaman, J. Gabitto and L. Harrison, J. Mater. Sci., 2009, 44, 2820–2827 CrossRef CAS.
- J. Jitputti, Y. Suzuki and S. Yoshikawa, Catal. Commun., 2008, 9, 1265–1271 CrossRef CAS PubMed.
- E. Y. Kim, J. H. Park and G. Y. Han, J. Power Sources, 2008, 184, 284–287 CrossRef CAS PubMed.
- Y. Sun, G. Wang and K. Yan, Int. J. Hydrogen Energy, 2011, 36, 15502–15508 CrossRef CAS PubMed.
- P. E. De Jongh, D. Vanmaekelbergh and J. J. Kelly, J. Electrochem. Soc., 2000, 147, 486–489 CrossRef CAS PubMed.
- C. J. Engel, T. A. Polson, J. R. Spado, J. M. Bell and A. Fillinger, J. Electrochem. Soc., 2008, 155, F37–F42 CrossRef CAS PubMed.
- S. Sunkara, V. K. Vendra, J. H. Kim, T. Druffel and M. K. Sunkara, Catal. Today, 2013, 199, 27–35 CrossRef CAS PubMed.
- Z. Zhang, R. Dua, L. Zhang, H. Zhu, H. Zhang and P. Wang, ACS Nano, 2013, 7, 1709–1717 CrossRef CAS PubMed.
- R. Van De Krol, Y. Liang and J. Schoonman, J. Mater. Chem., 2008, 18, 2311–2320 RSC.
- A. Kudo and Y. Miseki, Chem. Soc. Rev., 2009, 38, 253–278 RSC.
- T. Bak, J. Nowotny, M. Rekas and C. C. Sorrell, Int. J. Hydrogen Energy, 2002, 27, 991–1022 CrossRef CAS.
- A. Fujishima and K. Honda, Nature, 1972, 238, 37–38 CrossRef CAS.
- R. Abe, J. Photochem. Photobiol., C, 2010, 11, 179–209 CrossRef CAS PubMed.
- P. Roy, D. Kim, K. Lee, E. Spiecker and P. Schmuki, Nanoscale, 2010, 2, 45–59 RSC.
- D. Eder, M. Motta and A. H. Windle, Nanotechnology, 2009, 20, 055602 CrossRef CAS PubMed.
- C. J. Lin, Y. T. Lu, C. H. Hsieh and S. H. Chien, Appl. Phys. Lett., 2009, 94, 113102 CrossRef PubMed.
- Y. Lin, S. Zhou, X. Liu, S. Sheehan and D. Wang, J. Am. Chem. Soc., 2009, 131, 2772–2773 CrossRef CAS PubMed.
- W. Nam and G. Y. Han, J. Chem. Eng. Jpn., 2007, 40, 266–269 CrossRef CAS.
- A. Wolcott, W. A. Smith, T. R. Kuykendall, Y. Zhao and J. Z. Zhang, Small, 2009, 5, 104–111 CrossRef CAS PubMed.
- Y. Hong, M. Diaz, U. M. Córdova-Fteueroa and A. Sen, Adv. Funct. Mater., 2010, 20, 1568–1576 CrossRef CAS.
- M. G. Hosseini, M. M. Momeni and M. Faraji, Electroanalysis, 2010, 22, 2620–2625 CrossRef CAS.
- L. Xing, J. Jia, Y. Wang, B. Zhang and S. Dong, Int. J. Hydrogen Energy, 2010, 35, 12169–12173 CrossRef CAS PubMed.
- A. R. Armstrong, G. Armstrong, J. Canales and P. G. Bruce, J. Power Sources, 2005, 146, 501–506 CrossRef CAS PubMed.
- B. L. He, B. Dong and H. L. Li, Electrochem. Commun., 2007, 9, 425–430 CrossRef CAS PubMed.
- C. M. Park, W. S. Chang, H. Jung, J. H. Kim and H. J. Sohn, Electrochem. Commun., 2009, 11, 2165–2168 CrossRef CAS PubMed.
- R. Yoshida, Y. Suzuki and S. Yoshikawa, J. Solid State Chem., 2005, 178, 2179–2185 CrossRef CAS PubMed.
- S. P. Albu, A. Ghicov, S. Berger, H. Jha and P. Schmuki, Electrochem. Commun., 2010, 12, 1352–1355 CrossRef CAS PubMed.
- W. Jun and L. Zhiqun, J. Phys. Chem. C, 2009, 113, 4026–4030 Search PubMed.
- S. Li, G. Zhang, D. Guo, L. Yu and W. Zhang, J. Phys. Chem. C, 2009, 113, 12759–12765 CAS.
- M. S. Sander, M. J. Côté, W. Gu, B. M. Kile and C. P. Tripp, Adv. Mater., 2004, 16, 2052–2057 CrossRef CAS.
- C. Bae, Y. Yoon, H. Yoo, D. Han, J. Cho, B. H. Lee, M. M. Sung, M. Lee, J. Kim and H. Shin, Chem. Mater., 2009, 21, 2574–2576 CrossRef CAS.
- S. Inoue, S. Z. Chu, K. Wada, D. Li and H. Haneda, Sci. Technol. Adv. Mater., 2003, 4, 269–276 CrossRef CAS.
- Z. Ye, H. Liu, I. Schultz, W. Wu, D. G. Naugle and I. Lyuksyutov, Nanotechnology, 2008, 19, 325303 CrossRef PubMed.
- S. J. Limmer, S. Seraji, Y. Wu, T. P. Chou, C. Nguyen and G. Z. Cao, Adv. Funct. Mater., 2002, 12, 59–64 CrossRef CAS.
- Y. Lin, G. S. Wu, X. Y. Yuan, T. Xie and L. D. Zhang, J. Phys.: Condens. Matter, 2003, 15, 2917–2922 CrossRef CAS.
- S. Liu and K. Huang, Sol. Energy Mater. Sol. Cells, 2005, 85, 125–131 CAS.
- X. Y. Zhang, L. D. Zhang, W. Chen, G. W. Meng, M. J. Zheng, L. X. Zhao and F. Phillipp, Chem. Mater., 2001, 13, 2511–2515 CrossRef CAS.
- Z. Miao, D. Xu, J. Ouyang, G. Guo, X. Zhao and Y. Tang, Nano Lett., 2002, 2, 717–720 CrossRef CAS.
- X. J. Wu, F. Zhu, C. Mu, Y. Liang, L. Xu, Q. Chen, R. Chen and D. Xu, Coord. Chem. Rev., 2010, 254, 1135–1150 CrossRef CAS PubMed.
- J. M. Macak, B. G. Gong, M. Hueppe and P. Schmuki, Adv. Mater., 2007, 19, 3027–3031 CrossRef CAS.
- C. Natarajan and G. Nogami, J. Electrochem. Soc., 1996, 143, 1547–1550 CrossRef CAS PubMed.
- S. Karuppuchamy, D. P. Amalnerkar, K. Yamaguchi, T. Yoshida, T. Sugiura and H. Minoura, Chem. Lett., 2001, 78–79 CrossRef CAS.
- S. Karuppuchamy, K. Nonomura, T. Yoshida, T. Sugiura and H. Minoura, Solid State Ionics, 2002, 151, 19–27 CrossRef CAS.
- S. A. Kumar, P. H. Lo and S. M. Chen, Nanotechnology, 2008, 19, 255501 CrossRef PubMed.
- M. G. Maas, E. J. B. Rodijk, W. Maijenburg, J. E. ten Elshof and D. H. A. Blank, in Multifunction at the Nanoscale through Nanowires, ed. K. Nielsch, A. Fontcuberta, I. Morral, J. K. Holt and C. V. Thompson, Materials Research Society, Pittsburg, 2010, pp. M01–08 Search PubMed.
- J. Sekulić, J. E. ten Elshof and D. H. A. Blank, Adv. Mater., 2004, 16, 1546–1550 CrossRef.
- V. Lyahovitskaya, Y. Feldman, I. Zon, A. Yoffe and A. I. Frenkel, J. Mater. Res., 2012, 27, 2819–2828 CrossRef CAS.
- A. Di Paola, G. Cufalo, M. Addamo, M. Bellardita, R. Campostrini, M. Ischia, R. Ceccato and L. Palmisano, Colloids Surf., A, 2008, 317, 366–376 CrossRef CAS PubMed.
- A. M. Luís, M. C. Neves, M. H. Mendonça and O. C. Monteiro, Mater. Chem. Phys., 2011, 125, 20–25 CrossRef PubMed.
- C. A. Grimes and G. K. Mor, in TiO2 nanotube arrays: Synthesis, properties and applications, Springer, Dordrecht Heidelberg London New York, 2009, pp. 149–216 Search PubMed.
- M. Kim, C. Bae, H. Kim, H. Yoo, J. M. Montero Moreno, H. S. Jung, J. Bachmann, K. Nielsch and H. Shin, J. Mater. Chem. A, 2013, 1, 14080–14088 CAS.
- J. A. Seabold and K. S. Choi, J. Am. Chem. Soc., 2012, 134, 2186–2192 CrossRef CAS PubMed.
- R. Abe, K. Sayama and H. Arakawa, Chem. Phys. Lett., 2003, 371, 360–364 CrossRef CAS.
- R. Abe, K. Sayama, K. Domen and H. Arakawa, Chem. Phys. Lett., 2001, 344, 339–344 CrossRef CAS.
- K. Lee, W. S. Nam and G. Y. Han, Int. J. Hydrogen Energy, 2004, 29, 1343–1347 CrossRef CAS PubMed.
- H. Masuda, K. Yada and A. Osaka, Jpn. J. Appl. Phys., Part 2, 1998, 37, L1340–L1342 CrossRef.
- K. Nielsch, F. Müller, A. P. Li and U. Gösele, Adv. Mater., 2000, 12, 582–586 CrossRef CAS.
| This journal is © The Royal Society of Chemistry 2014 |