 Open Access Article
Creative Commons Attribution 3.0 Unported Licence
Biocomposites from hydrolyzed waste proteinaceous biomass: mechanical, thermal and moisture absorption performances
Tizazu Mekonnena, Paolo Mussonea, Kirill Alemaskinc, Lisa Sopkowc, John Wolodkoc, Phillip Choib and David Bressler*a
aBiorefining Conversions and Fermentations Laboratory, University of Alberta, Edmonton, AB T6G 2P5, Canada. E-mail: david.bressler@ales.ualberta.ca; Fax: +1 780-492-4265; Tel: +1 780-492-4986
bDepartment of Chemical and Materials Engineering, University of Alberta, Edmonton, AB T6G 2V4, Canada
cAdvanced materials group, Alberta Innovates Technology Futures, Edmonton, AB T6N 1E4, Canada
First published on 18th September 2013
Abstract
The main goal of this research is maximizing the utilization of renewable materials in both the matrix and reinforcement, more importantly exploitation of waste material for biocomposite development and evaluating the mechanical, thermal and water resistance performances. Woven roving and chopped strand mat fiber glass, and hemp fiber mats are incorporated to an epoxy resin based matrix cured with novel hydrolyzed specified risk material (SRM) extracts. Aminophenyl sulphone (APS) is used as a control crosslinking agent for the epoxy resin. Results show that the biocomposites developed in this research exhibit promising flexural strength, tensile strength and tensile modulus; despite relatively poor moisture resistance. The use of waste protein hydrolyzate extracts, hydrolyzed proteins, as crosslinking agent of epoxy resins in making biocomposites is novel and promising and results can be extended to other proteinaceous biomasses as curing agent of epoxy resins.
1. Introduction
Over the past two decades, substantial research efforts have been devoted to developing technologies to incorporate renewable fibers as reinforcing fillers in polymeric composite materials. The use of natural fibers as a mechanical reinforcement material in place of fiberglass for composite materials has many marked advantages. Low cost, low specific density and high specific strength, natural fibers are renewable material and are less energy intensive to produce (grow) than glass fibers.1 The reduction in fiber density and thus composite density is favorable in certain engineering applications. For instance, biocomposites for automotive parts where vehicle weight and fuel economy are often a concern, lower density is very desirable.2 Moreover, glass fibers are abrasive to tooling and can cause irritation and discomfort to personnel during manufacturing.3 Thus, natural fibers such as hemp and flax fibers can potentially compete with E-glass fibers, which serve as a reference because of their great importance in composite technology.4Considerable progress has resulted in a broad range of polymeric matrices reinforced with plant fibers such as hemp, jute, bamboo, flax and sisal that are now commercially available.5,6 During the same period, concerns about the growing environmental footprint and dwindling availability of fossil fuels reserves have driven research and development aimed at developing biodegradable polymeric matrices that could be reinforced with natural fibers. Thermosetting and thermoplastic materials have been synthesized using a broad range of biomass feedstock, from starch7 to plant protein8 to animal protein.9 The growth and commercial success of the global bio-based plastic market, which is expected to reach a total production of approximately 3.5 million metric tons in 2020,10 remain challenged by biomass processing challenges and by high feedstock costs.
The outbreaks of bovine spongiform encephalopathy (BSE) have resulted in legislations that limited the use of certain cattle tissue known as specified risk material (SRM) as human or animal foodstuffs or fertilizer applications in Canada, the US and European Union.11–13 While the fats recovered during the rendering process find a market in the oliochemical industry, large quantities of SRM, mainly composed of protein and ash are either presently incinerated or land filled in regulated facilities in some European Union countries, Canada and the US.14 The environmental risks posed by such practices and the associated massive costs have inflicted significant economic stress on the rendering industry with profound ramifications to the whole livestock sector. Such waste animal proteins recovered at rendering facilities presently constitute a low-value commodity that can be used as feedstock for the production of a wide array of renewable materials, including plastics.9,15–17
Our laboratory has recently demonstrated that a thermal hydrolysis protocol for the destruction of BSE prions approved by Canadian Food Inspection Agency (CFIA) and Food and Drug Administration (FDA) of the US can be used as a platform to convert SRM into hydrolyzed protein fragments that can be fractionated for industrial functional utilization.17 These fragments bear reactive functional groups such as primary and secondary amines, hydroxyls, carbonyls and sulfhydryls associated with the side chain of each amino acid or the end of each main hydrolyzed protein chain.9,18 Therefore, the short chain length of the hydrolyzed proteins coupled with the abundant functional group make them a unique crosslinking agent for epoxy resins9 replacing petroleum based crosslinking agents such as diamines to constitute the matrix of biocomposites. As such, the reported toxicity and contact dermatitis19,20 resulting from the residual amines used as hardeners of epoxy resins could be eliminated. Other renewable epoxy co-reactant crosslinkers such as dimerized fatty acids (e.g. pripol 1008, 1009)21,22 and phenalkamine23 prepared from cashew nuts are under investigation. However, cost, some performance limitations and demand for waste utilization motivated for further research of examining alternative curing agents.
The goal of this study was to investigate the compatibility and performance of the renewable thermosetting plastic platform developed in our laboratory with both glass and natural fibers. While the primary aim of this work was to provide technically viable utilization route for SRM in order to mitigate pressing societal and economic issue, it also sought to contribute with information that could lead to a greater understanding of the interaction between hydrophilic natural fibers and hydrophobic polymer matrices. Weak interactions between these two phases often result in poor compatibility.24 The central proposition of this study was that the incorporation of hydrophilic hydrolyzed proteins could improve the hydrophilicity of the epoxy matrix and thus better interaction with natural fibers.
2. Materials and methods
2.1. Materials
Two types of E-glass fiber mats and hemp mat were used as reinforcing fiber mats. The glass fibers were randomly oriented chopped strand mat (CSM) of 450 g m−2 and woven roving (WR) of 200 g m−2, respectively purchased from Ashland Inc. (Ohio, US). Wet laid randomly oriented hemp (HE) mat of 300 g m−2, prepared through in-house filtration method, was obtained from Alberta Innovates Technology Futures, Edmonton, AB. Diglycidyl Ether of Bisphenol A (DGEBA) epoxy resin (Araldite 506 epoxy resin, number average molecular weight <=700 g mol−1), 4-aminophenyl sulphate (APS) (97%, mol wt 248.3 g mol−1) were obtained from Sigma-Aldrich, St. Louise, MO, USA. SRM was exclusively provided by Sanimax Industries, Inc. (Montreal, QC, Canada). SRM samples were hydrolyzed, and proteinaceous fragments extracted and dried in the laboratory according to.17 SRM transportation and receiving were conducted according to Transport of Dangerous Goods (TDG) regulations. Handling and hydrolysis of SRM were conducted according to CFIA protocol.252.2. Methods
2.3. Composite specimen preparation
Polymer baselines without reinforcement were prepared by curing calculated quantities of epoxy resin with curing agents (i.e. hydrolyzed proteins and APS) as shown in Table 1. Prior to curing, the polymer premix was degassed in a vacuum oven for an hour at 100 °C and cured on silicon molds (22.5 cm × 22.5 cm) at 185 °C for four hours9 to make polymer baselines. Fixed 20 vol% pre-cut fiber mats were used to reinforce 80 vol% resin matrix composed of calculated quantities of epoxy resin/curing agent and cured (Table 1). A silicon mold with its bottom covered with polytetrafluoroethylene (PTFE) to prevent sticking of the resin on the mold surface was used to prepare the composites.| Label | Curing agent | Curing agent (wt%) | Epoxy (wt%) | Fiber (vol%) | Resin (vol%) |
|---|---|---|---|---|---|
| a APS20, P20, P30 – 20 wt% APS, 20 wt% and 30 wt% hydrolyzed protein, respectively. | |||||
| APS20 | APS | 20 | 80 | 0 | 100 |
| P20 | Hydrolyzed protein | 20 | 80 | 0 | 100 |
| P30 | Hydrolyzed protein | 30 | 70 | 0 | 100 |
| APS20CSM | APS | 20 | 80 | 20 | 80 |
| P20CSM | Hydrolyzed protein | 20 | 80 | 20 | 80 |
| P30CSM | Hydrolyzed protein | 30 | 70 | 20 | 80 |
| APS20WR | APS | 20 | 80 | 20 | 80 |
| P20WR | Hydrolyzed protein | 20 | 80 | 20 | 80 |
| P30WR | Hydrolyzed protein | 30 | 70 | 20 | 80 |
| APS20HE | APS | 20 | 80 | 20 | 80 |
| P20HE | Hydrolyzed protein | 20 | 80 | 20 | 80 |
| P30HE | Hydrolyzed protein | 30 | 70 | 20 | 80 |
About 20% wt of resin mix was first poured on the PTFE sheet covered mold and spread out with hand rollers. A fiber mat was then applied on the top of the resin and rolled with the hand rollers to allow the resin to soak in the matrix. More resin was poured on top of the mat and distributed evenly with the hand rollers. More layers of fiber mats, depending on the type of fiber, were added by alternating the fiber and the resin layers and squeezing the resin into the fiber with the hand rollers. Finally, another PTFE sheet was placed on the top of the composite sandwich to get good surface finish.
The number of fiber mat layers varied with type of the fiber: three layers of CSM, eight layers of WR, and two layers of HE fiber to keep the volume fraction shown in Table 1. The composite sandwiches were degassed and then transferred to PTFE sheet and then to a French press. The sandwich composites were then pressed at a temperature of 185 °C and clamping pressure of 7 ton for 2 h in the French press to squeeze out trapped air bubbles entrapped in the mat layers and also to overcome springiness of fibers. 20% fiber volume fraction and 3 mm thickness of the plates were achieved by using 3 mm shims and the applied pressure to the plates. Each of the APS/resin and hydrolyzed protein/resin composites were post cured for 2 h at 185 °C and 200 °C, respectively. The prepared polymer sheets and composites were then prepared for property evaluation.
![[thin space (1/6-em)]](https://www.rsc.org/images/entities/char_2009.gif) 000 psi from the prepared polymer and composite sheets. Tensile strength tests were conducted according to ASTM D638-08 (Standard Test Method for Tensile Properties of Plastics)27 with a crosshead speed of 5 mm min−1 on an Instron (Instron 4302, Norwood, MA, USA) equipped with a load cell of 10 kN. The flexural strength and modulus was also measured at a crosshead speed of 1.39 mm min−1 in accordance with ASTM D790-07 (Standard Test Methods for Flexural Properties of Unreinforced and Reinforced Plastics and Electrical Insulating Materials).28 Specimens were conditioned at 23 °C and 50% relative humidity for 48 hours and tested according to the respective ASTM procedures.
000 psi from the prepared polymer and composite sheets. Tensile strength tests were conducted according to ASTM D638-08 (Standard Test Method for Tensile Properties of Plastics)27 with a crosshead speed of 5 mm min−1 on an Instron (Instron 4302, Norwood, MA, USA) equipped with a load cell of 10 kN. The flexural strength and modulus was also measured at a crosshead speed of 1.39 mm min−1 in accordance with ASTM D790-07 (Standard Test Methods for Flexural Properties of Unreinforced and Reinforced Plastics and Electrical Insulating Materials).28 Specimens were conditioned at 23 °C and 50% relative humidity for 48 hours and tested according to the respective ASTM procedures.| Water absorption = ((W2 − W1)/W1) × 100 | (1) |
The long-term water absorption tests, on the other hand were investigated in accordance with ASTM D570-98 method,29 in such a way that the tensile and flexural properties would also be studied after the long-term moisture conditioning. Tensile and flexural bar samples that were dried to constant weight (W1) were immersed in deionized water for 30 days. The extra water on the surface of the soaked samples was then wiped with a clean dry cloth and immediately weighed (W2). The water absorption, tensile and flexural properties were then evaluated in accordance with ASTM D570-98 (ref. 29) (eqn (1)), ASTM D638-08 (ref. 27) and ASTM D790-07,28 respectively.
3. Results and discussion
3.1. Specified risk material hydrolysis and characterization
One method of adding value to SRM that otherwise is an industrial waste is hydrolysis with the aim of breaking down BSE causing prion proteins into short protein chains and peptides.9,15 Studies have shown that thermal hydrolysis mentioned in the method section at a temperature, pressure and time of at least 180 °C, 450 kPa, 40 min, respectively, inactivates BSE causing prions.13,25 The molecular size of representative non-biohazardous unhydrolyzed meat and bone meal (MBM) protein extract and biorefined TH SRM extract studied using gel permeation chromatography (GPC) is presented in Fig. 1.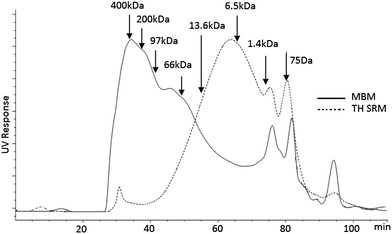 | ||
| Fig. 1 GP-HPLC chromatograms of meat and bone meal (MBM) protein extract prior to hydrolysis and hydrolyzed protein extract of thermal hydrolyzed specified risk material (TH SRM). | ||
The molecular size of unhydrolyzed MBM protein extract was broadly distributed over a wide range of molecular sizes. On the other hand, the hydrolyzed proteins obtained from the hydrolyzed SRM had relatively narrower size distribution. The majority of these hydrolyzates lied below 66 kDa, and the average was about 13 kDa. This showed that the thermal hydrolysis severely chopped the SRM protein molecules into short protein and peptide molecules. Moreover, the narrower molecular size distribution imparted by the hydrolysis offers more uniformity and hence resembling behavior and functionality than a broadly distributed unhydrolyzed protein. Previous works reported that hydrolyzed SRM protein fractions were large enough to possess most of the functional groups of proteins.17 Additionally, the reactivity of the hydrolyzed protein functional groups with glutaraldehyde15 and epoxy resin9 to make thermosetting polymers was also reported.
3.2. Mechanical properties
The mechanical strength of composites is an intrinsic property of the constituents, i.e. reinforcement used, the nature and formulation of the matrix30 and of the nature of the interaction between these two phases.31 Tensile strength and modulus of composites made of epoxy resin cured with 20% APS and 20 and 30% hydrolyzed protein, reinforced with CSM, WR and HE fibers and the respective control matrices are summarized in Fig. 2 and 3. In the following section, the effect of the matrices and reinforcing fibers used on the mechanical properties of the composites are discussed.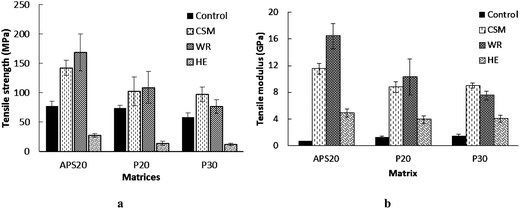 | ||
| Fig. 2 Tensile strength (a) and tensile modulus (b) of 20APS, 20 and 30P based matrices and their counter composites reinforced with CSM, WR and HE fibers reinforced with CSM, WR and HE fibers. | ||
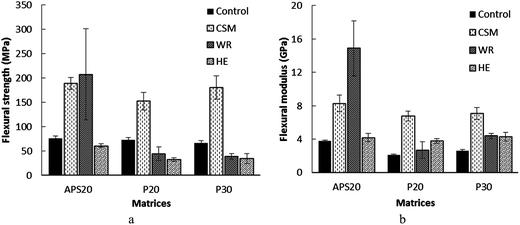 | ||
| Fig. 3 Flexural strength (a) and flexural modulus (b) 20APS, 20 and 30P based matrices and their counter composites reinforced with CSM, WR and HE fibers reinforced with CSM, WR and HE fibers. | ||
The flexural strength of the synthetic and bioresin polymeric matrices (controls) also did not exhibit significant difference (p > 0.05) among each other. Matrices reinforced with CSM resulted in significantly improved flexural strength and modulus of all systems. Nevertheless, the flexural strength of the P20 and P30 polymeric matrices, were significantly reduced with WR and HE reinforcement. This apparent contraction can be attributed to the difference in number of layers (eight) used in the WR mat, compared with the HE and CSM mats (two). As discussed above, this difference was motivated by the choice to maintain constant volume fraction of fibers. The use of such multiple layers obviously resulted in more interfaces between the reinforcement and polymeric matrix. These interfaces are known weak spots between the matrix and reinforcement, and as a result delamination was visually observed when the tensile and flexure bars were machined (Fig. 4(b), (e) and (h)). The delamination occurred as a result of poor bonding and consolidation, resulted in comparatively weak flexural strength of WR reinforced hydrolyzed protein cured polymers (P20WR and P30WR). Improved flexural strength of the composites was observed when synthetic resin was used than the bioresins, which might be due to better interfacial interaction and consolidation. The flexural modulus on the other hand did not change when the resins are changed, with the exception of the WR reinforced polymers.
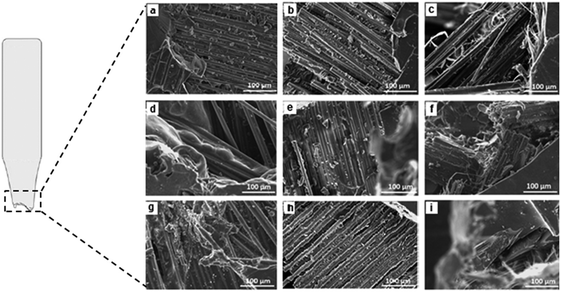 | ||
| Fig. 4 SEM images of fractured surfaces after tensile testing for (a) APS20CSM (b) APS20WR (c) APS20HE (d) P20WR (e) P20WR (f) P20HE (g) P30CSM (h) P30WR (i) P30HE. | ||
The tensile strength of the composite made of APS based matrix and either of the glass fiber mats (WR and CSM) exhibited the highest tensile strength and modulus. Stiffness is closely related to consolidation of the matrix with the reinforcing fillers.31 In all cases studied here, the stiffness of the composites was unanimously improved when compared with the control polymers (Fig. 3b): (1) HE reinforcement improved the modulus of the APS20, P20 and P30 matrix polymers by about 600, 202 and 170%, respectively; (2) WR improved the modulus of APS20, P20 and P30 matrices by 2242, 692 and 400%, respectively; (3) CSM also improved the modulus of APS20, P20 and P30 matrices by 1542, 576, and 500%, respectively.
With respect to flexural property, all reinforcing efforts improved the flexural moduli; despite the improvement by HE is only marginal. CSM improved the flexural strength of all its respective composites; while WR reinforced APS resin (APS20WR) exhibited the highest flexural strength (207.6 MPa). A decrease was observed when WR was compounded with the bioresins (P20 and P30) as a result of delamination of layer of the composite, probably because of poor interfacial adhesion of the smooth woven surface of WR with the hydrolyzed protein based bioresins (P20 and P30). Furthermore, since eight layers of WR were used in all WR based composites, it obviously formed more interfaces with the matrix than the other two (HE and CSM) based composites that used only two layers. It can be anticipated that the interface is the weakest link in comparison to the body of the polymer matrix or the fiber itself that results in failure under external force. Thus, the use of eight layer mats in WR reinforcement that resulted in formation of more interfaces might be the reason for the relatively poor flexural strength of WR reinforced composites. Preferential adsorption of resin components onto the surface of the fibers, usually result in a gradient of cure39,40 and difference in effectiveness of the interface in transferring stress, that may have led to the observed variation. Reinforcement with HE did not result in greater flexural strength improvement of any of the composites. The presence of pectins and waxes in native HE may lead to the formation of ineffective interface between the fiber and matrix, with subsequent problems such as debonding and voids in the resulting composites.36 Therefore, surface treatment of natural fibers using enzymatic, chemical and physical techniques before introducing it into the polymeric matrix material is a common practice to improve the adhesion between the fiber and the matrix and as a result the mechanical properties of the resulting composite.40 In addition, the use of coupling agents and compatibilizers to reduce hydrophilicity and enhance compatibility with different matrices is another area of research.41
3.3. Thermal stability
Thermal stability data are crucial to design and develop composites. This is because it is one of the limiting factors in the selection of curing temperature in the case of thermosets, extrusion and injection molding temperature in thermoplastic matrix composites and it determines a possible range of user application. The thermal stability data of the polymeric matrices and their counter composites reinforced with CSM, WR and HE based mats investigated with thermogravimetric analysis (TGA) is presented in Fig. 4.The composites prepared using hemp, i.e. APS20HE, P20HE and P30HE were characterized by two stages of degradations as shown in Fig. 5. These two stages were likely attributed to the difference in thermodegradability of the cellulose and hemicellulose components of the hemp fiber. Previous studies demonstrated that the hemicellulose degrades at lower temperature than cellulose and lignin of lignocellulosic materials in non-oxidative environment.33,42 Based on these observations, the first and second degradation peaks of HE based composites may be attributed to hemicellulose and cellulose degradation of the hemp fiber, respectively. This is in line with data obtained by Panthapulakkal and Sain33 for hemp reinforced polypropylene. Five percent weight loss (T5), twenty five percent weight loss (T25) and the residue left after 425 °C degradation is summarized in Table 2. The onset of degradation occurred between a wide temperature windows of 296–371 °C. Five percent weight loss (T5) happened between 248 and 295 °C for HE reinforced composites and above 305 °C for WR and CSM reinforced composites, demonstrating the dependence of degradation on the specific reinforcing fibers. The T5 and T25 temperature's apparently depended on the matrix type as well (Table 2). The APS20 based composites exhibited higher degradation temperature, while the P30 based composites exhibited lower temperature because hydrolyzed protein and some of their constituent amino acids start to degrade above 230 °C.43 The residue left was found to be dependent mainly on the type of reinforcing fiber. The glass fiber composites (CSM and WR) showed more left over residue than the hemp based composites – owing to higher thermal resistivity of glass fibers than hemp.
 | ||
| Fig. 5 TGA thermograms of (a) 20% APS based composites (b) 20% hydrolyzed protein based composites (c) 30% hydrolyzed protein based composites, reinforced with each of the CSM, WR and hemp fiber mats. Each experiment was replicated 5 times. | ||
| Label | T5 (°C) | T25 (°C) | Residue left after 425 °C (%) |
|---|---|---|---|
| a Data in this table are means ± standard deviation with a sample size of at least 5 for each group. a–eMeans with the same superscript letters within a column are not significantly different at P < 0.05 level. | |||
| APS20 | 356.3 ± 1.1a | 379.5 ± 0.3a | 24.9 ± 0.3a |
| P20 | 286.3 ± 0.8b | 355.0 ± 0.9b | 27.8 ± 0.4a |
| P30 | 308.2 ± 2.3c | 369.2 ± 1.3a | 25.5 ± 0.4a |
| APS20CSM | 358.8 ± 1.0a | 393.1 ± 1.5c | 55.7 ± 1.7b |
| P20CSM | 329.4 ± 7.6d | 391.5 ± 2.0c | 57.9 ± 0.6b |
| P30CSM | 305.0 ± 5.1b | 380.7 ± 3.4ac | 58.6 ± 0.2b |
| APS20WR | 351.9 ± 6.4a | 398.6 ± 3.5c | 66.3 ± 2.6c |
| P20WR | 328.9 ± 16.7d | 399.6 ± 8.0c | 62.8 ± 3.5c |
| P30WR | 303.4 ± 17.9b | 378.1 ± 5.7a | 54.4 ± 3.5c |
| APS20HE | 295.0 ± 17.0b | 356.3 ± 10.2b | 24.4 ± 0.5a |
| P20HE | 247.6 ± 17.7e | 331.1 ± 1.9d | 25.6 ± 3.4a |
| P30HE | 284.2 ± 10.3b | 347.3 ± 18.1b | 27.3 ± 3.6a |
Thermal stabilities of all the biocomposites achieved here were acceptable for end user application purpose. Thermal stability was shown here to be not a concern at all as far as curing temperature is concerned, as the curing took place at a maximum temperature of 200 °C. Catalysts and/or accelerators can also be included to cut down the curing temperature and the energy consumption as well.
3.4. Water resistance
It is observed that both the matrix type and fiber type had an effect on the water absorption of the composites. The synthetic matrix, composed of epoxy resin cured with APS, was more resistant to moisture than the hydrolyzed protein (P20 and P30) cured matrix. This behavior signifies that presence of a single functional group (–NH2) in APS that crosslinks with the epoxy resin effectively may not leave behind any residual groups to associate with water. On the other hand, hydrolyzed proteins have several functional groups such as primary and secondary amine (–NH2, –NH), carboxyls (–COOH), sulfhydryls (–SH) and hydroxyl (–OH) associated with side chain of the amino acids and the end groups of the hydrolyzed protein chain that would react with epoxy to cure.9 Even though such abundant functional groups of hydrolyzates provide an excellent opportunity to crosslink with epoxy resin and bond with the fibers, it is plausible to expect that some hydrophilic unreacted left over functional groups may associate with water leading to higher water absorption. Presence of incomplete network chains is another possibility that can lead to leaching out of matter into the water. Such migration of matter leaves behind voids or pores that would drive more water diffusion into the composites resulting in higher moisture absorption of hydrolyzed protein cured matrices.
It was also observed (Fig. 6) that HE and WR reinforced composites absorbed more water than their counterpart CSM based composites in most cases. WR reinforced composites also exhibited high moisture absorption when compounded with both of P20 and P30. This is consistent with the delamination behavior as a result of the poor interfacial interaction of hydrolyzed protein with WR observed and discussed in the mechanical property section. Glass fibers including WR and CSM absorb negligible amounts of water44 while cellulosic fibers such as hemp is well-known to absorb water and swell owing to its hydrophilic nature.46 It has been demonstrated that lower moisture absorption can be attributed to better adhesion between matrix and fibers, leading to fewer and smaller gaps in the interfacial region and hence less diffusion of water into the biocomposites.46 For instance, the water absorption difference observed between WR and CSM reinforced composites might be completely attributed to the adhesion bonding variation.
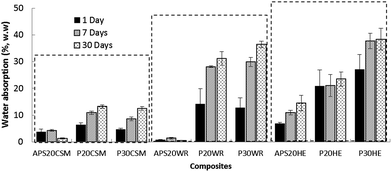 | ||
| Fig. 6 Water absorption of the APS, 20% and 30% hydrolyzed protein composites reinforced with CSM, WR and HE fibers at day 1, 7 and 30. Error bars are standard deviation of quintuplicate determination. | ||
The highest water absorption was observed when HE is compounded with hydrolyzed protein based polymeric matrices (P20HE and P30HE) because of the absorption contributed by both the matrix and fiber. For hemp reinforced composites, a maximum water gain of 38% for P30HE and a minimum of 14.5% for APS20HE were observed. It was also shown in Fig. 6 that more than half of the total water absorbed in the thirtieth day was absorbed in the first day; its absorption rate was then decelerated until the seventh day and further deceleration of the rate until the final testing day, thirtieth day. Espert et al.46 and Dhakal et al.45 reported similar trend of rapid water absorption of biocomposites in the first 20 h, then reduced rate until it reaches a saturation point where no more water was absorbed and the content of water in the composites remained the same.
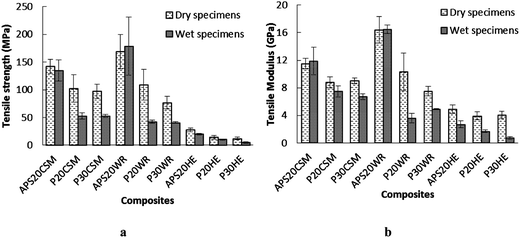 | ||
| Fig. 7 Comparison of (a) tensile strength and (b) modulus of dry composite specimens and wet composite specimens. Error bars are standard deviations from at least quintuplicate determinations. | ||
All composite specimens showed significant reduction of tensile strength when tested after 30 day soaking with the exception of APS20CSM and APS20WR. The most pronounced tensile strength deteriorations were observed for the hydrolyzed protein based matrices. P30HE, P20WR and P30WR exhibited 61, 60 and 46% tensile strength reduction, respectively. This is not surprizing, because it was these same composites that exhibited the highest water absorption (Fig. 6) signifying that higher water absorption resulted in deterioration of tensile strength. With respect to tensile modulus, significant reduction was observed for all composites made of P20 and P30 matrices regardless of the fiber type, and HE reinforced composites regardless of matrix type used. The influence of water absorption resulted in a similar pattern of flexural strength and modulus reduction as that of the tensile strength and modulus (Fig. 8) with reductions in flexural strength and modulus observed when either the matrix was hydrolyzed protein based or fibers used were HE, attributed to high water affinity of both ingredients. The highest reduction of flexural strength and modulus was observed when hydrolyzed protein cured epoxy matrices were reinforced with HE fiber.
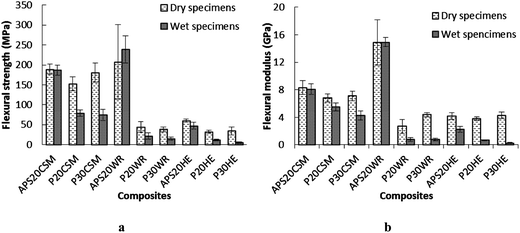 | ||
| Fig. 8 Comparison of (a) flexural strength and (b) flexural modulus of dry and wet composites. Error bars are standard deviations from at least quintuplicate determinations. | ||
Water absorption in composites may alter the structure, mechanical and thermal properties of the matrices,48 fibers,49 and the interface between the two. High water absorption of the hydrolyzed protein based matrices (P20 and P30) may shrink and deteriorate the chain orientation resulting in the observed relatively poor mechanical performance. Furthermore, higher moisture absorption of either the matrices or fibers causes swelling, resulting in developing gradient shear stress at the interface and initiating micro-cracks and debonding of fiber from the matrix and ultimately deteriorating the integrity of the composite. More micro-cracks and debonding of water soaked specimens (after) compared to the original specimens (before) were observed on SEM micrographs (Fig. 9). As such, the composite developed may not serve for purposes that require long term moisture exposure. Nevertheless, the good mechanical performance in dry environment could allow it for other applications including indoor construction, furniture adhesives, degradable construction practice, mulching trays etc.
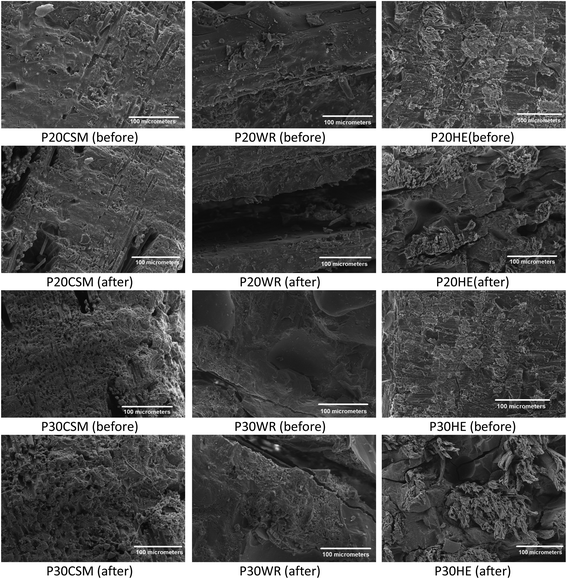 | ||
| Fig. 9 Scanning electron microscopy of fractured surfaces of protein based composites before and after 1 month soaking in water. | ||
In addition, some components of the hydrolyzed protein based matrices (P20 and P30) were observed to be released into the immersion tank. Analysis of the leachate (result not shown here) exhibited that salts used during hydrolyzed protein extraction and minor quantities of incompletely networked hydrolyzed proteins were released during the prolonged soaking. Similar leaching of natural fibers components were expected as natural fibers themselves commonly contain high levels of polar extractives.50 It is plausible that the release of such components can result in formation of voids and porosity as shown in Fig. 9, which may act as epicenters of stress concentrators leading to tensile and flexure failure of the composite specimens.
It has been reported that water molecules act as a plasticizing agent in composite materials exposed to moisture,46,49,51 which would lead to an increase of the maximum strain after water absorption. The tensile strain and flexural strain at break of dry and wet composite specimens are presented in Table 3. An increase in both tensile and flexural strain rate was observed for all HE reinforced composites. The mechanism of water plasticizing fibers is that water that penetrated the cellulose network of natural fibers will attach itself by chemical links such as hydrogen bonding to hydroxyl (–OH) groups in the cellulose molecules. The attached water molecules then swell the fiber and force the cellulose molecules apart destroying the rigidity of the cellulose structure. This allows the cellulose molecules to move more freely and hence water here acted as a plasticizer.45,46 Moisture absorption has also resulted in flexural strain enhancement of the P20WR and P30WR composites. Since WR fiber barely absorbs any moisture the tensile and flexural strain improvement in these specimens can be due to the plasticization of the hydrolyzed protein cured matrices attributed to left over hydrophilic sites.
| Tensile strain at break (%) | Flexural strain at break (%) | |||
|---|---|---|---|---|
| Dry | Wet | Dry | Wet | |
| a Data in this table are means ± standard deviation with a sample size of at least 5 for each group. Means with the same superscript letters within adjacent column are not significantly different at P < 0.05 level. | ||||
| APS20CSM | 1.6 ± 0.2a | 1.5 ± 0.2a | 2.6 ± 0.3ab | 2.6 ± 0.2ab |
| P20CSM | 1.6 ± 0.3a | 0.8 ± 0.1b | 2.5 ± 0.3ab | 1.5 ± 0.1a |
| P30CSM | 1.5 ± 0.2a | 0.9 ± 0.1b | 2.7 ± 0.3ab | 1.8 ± 0.1a |
| APS20WR | 1.4 ± 0.1a | 1.4 ± 0.4a | 1.4 ± 0.4a | 1.7 ± 0.1a |
| P20WR | 1.4 ± 0.2a | 1.2 ± 0.2a | 1.9 ± 0.3a | 3.2 ± 0.9d |
| P30WR | 1.6 ± 0.1a | 1.0 ± 0.1b | 1.0 ± 0.2b | 3.6 ± 1.2d |
| APS20HE | 0.8 ± 0.1c | 1.1 ± 0.2b | 2.1 ± 0.3ab | 4.0 ± 0.5d |
| P20HE | 0.6 ± 0.2c | 0.9 ± 0.1b | 1.0 ± 0.1a | 3.3 ± 0.4d |
| P30HE | 0.4 ± 0.1c | 1.1 ± 0.5a | 1.0 ± 0.3a | 4.1 ± 0.7d |
4. Conclusion
Biocomposites were successfully developed with hemp and two types of glass fiber mats to reinforce hydrolyzed protein-cured and APS cured epoxy resin polymers using French Press compression. It was observed that all the reinforcing fibers improved the tensile and flexural stiffness of the biocomposites made. The thermal stability study also displayed that all composites prepared were stable until a temperature close to 230 °C. The use of waste protein hydrolyzate extracts, hydrolyzed proteins, as crosslinking agent of epoxy resins in making biocomposites was novel and promising and results could be insightful that can be extended for uses other proteinaceous biomasses as curing agent of epoxy resins. The study also showed that the mechanical performance of the biocomposites was negatively affected by the water absorption. Generally, the conjuncture of hydrolyzed protein cured epoxy with hemp fiber exhibited comparatively lower water resistance. The influence of water absorption was in such a pattern that water-saturated samples presented poor mechanical properties. Water absorbed HE reinforced composites specifically exhibited an improvement in tensile strain due to plasticization effect of the water molecules on the cellulose component. These results highlight the importance of interfacing the matrix and reinforcing fiber phases may be needed to improve the mechanical performance and degradation behavior under moisture sorption.Acknowledgements
The financial support from Alberta Prion Research Institute (APRI) and Alberta Livestock and Meat Agency (ALMA) for this research is gratefully acknowledged. We also thank Sanimax Inc. (Montreal, Canada) for supplying SRM and MBM samples.References
- O. Faruk, A. K. Bledzki, H. P. Fink and M. Sain, Prog. Polym. Sci., 2012, 37, 1552–1596 CrossRef CAS.
- E. C. Lee, K. A. Flanigan, D. F. Williams, D. F. Meilewski and D. Q. Houston, in 5th Annual SPE Automotive Composites Conference and Exhibition, Troy, MI, 2005 Search PubMed.
- H. Cheung, M. Ho, K. Lau, F. Cardona and D. Hui, Composites, Part B, 2009, 40, 655–663 CrossRef.
- P. Fowler, J. Hughes and R. Elias, J. Sci. Food Agric., 2006, 86, 1781–1789 CrossRef CAS.
- G. Bogoeva-Gaceva, M. Avella, M. Malinconico, A. Buzarovska, A. Grozdanov, G. Gentile and M. E. Errico, Polym. Compos., 2007, 28, 98–107 CrossRef CAS.
- G. Mehta, A. Mohanty, M. Misra and L. Drzal, Green Chem., 2004, 6, 254–258 RSC.
- J. C. Benezet, A. Stanojlovic-Davidovic, A. Bergeret, L. Ferry and A. Crespy, Ind. Crops Prod., 2012, 37, 435–440 CrossRef CAS.
- N. Reddy and Y. Q. Yang, Biomacromolecules, 2007, 8, 638–643 CrossRef CAS PubMed.
- T. Mekonnen, P. Mussone, N. El-Daher, P. Choi and D. Bressler, Macromol. Mater. Eng., 2013 DOI:10.1002/mame.201200429.
- L. Shen, E. Worrell and M. Patel, Biofuels, Bioprod. Biorefin., 2010, 4, 25–40 CrossRef CAS.
- European Commision, Off. J. Eur. Communities, 1994, L172, 23–24 Search PubMed.
- CFIA, Enhanced Feed Ban Decision Documents, http://www.inspection.gc.ca/english/anima/heasan/disemala/bseesb/enhren/decdoce.shtml, accessed, February 12, 2010.
- DHHS-FDA, Food and Drug Administration, in Final Rule. Fed. Regist. 73, 22719–22758, ed. DHHS-FDA, April 25, 2008, pp. 22719–22758.
- E. Cascarosa, G. Gea and J. Arauzo, Renewable Sustainable Energy Rev., 2012, 16, 942–957 CrossRef CAS.
- N. El-Thaher, T. Mekonnen, P. Mussone, D. Bressler and P. Choi, Ind. Eng. Chem. Res., 2013, 52, 4987–4993 CrossRef CAS.
- S. Lukubira and A. A. Ogale, J. Appl. Polym. Sci., 2013 DOI:10.1002/app.39156.
- T. H. Mekonnen, P. G. Mussone, N. Stashko, P. Y. Choi and D. C. Bressler, Process Biochem., 2013, 48, 885–892 CrossRef CAS.
- T. H. Mekonnen, P. G. Mussone, H. Khalil and D. C. Bressler, J. Mater. Chem. A, 2013 10.1039/c3ta12555f.
- D. Smith, Metabolism, Pharmacokinetics and Toxicity of Functional Groups: Impact of the Building Blocks of Medicinal Chemistry on Admet, 2010, pp. 1–530 Search PubMed.
- L. Conde-Salazar, R. Valks, J. Malfeito, C. Garcia and S. Ledo, Contact Dermatitis, 2004, 51, 217–218 CrossRef PubMed.
- H. Manuel and R. Gaymans, Polymer, 1993, 34, 4325–4329 CrossRef CAS.
- N. Supanchaiyamat, P. Shuttleworth, A. Hunt, J. Clark and A. Matharu, Green Chem., 2012, 14, 1759–1765 RSC.
- S. Pathak and B. Rao, J. Appl. Polym. Sci., 2006, 102, 4741–4748 CrossRef CAS.
- H. Ku, H. Wang, N. Pattarachaiyakoop and M. Trada, Composites, Part B, 2011, 42, 856–873 CrossRef.
- CFIA, Animal Health Feed Ban Controls, BSE Manual of Procedures, http://www.inspection.gc.ca/english/anima/heasan/disemala/bseesb/enhren/decdoce.shtml, accessed September 09, 2010.
- S. K. Park, D. H. Bae and N. S. Hettiarachchy, J. Am. Oil Chem. Soc., 2000, 77, 1223–1227 CrossRef CAS.
- ASTM D638-08, in Annual Book of ASTM Standards, West Conshohocken, PA, 2008 Search PubMed.
- ASTM D790-07, in Annual Book of ASTM Standards, West Conshohocken, PA, 2007 Search PubMed.
- ASTM D570-98, in Annual Book of ASTM Standards, West Conshohocken, PA, 1998 Search PubMed.
- Y. Dong and D. Bhattachalyya, Composites, Part A, 2008, 39, 1177–1191 CrossRef.
- W. J. Liu, K. Thayer, M. Misra, L. T. Drzal and A. K. Mohanty, Polym. Eng. Sci., 2007, 47, 969–976 CAS.
- V. Tserki, P. Matzinos, N. E. Zafeiropoulos and C. Panayiotou, J. Appl. Polym. Sci., 2006, 100, 4703–4710 CrossRef CAS.
- S. Panthapulakkal and M. Sain, J. Appl. Polym. Sci., 2007, 103, 2432–2441 CrossRef CAS.
- J. F. Shakelford, Introduction to Materials Science Engineering, New York, 1985 Search PubMed.
- R. Malkapuram, V. Kumar and Y. S. Negi, J. Reinf. Plast. Compos., 2009, 28, 1169–1189 CrossRef CAS.
- M. A. Sawpan, K. L. Pickering and A. Fernyhough, J. Compos. Mater., 2012 DOI:10.1177/0021998312449028.
- M. A. Fuqua and C. A. Ulven, J. Biobased Mater. Bioenergy, 2008, 2, 258–263 CrossRef.
- R. Karnani, M. Krishnan and R. Narayan, Polym. Eng. Sci., 1997, 37, 476–483 CAS.
- E. Mäder and E. Pisanova, in Macromolecular Symposium, 2001, pp. 189–212 Search PubMed.
- Y. Li and Y. W. Mai, J. Adhes., 2006, 82, 527–554 CrossRef CAS.
- J. Gassan and V. S. Gutowski, Compos. Sci. Technol., 2000, 60, 2857–2863 CrossRef CAS.
- S. N. Monteiro, V. Calado, J. S. Rodriguez and F. M. Marge, Journal of Materials Research and Technology, 2012, 1, 117–126 CrossRef CAS.
- W. J. Tang, C. X. Wang and D. H. Chen, J. Anal. Appl. Pyrolysis, 2006, 75, 49–53 CrossRef CAS.
- O. Errajhi, J. Osborne, M. Richardson and H. Dhakal, Compos. Struct., 2005, 71, 333–336 CrossRef.
- H. N. Dhakal, Z. Y. Zhang and M. O. W. Richardson, Compos. Sci. Technol., 2007, 67, 1674–1683 CrossRef CAS.
- A. Espert, F. Vilaplana and S. Karlsson, Composites, Part A, 2004, 35, 1267–1276 CrossRef.
- M. M. Thwe and K. Liao, Composites, Part A, 2002, 33, 43–52 CrossRef.
- R. J. Morgan, J. E. Oneal and D. L. Fanter, J. Mater. Sci., 1980, 15, 751–764 CrossRef CAS.
- A. Stamboulis, C. A. Baillie and T. Peijs, Composites, Part A, 2001, 32, 1105–1115 CrossRef.
- C. Loxton and J. Hague, Use of Recycled Wood and Paper in Building Applications, 1997, pp. 190–192 Search PubMed.
- P. V. Joseph, M. S. Rabello, L. H. C. Mattoso, K. Joseph and S. Thomas, Compos. Sci. Technol., 2002, 62, 1357–1372 CrossRef CAS.
| This journal is © The Royal Society of Chemistry 2013 |
