 Open Access Article
Creative Commons Attribution 3.0 Unported Licence
Preparation via a solution method of La0.2Sr0.25Ca0.45TiO3 and its characterization for anode supported solid oxide fuel cells
Azra Yaqubab, Cristian Savaniua, Naveed K. Janjuab and John T. S. Irvine*a
aSchool of Chemistry, University of St Andrews, KY16 9ST, St Andrews, UK. E-mail: jtsi@st-and.ac.uk; Fax: +44 (0)1334 463808; Tel: +44 (0)1334 463817
bDepartment of Chemistry, Quaid-i-Azam University, Islamabad, 45320, Pakistan
First published on 27th September 2013
Abstract
La0.2Sr0.25Ca0.45TiO3 is a carefully selected composition to provide optimal ceramic and electrical characteristics for use as an anode support in solid oxide fuel cells. In this study we focus on the process optimization and characterization of A-site deficient perovskite, La0.2Sr0.25Ca0.45TiO3 (LSCTA-), powders prepared via a solution method to be integrated into the SOFC anode supports. A Pechini method has been applied to successfully produce single phase perovskite at 900 °C. Processing conditions have been modified to yield a powder that displays a similar sintering profile to commercial yttria stabilised zirconia. The conductivity behavior of porous bodies under redox has been investigated showing a 2 stage process in both oxidation and reduction cycling that exhibits strong reversibility. For the reduction process, addition of impregnated ceria reduces the onset delay period and increases the apparent rate constant, k values, by 30–50% for both stages. The addition of ceria had less influence on the oxidation kinetics, although the conductivity values of both oxidised and reduced porous bodies were enhanced.
Introduction
The state of the art anode material for solid oxide fuel cells (SOFCs) is the Ni/YSZ cermet due to its low cost, good catalytic activity, high ionic and electronic conductivity and chemical and mechanical compatibility with other cell components.1 However, it has some inherent drawbacks: upon redox cycling, anode degradation occurs due to large and facile Ni to NiO volume change, low tolerance to sulphur limits the application of this anode in SOFC conditions and its high catalytic activity causes carbon deposition when hydrocarbons are used as fuels, without excess steam being present. Moreover, at high operating temperatures, the catalytic active surface area decreases due to agglomeration and sintering of Ni.2 All of these factors affect the performance and long term stability of SOFCs.Therefore, there is a demand to design alternative anode systems to overcome the limitations of Ni/YSZ cermet without compromising the electrical conductivity and stability of the SOFC anode. In this context, perovskite oxides appear to be the suitable anode candidates as they offer suitable properties.3–5 Perovskite oxides have a general formula of ABO3 where A and B cations are 6-fold and 12-fold coordinated to the oxygen anions, respectively. The structure consists of BO6 octahedra sharing the corners of the cube containing an A cation at the centre. The A-site is usually occupied by alkaline earth and/or rare earth metal ions while small transition metal ions (usually from the 3d series) reside on the B site.6 Particular attention has been given to perovskite containing transition metals such as Ti, Cr, Mn or Mo due to the existence of multiple oxidation states which assist the electrocatalytic processes and facilitate electronic conductivity.
Interesting defect chemistry is achieved in perovskites by partial or full substitution of A and/or B sites with aliovalent cations. The properties of perovskites can be tuned and tailored as desired defects can be introduced into the structure by careful selection of dopants. SrTiO3 is a typical perovskite that has been extensively studied. It exhibits n-type semiconducting behavior when the donor is doped or under reducing conditions. Therefore, special attention has been given to enhance its electrical conductivity by partial substitution of Sr2+ on the A-site or/and Ti4+ on the B site to yield interesting compounds with oxygen substoichiometry or excess that strongly affects its properties.
The nature of B site dopants affects the structure, redox properties, conductivity and electrocatalytic properties of the parent compound.7 In this respect, various B site dopants have been investigated such as Nb,8 Mn,9 Ga,10 Sc,11 Fe,12 Al, Cr,13etc. A good conductivity value has been found for Nb doped SrTiO3. For example, SrTi0.98Nb0.02O3−δ presents a conductivity value of 339 S cm−1 at 800 °C after being reduced in hydrogen at 1400 °C.14
A-site substitution is effective in enhancing the electrical conductivity of SrTiO3. Donor doping SrTiO3 with trivalent cations like La3+ has been discussed in the literature where an increase in conductivity has been observed.15,16 Moreover, there are reports about the high resistance to carbon deposition or sulphur poisoning.17,18 Marina has found a pronounced effect of La3+ doping on the A-site of strontium titanate; among investigated compositions, the maximum conductivity of 500 S cm−1 has been observed in hydrogen at 800–1000 °C for La0.3Sr0.7TiO3 sintered at 1650 °C in reducing atmosphere.19 As reported in various papers, the charge compensation mechanism changes from ionic (under oxidized conditions) to electronic in reduced atmosphere.20 Under reducing atmosphere, Ti4+ reduces to a lower oxidation state, the process accompanied by the formation of oxygen vacancies (see the equation below), freeing electronic carriers that enhance the conductivity.21
Other than lanthanum, Y3+ has also been explored as an A-site dopant.22 Li et al have found that Y0.09Sr0.91TiO3 sintered at 1300 °C in forming gas possesses an electrical conductivity of 73.7 S cm−1 at 800 °C measured in the same atmosphere.23
It can be observed in the examples above that high temperatures and reducing atmospheres are employed to achieve high conductivity, a fact that drastically limits their practical application. Therefore, it is desirable to reduce these titanate anodes in situ, under fuel cell operating conditions (e.g. 850–900 °C), for higher compatibility with the existing fabrication technologies. In order to achieve comparable conductivity values via in situ reduction, A-site deficient compositions can be employed, as they generally exhibit higher electronic conductivity values than the stoichiometric ones at the same oxygen partial pressure.24
Other benefits that can be offered by A-site deficient stoichiometries are enhanced sintering, thermal stability and good performance as SOFC anodes.25–27 Previous investigations in our group have revealed A-site deficient systems to have good conductivity, thermomechanical compatibility with yttria-stabilized zirconia (YSZ) and performance under fuel cell conditions.28–30
Recently, we reported that the conductivity of La0.2Sr0.7TiO3 (LSTA-) can be increased by Ca doping perhaps because Ca is anticipated to decrease the unit cell volume and thus enhance the conductivity by making conduction orbitals of Ti closer to one another.31 It was shown that a maximum value of conductivity was achieved at a calcium dopant level of x = 0.45. Ca2+ has smaller ionic radius than Sr2+ and similar to that of La3+ that favours its solubility into the system. Calcium doping also improves the sinterability of LSTA- prepared via solid-state synthesis. The same optimal composition has also been shown to be an emerging anode candidate where very good performance was achieved in large cell testing under realistic fuel cell conditions.32
Since the microstructure and thus final properties of the SOFC anode in particular are a function of processing methodology, the present paper addresses and discusses the process optimization of A-site deficient, Ca2+ doped lanthanum strontium titanate, La0.2Sr0.25Ca0.45TiO3, hereafter called LSCTA- as suggested in our earlier study.28 In this study, the solution phase Pechini method33,34 was adopted for powder preparation and the effect of calcination temperature on its microstructural and thermal properties was investigated to search for an optimized calcination temperature. The physical properties of resultant structures were evaluated particularly with reference to redox cycling tolerance.
Experimental procedure
A Pechini method has been adopted to synthesize LSCTA-. An aqueous solution containing stoichiometric amounts of lanthanum nitrate (Aldrich, 99.999%), strontium nitrate (Aldrich, >99%), calcium nitrate (Aldrich, 99%) and titanium(IV)-bis-(ammoniumlactato) dihydroxide, 50% w/w in water (Aldrich), was mixed with a solution of ethylene glycol and citric acid (both Sigma) to have a final molar ratio of metal ions to citric acid to ethylene glycol as 1![[thin space (1/6-em)]](https://www.rsc.org/images/entities/char_2009.gif) :
:![[thin space (1/6-em)]](https://www.rsc.org/images/entities/char_2009.gif) 4
4![[thin space (1/6-em)]](https://www.rsc.org/images/entities/char_2009.gif) :
:![[thin space (1/6-em)]](https://www.rsc.org/images/entities/char_2009.gif) 16. The resulting solution was heated on the hot plate at 80–100 °C. The evaporation of solvent led to the formation of a viscous gel. The gel was dried and the resulting residue was calcined in air (for 5 hours) at various temperatures (LSCTA- calcined at 900 °C, 950 °C, 1000 °C and 1100 °C are abbreviated as S1, S2, S3 and S4, respectively in subsequent sections). YSZ powder (Pikem) was used as a standard electrolyte composition for dilatometry experiments.
16. The resulting solution was heated on the hot plate at 80–100 °C. The evaporation of solvent led to the formation of a viscous gel. The gel was dried and the resulting residue was calcined in air (for 5 hours) at various temperatures (LSCTA- calcined at 900 °C, 950 °C, 1000 °C and 1100 °C are abbreviated as S1, S2, S3 and S4, respectively in subsequent sections). YSZ powder (Pikem) was used as a standard electrolyte composition for dilatometry experiments.Thermogravimetric analysis (TGA) was performed on a Netzsch STA 449c equipped with Proteus™ thermal analysis software in air at a heating rate of 3 °C min−1. Phase formation was studied using a Philips XRD diffractometer using Cu-Kα1 radiation in the 2θ range of 20° to 80°. Lattice parameters were fitted with STOE WinXPOW software. Particle size analysis was carried out on a Malvern Instruments Mastersizer 2000. For particle size analysis, the LSCTA- powder was dispersed in 20 wt% of Triton X-100 (Alfa Aesar) in isopropyl alcohol. BET (Brunauer, Emmett and Teller) measurements were taken on a Micromeritics TriStar II 3020 instrument. The density of sintered pellets was calculated by measuring their mass and dimensions and compared to the theoretical density calculated using the unit cell parameters. The morphology of the calcined powders was studied using a JEOL 6700F field emission microscope. Sinterability of the LSCTA- powder was investigated using a Netzsch DIL 402C instrument. For dilatometry, powder was pressed into pellets of 13 mm diameter under pressure of 1 ton and heated in air in the dilatometer to 1400 °C. For a.c. impedance, LSCTA- pellets were sintered in air at 1400 °C for 6 hours and the surface of sintered pellets was polished and coated with Pt paste which was then consolidated at 900 °C for one hour. Impedance data were taken using a Solartron 1260 impedance/gain phase analyzer in the frequency range of 1 Hz to 13 MHz. The measured impedance data were analyzed by the Z view™ program and values of capacitances and resistances were extracted by fitting and modeling the experimental data. D.c. conductivity was determined by the van der Pauw method35 on LSCTA- pellets. For the van der Pauw setup, four gold mesh contacts were attached at the periphery of the sample using gold paste. The contacts were consolidated by firing at 900 °C for one hour. For redox cycling, after a stable conductivity value was achieved at ∼880 °C in a flow of 5% H2/Ar, the gas flow was cut off and air was allowed to leak into the furnace. After achieving a constant conductivity value in oxidized atmosphere, 5% H2/Ar was again flushed into the system and above steps were repeated several times.
The slurries for tape casting were prepared by a ball milling process that included two steps. In the first step, the ceramic powder was milled in distilled water for 24 hours with dispersant D3005 (PAA, Mw = 5000, The Dow Chemical company) and pore former (PMMA, 20 wt% to the weight of LSCTA-) to break down agglomerates. In the second step, other organic additives, such as plasticizers, binder and defoamer, were added, followed by additional milling for 9–12 h. The recipe was adopted to formulate porous LSCTA- tapes. The slurries were cast manually onto a Mylar sheet and the height of the doctor blade was adjusted to give 100 μm thick green tape. After drying, the green tapes were laminated by placing different layers onto one another and passing through the laminator. The laminated green tapes were cut into bars. The sintering was done in air at 1400 °C.
After sintering, a wet impregnation method was used to impregnate ceria. To improve the electrocatalytic activity of LSCTA-, catalytically active component CeO2 was infiltrated drop-wise into the porous bar from aqueous solutions of Ce(NO3)3·6H2O (99.99%, Alfa Aesar). Multiple impregnations with heat treatments at 400 °C between infiltrations were done in order to attain the desired weight loading as the pore volume of the LSCTA- backbone as well as the concentration of nitrate solution limits the infiltrated amount of catalysts in a single step. Finally, the sample was heated at 700 °C for 1 hour. The process was repeated until loading levels of CeO2 reached 7.7 wt%.
Results and discussion
The general requirements for precursor powders for an SOFC component such as a dense electrolyte or porous electrode that can be produced by typical processing techniques such as tape casting, screen printing or spray deposition are phase purity as well as chemical and thermal compatibility with the adjacent SOFC components, important for the long term stability of the SOFC and more critical in the first stages of cell fabrication involving co-sintering of the components. In the following sections we will investigate the solution-derived LSCTA- powder characteristics with the aim of their integration into the SOFC anode supports.Thermal analysis of the precursor gel
Fig. 1 shows thermo-gravimetric analysis on heating of the LSCTA- residue obtained after drying the gel at 300 °C in air. TGA reveals that the main mass loss (∼65%) occurs in the range of 280 °C to 410 °C and is attributed to the burnout of organic components, consistent with the formation of the oxide. Accordingly, a strong exothermic peak is observed in DTA indicative of the combustion of organic components. After ∼410 °C, the removal of all organic matter is complete and further heat treatment does not cause any mass loss. No mass modification is observed on cooling down to room temperature.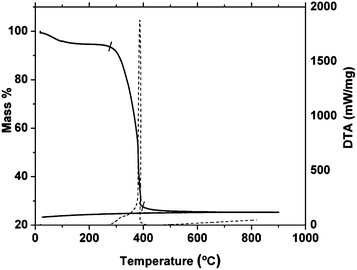 | ||
| Fig. 1 TGA (dashed line) and DTA (solid line) curves of the La0.2Sr0.25Ca0.45TiO3 residue in air up to 900 °C. | ||
XRD analysis
XRD patterns of LSCTA- samples that had been annealed at various temperatures in air, S1–S4, are shown in Fig. 2. All the samples show single perovskite structure and no impurity peak was detected in any of the XRD patterns. The XRD pattern was indexed and cell parameters were refined using WinXPOW software. All the peaks were indexed in orthorhombic symmetry having a space group of Pbnm. The miller indices (h, k and l values) of some of the peaks are also shown. The values of lattice parameters were found to be a = 5.4661(7) Å, b = 5.4638(6) Å and c = 7.7343(6) Å, respectively, for S3. This follows a relation close to √2ap × √2ap × 2ap where ap is the unit cell parameter of the ideal cubic symmetry.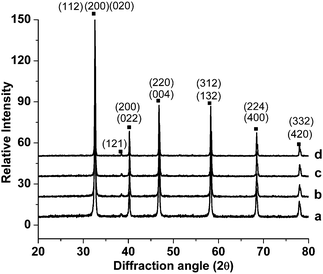 | ||
| Fig. 2 X-ray diffraction patterns of La0.2Sr0.25Ca0.45TiO3 powders calcined in air at various temperatures: (a) 900 °C (S1); (b) 950 °C (S2); (c) 1000 °C (S3) and (d) 1100 °C (S4). | ||
It has been reported that A-site deficient La0.2Sr0.7TiO3 has cubic symmetry21 while CaTiO3 exhibits orthorhombic symmetry at room temperature.36 Detailed discussion about the origin of different symmetries with calcium doping in this system could be found elsewhere.31 Ca doping to lanthanum strontium titanate has been shown to decrease the symmetry from cubic through tetragonal to orthorhombic. Thus the symmetry of A-site deficient lanthanum strontium titanate changes from cubic to orthorhombic with calcium doping, as the replacement of large Sr2+ (1.44 Å) with smaller size Ca2+ (1.35 Å) is likely to increase the distortion of the perovskite structure by decreasing the tolerance factor from 0.948 for cubic La0.2Sr0.7TiO3 to 0.932 for orthorhombic LSCTA- assuming that A-site vacancies have equivalent size to the occupied sites as a point of reference.
The average crystallite size of the powder calcined at various temperatures was also calculated using the Debye–Scherrer equation:
Particle size analysis and BET area
It is likely that the calcination process produces agglomerates of primary particles, thus we also determined the particle size of the powders (S1-S4) after ultrasonication in a mixture of isopropanol and dispersant for 15 minutes. The results of particle size analysis are presented in Fig. 3 and confirmed the observed increase of mean crystallite size with the calcination temperature.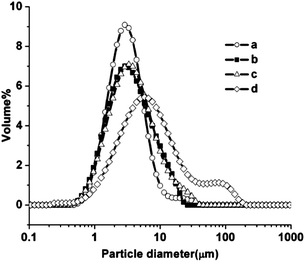 | ||
| Fig. 3 Particle size distribution of La0.2Sr0.25Ca0.45TiO3 powders calcined at various temperatures: (a) 900 °C (S1); (b) 950 °C (S2); (c) 1000 °C (S3) and (d) 1100 °C (S4). | ||
A narrower distribution is observed in the case of lower calcination temperature. The distribution of primary particles broadens with the corresponding decrease of volume fraction as the calcination temperature is increased. The shoulder observed for S4 is attributed to large agglomerates of LSCTA- or air bubbles due to in situ ultrasonication in the apparatus. Table 1 shows variation of mean particle size, primary crystallite size and BET area with calcination temperature. Particle size analysis clearly correlated the mean particle size with the increase in the calcination temperature.
All of these parameters follow the general trend, the higher the calcination temperature, the larger the mean diameter and crystallite size and lower the BET area. BET area decreases with calcination temperature due to the inverse relationship between the BET area and particle size. Tuning these parameters is a key factor in both powder processing and sintering characteristics.
Powder morphology
The effect of calcination temperature on particle growth and nucleation was investigated by analyzing the microstructure of these LSCTA- samples (Fig. 4) where it was also observed that the particle size increased with the increase in the calcination temperature. From SEM micrographs, it can be noted that S1 sample consists of particles having average size between 100 and 150 nm whereas S4 shows considerably larger particles. One can observe that while S1 comprises of rather isolated particles, the powder calcined above 1000 °C exhibits particles necking and formation of clusters of larger submicronic particles. There is some indication of elongation in particle agglomeration in the S4 sample which might be consistent with the possible bimodal particle size distribution observed in Fig. 3. This difference in microstructure affects the sintering process. Usually smaller size is beneficial to sintering and results in higher density when the sintering process is complete. It is expected that the fine particles produced from the solution method to have high sinterability which may be exploited favorably in processing the SOFC electrodes. | ||
| Fig. 4 Micrographs of La0.2Sr0.25Ca0.45TiO3 powders after calcination at various temperatures: (a) 900 °C (S1); (b) 900 °C (S2); (c) 1000 °C (S3) and (c) 1100 °C (S4). | ||
Sinterability
One of the basic requirements of an effective anode material is the thermal compatibility with the other cell components, i.e. the electrolyte. In terms of sinterability, there should be a good match between these two SOFC components not only in shrinkage extent but also in the onset sintering temperature. Fig. 5 shows sintering behavior of pellets made of powders S1–S4, in air, on heating up to 1400 °C as compared to the usual choice of electrolyte, 8 mol% YSZ.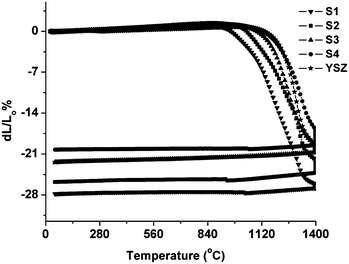 | ||
| Fig. 5 Dilatometric sintering curves of pellets from La0.2Sr0.25Ca0.45TiO3 powders calcined at different temperatures in air, ▼ 900 °C (S1); ■ 950 °C (S2); ▲ 1000 °C (S3); ● 1100 °C (S4) and * 8-YSZ. | ||
The shrinkage is directly related to the particle size of the powder e.g., smaller size leads to more sinterability. It is obvious that S1 sinters much more and the sintering starts earlier in comparison to YSZ. This sinterability decreases as the calcination temperature for the initial powder is increased. S3 sample shows an interesting behavior: its shrinkage matches very well with various electrolytes, YSZ, in terms of extent and onset (see Table 2). This feature makes it suitable for a co-sintering process together with YSZ, a typical electrolyte choice in SOFC manufacturing.
| Sample | Shrinkage% | Relative density% |
|---|---|---|
| a Using a theoretical density of 4.70 g cm−3 for LSCTA-. | ||
| S1 | 27.65 | 92.9 |
| S2 | 24.84 | 91.7 |
| S3 | 21.46 | 86.0 |
| S4 | 19.69 | 84.6 |
| YSZ | 21.03 | ∼100 |
The relative density was calculated from the determination of mass and dimensions of LSCTA- pellets sintered in air at 1400 °C, which was found to decrease with initial powder calcination temperature. Smaller particle size helps in achieving greater densification thus S1 exhibited the highest density of all samples.
The powder characterization results presented here confirmed that single phase LSCTA- can be produced via a solution combustion method that can be easily scaled up for larger quantities required for large anode supported SOFC production. Compared to traditional techniques such as solid-state synthesis, this preparation method offers improved homogeneity, lower preparation temperatures and less preparation steps, saving time, energy and minimizing powder contamination. A precursor powder calcination temperature of 1000 °C is very promising in terms of further processing for anode fabrication via tape casting and anode-electrolyte co-sintering or screen printing.
Electrical properties
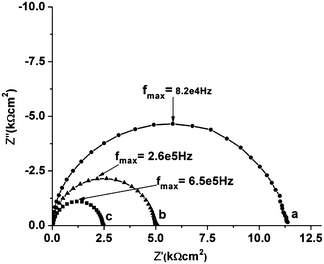 | ||
| Fig. 6 Cole–Cole plot of sintered S3 in the frequency range of 1 Hz to 13 MHz measured in air at different temperatures: (a) 650 °C, (b) 700 °C and (c) 750 °C. | ||
Similar impedance profiles are observed for all other samples. The corresponding capacitance values fall roughly in the range of ∼10−12 F cm−1 which are typically attributed to the contribution of intragranular or bulk phase.37 From the values of bulk resistance, a.c. conductivity was calculated and results are shown in the form of Arrhenius plot in Fig. 7.
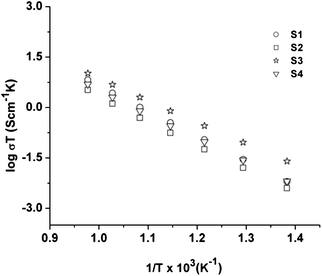 | ||
| Fig. 7 Arrhenius dependence of conductivity upon temperature in air for La0.2Sr0.25Ca0.45TiO3 samples calcined at various temperatures. | ||
Variation in conductivity with temperature in air for all samples shows Arrhenius type behavior, as the conductivity increases linearly with temperature. The differences are not very significant and relate to differences in microstructure and thermal history. The activation energy values can be calculated from the slope of Arrhenius conductivity plots and are presented in Table 3. S3 sample also offered facile electron transfer kinetics as inferred from the smaller activation energy value in comparison to other samples (Table 3).
| Samples | Ea/eV |
|---|---|
| S1 | 1.478 |
| S2 | 1.423 |
| S3 | 1.280 |
| S4 | 1.404 |
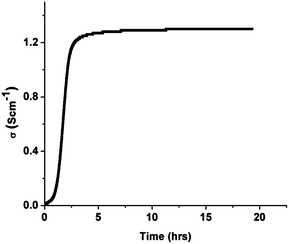 | ||
| Fig. 8 Conductivity profile of La0.2Sr0.25Ca0.45TiO3 pellets in 5% H2/Ar at 880 °C. | ||
A dense LSCTA- pellet was prepared from powder calcined at 1000 °C (S3), sintered in air at 1400 °C and pre-reduced in 5% H2/Ar at 1050 °C for 72 hours. Fig. 9 shows the temperature dependence of the electrical conductivity of pre-reduced LSCTA- in 5% H2/Ar on heating and subsequent cooling.
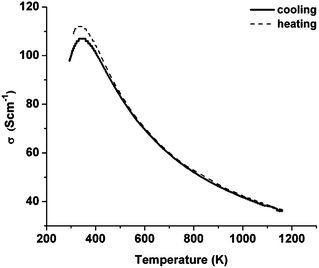 | ||
| Fig. 9 Thermal cycling of pre-reduced La0.2Sr0.25Ca0.45TiO3 (S3) in 5% H2/Ar. | ||
Conductivity increases with the decrease in temperature showing metallic behavior until 350 K. Below this temperature, conductivity decreases with the decrease in temperature, showing a metal–insulator transition.28 At 880 °C, a conductivity value of 38 S cm−1 was obtained at log![[thin space (1/6-em)]](https://www.rsc.org/images/entities/char_2009.gif) pO2 = −16.65 atm. This value is comparable to the one reported for the sample prepared by solid-state synthesis (27.53 S cm−1 at 900 °C at pO2 = 10−19 atm)31 and would be sufficient for using this material as an anode current collector backbone in the anode supported SOFC configuration.
pO2 = −16.65 atm. This value is comparable to the one reported for the sample prepared by solid-state synthesis (27.53 S cm−1 at 900 °C at pO2 = 10−19 atm)31 and would be sufficient for using this material as an anode current collector backbone in the anode supported SOFC configuration.
It is an important requirement of anode materials to be able to withstand reduction–oxidation and temperature cycles inherent to the SOFC stack maintenance. To determine the redox stability of this material, redox cycling was performed on a more porous LSCTA- bar (76% of the theoretical density). S3 sample was used for slurry preparation to fabricate porous LSCTA- bars via tape casting. The bar had final dimensions of 15 × 5 × 0.42 mm and was subjected to four probe d.c. conductivity measurements. Redox stability was tested by alternating the atmosphere from 5% H2/Ar to air upon achieving a stable conductivity value at 880 °C.
The electrocatalytic activity of strontium titanate-based materials is typically enhanced by impregnating electrocatalysts such as ceria or ceria–metal couples into the porous anode backbone.32 Here we performed some initial investigation on the role and stability of impregnated catalysts in a porous backbone of LSCTA- prepared by the solution phase method, see Fig. 10.
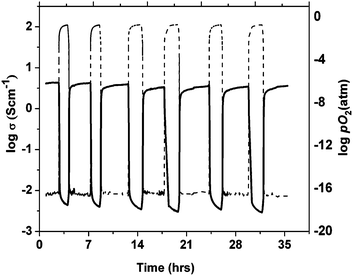 | ||
| Fig. 10 Redox cycling of a porous CeO2-impregnated La0.2Sr0.25Ca0.45TiO3 bar as a function of time at 880 °C. Dashed lines show the change of partial pressure of oxygen over time. | ||
In Fig. 11a (oxidation) and 11b (reduction) sections of the resistivity evolution are plotted on the same time scale for the native porous LSCTA- bar together with the ceria impregnated sample at 880 °C, for five subsequent redox cycles. There is remarkable overlapping within cycles. Ceria addition clearly accelerates the onset of changes in observed conductivity via redox. When the atmosphere is changed back to reducing atmosphere (see Fig. 11b) there is a sudden decrease in resistivity after the first 0.5 hours that indicates that once a certain concentration of oxygen vacancies is achieved within the material during the initiation step, the reduction process tends to proceed faster. This delay was much smaller for oxidation, probably because of the higher vacancy content at the process onset. The addition of ceria also improves the conductivity in both the reduced and oxidized samples, possibly due to the improved conductivity at the grain boundary.
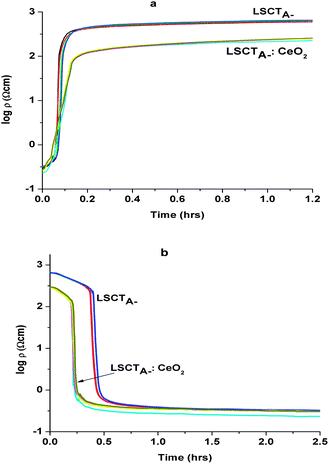 | ||
| Fig. 11 Resistivity variation vs. time on 5 oxidation (a) and 5 reduction (b) cycles each for La0.2Sr0.25Ca0.45TiO3 and CeO2-impregnated La0.2Sr0.25Ca0.45TiO3 at 880 °C. | ||
It can be noted that the oxidation occurs much faster than the (re)reduction. On closer analysis of the curves, we can note that upon the change in atmosphere and after the time delay, the redox processes occur via two sequential main rate determining steps, a fast initial one followed by a slower evolution in time and in addition there is also time delay before the conductivity is seen to respond to changes in atmosphere.
A more detailed analysis is obtained using the diffusion equation which assumes the surface reaction to be first order with the rate constant k proposed by Song and Yoo38 and plotting ln(1 − ((σt − σ0)/(σ∞ − σ0))) against time for the reduction process. In this equation, σt is the mean conductivity at time t whereas σ0 and σ∞ denote the initial conductivity at t = 0 and the final conductivity at the new equilibrium at t → ∞. If we consider the surface diffusion as the rate determining step, the slope of the curve −2k/a is given by:
Fig. 12 shows the relative resistivity/conductivity change in the semi-logarithmic scale with time for oxidation and reduction cycles of LSCTA- and CeO2-impregnated LSCTA- at 880 °C. Two distinguishable slopes can be clearly seen indicating two-fold relaxation kinetics. Such two fold relaxation kinetics has been attributed to fast relaxation in the oxygen sublattice followed by slow relaxation in a cation sublattice for TiO2.39
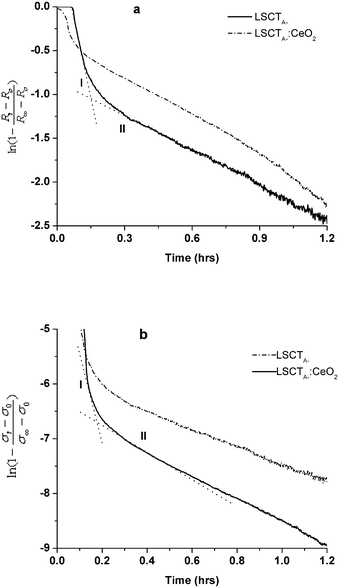 | ||
| Fig. 12 Resistivity/conductivity relaxation of LSCTA- and ceria impregnated LSCTA- upon oxidation (a) and reduction (b) at 880 °C. Two different kinetic processes are indicated by dotted intersecting lines with different slopes. | ||
From the slope of these curves, rate constants for both oxidation and reduction kinetic processes were calculated and are tabulated in Table 4 along with the onset delay and relevant times for each relaxation type.
| Oxidation | Onset delay (h) | kIox × 107 (cm s−1) | Time range for region I (h) | kIIox × 107 (cm s−1) | Time range for region II (h) |
|---|---|---|---|---|---|
| LSCTA- | 0.07 | 3.00 | 0.07–0.11 | 0.40 | 0.20–1.2 |
| LSCTA-:CeO2 | 0.03 | 2.69 | 0.05–0.10 | 0.30 | 0.20–1.4 |
| Reduction | Onset delay (h) | kIred × 107 (cm s−1) | Time range for region I (h) | kIIred × 107 (cm s−1) | Time range for region II (h) |
|---|---|---|---|---|---|
| LSCTA- | 0.4 | 1.40 | 0.4–0.5 | 0.18 | 0.9–2.5 |
| LSCTA-:CeO2 | 0.2 | 2.18 | 0.2–0.3 | 0.24 | 0.4–1.4 |
Considering reduction, ceria impregnation accelerates the process decreasing the onset delay and increasing the rate constant for both relaxation stages by 30–50%. The oxidation processes are more facile than reduction, see Fig. 11, with shorter onset times and higher rate constants for stage I but not for stage II. Ceria impregnation results in a decrease in onset time but also slightly lowers rate constants. Thus, different factors determine the influence of ceria impregnation on oxidation and reduction rates in these experiments.
It is important to note that the reduction experiments start from a highly oxidized sample with few oxygen vacancies and thus catalysis of surface exchange by ceria has a significant influence on both the initial delay whilst percolation is achieved and the reduction process. In the oxidation stage, the sample has a high number of vacancies at the start of oxidation, hence surface exchange at ceria has little beneficial influence, apart from decreasing the onset delay.
We can also note the role of the ceria catalyst in the improvement of conductivity on reduction from 3.35 S cm−1 for the bare backbone to 5.87 S cm−1 for the ceria impregnated sample.
It was reported31 that LSCTA- exhibits only a small increase (ca. 0.3%) in the unit cell volume upon reduction which, together with this complete conductivity recovery upon redox cycling, makes this material an attractive candidate for a stable, conductive anode backbone in SOFC/SOEC applications. This was demonstrated recently as good redox stability (20 cycles) was observed for the LSCTA- impregnated with ceria and nickel catalysts, as a power density in excess of 0.5 W cm−2 at 900 °C was achieved with this anode in an electrolyte supported button cell configuration.32
Conclusions
A solution synthesis route was successfully adopted to synthesize La0.2Sr0.25Ca0.45TiO3 powder. XRD spectra show that a single orthorhombic phase could be obtained at relatively low calcination temperatures. A calcination temperature of 1000 °C was considered as optimum for a further promising processing of this material. LSCTA- showed n-type conduction nature where the conductivity of a dense LSCTA- specimen sintered in air increased by three orders of magnitude after in situ reduction in 5% H2/Ar. Pre-reduction resulted in enhancement of conductivity to a value of 38 S cm−1 at 880 °C. Redox cycling showed encouraging redox stability of the ceramic system thus imparting a suitable anode conductive support candidateship. CeO2 impregnation resulted in further improvement in conductivity by enhancing reduction kinetics, but had limited effect on the oxidation processes, which were a little faster in the absence of the catalyst. Whilst the obtained rate constants were derived using some approximations, all samples were treated similarly, hence the increase of rate constant kred by about 50% due to ceria impregnation is significant.Acknowledgements
Higher Education Commission (HEC) of Pakistan, European project SCOTAS, The Royal Society and EPSRC-UK are acknowledged for the financial support.Notes and references
- N. Q. Minh, J. Am. Chem. Soc., 1993, 76, 563–588 CAS.
- W. Bao, H. Guan and J. Cheng, J. Power Sources, 2008, 175, 232–237 CrossRef CAS PubMed.
- W. Z. Zhu and S. C. Deevi, Mater. Sci. Eng., A, 2003, 362, 228–239 CrossRef.
- J. B. Goodenough and Y. H. Huang, J. Power Sources, 2007, 173, 1–10 CrossRef CAS PubMed.
- S. Tao and J. T. S. Irvine, Chem. Rec., 2004, 4, 83–95 CrossRef CAS PubMed.
- M. A. Penã and J. L. G. Fierro, Chem. Rev., 2001, 101, 1981–2017 CrossRef PubMed.
- D. N. Miller and J. T. S. Irvine, J. Power Sources, 2011, 196, 7323–7327 CrossRef CAS PubMed.
- J. Karczewski, B. Riegel, M. Gazda, P. Jasinski and B. Kusz, J. Electroceram., 2010, 24, 326–330 CrossRef CAS.
- A. Ovalle, J. C. Ruiz-Morales, J. Canales-Vasquez, D. Marrero-Lopez and J. T. S. Irvine, Solid State Ionics, 2006, 177, 1997–2003 CrossRef CAS PubMed.
- D. Neagu and J. T. S. Irvine, Chem. Mater., 2011, 23, 1607–1617 CrossRef CAS.
- X. Li, H. Zhao, F. Gao, N. Chen and N. Xu, Electrochem. Commun., 2008, 10, 1567–1570 CrossRef CAS PubMed.
- D. P. Fagg, V. V. Kharton, J. R. Frade and A. A. L. Ferreira, Solid State Ionics, 2003, 156, 45–57 CrossRef CAS.
- N. G. Eror and U. Balachandran, J. Am. Ceram. Soc., 1982, 65, 426–431 CrossRef CAS.
- T. Kolodiazhnyi and A. Petric, J. Electroceram., 2005, 15, 5–11 CrossRef CAS PubMed.
- J. Canales-Vazquez, S. W. Tao and J. T. S. Irvine, Solid State Ionics, 2003, 159, 159–165 CrossRef CAS.
- K. B. Yoo and G. M. Choi, Solid State Ionics, 2009, 180, 867–871 CrossRef CAS PubMed.
- R. Mukundan, E. L. Brosha and F. H. Garzon, Electrochem. Solid-State Lett., 2004, 7, A5–A7 CrossRef CAS PubMed.
- M. Roushanafshar, J.-L. Luo, A. L. Vincent, K. T. Chuang and A. R. Sanger, Int. J. Hydrogen Energy, 2012, 37, 7762–7770 CrossRef CAS PubMed.
- O. A. Marina, N. L. Canfield and J. W. Stevenson, Solid State Ionics, 2002, 149, 21–28 CrossRef CAS.
- P. Blennow, A. Hagen, K. K. Hansen, L. R. Wallenberg and M. Mogensen, Solid State Ionics, 2008, 179, 2047–2058 CrossRef CAS PubMed.
- P. R. Slater, D. P. Fagg and J. T. S. Irvine, J. Mater. Chem., 1997, 7, 2495–2498 RSC.
- X. Huang, H. Zhao, W. Qiu, W. Wu and X. Li, Energy Convers. Manage., 2007, 48, 1678–1682 CrossRef CAS PubMed.
- X. Li, H. Zhao, W. Shen, F. Gao, X. Huang, Y. Li and Z. Zhu, J. Power Sources, 2007, 166, 47–52 CrossRef CAS PubMed.
- D. Burnat, A. Heel, L. Holzer, D. Kata, J. Lis and T. Graule, J. Power Sources, 2012, 201, 26–36 CrossRef CAS PubMed.
- Q. Ma, F. Tietz, A. Leonide and E. Ivers-Tiffée, Electrochem. Commun., 2010, 12, 1326–1328 CrossRef CAS PubMed.
- H. Zhao, F. Gao, X. Li, C. Zhang and Y. Zhao, Solid State Ionics, 2009, 180, 193–197 CrossRef CAS PubMed.
- X. Li, H. Zhao, X. Zhou, N. Xu, Z. Xie and N. Chen, Int. J. Hydrogen Energy, 2010, 35, 7913–7918 CrossRef CAS PubMed.
- C. D. Savaniu and J. T. S. Irvine, J. Mater. Chem., 2009, 19, 8119–8128 RSC.
- C. D. Savaniu and J. T. S. Irvine, Solid State Ionics, 2011, 192, 491–493 CrossRef CAS PubMed.
- D. Neagu and J. T. S. Irvine, Chem. Mater., 2010, 22, 5042–5053 CrossRef CAS.
- A. D. Aljaberi and J. T. S. Irvine, J. Mater. Chem. A, 2013, 1, 5868–5874 CAS.
- M. C. Verbraeken, B. Iwanschitz, A. Mai and J. T. S. Irvine, J. Electrochem. Soc., 2012, 159, F757–F762 CrossRef CAS PubMed.
- A. Ries, A. Z. Simoes, M. Cilense, M. A. Zaghete and J. A. Varel, Mater. Charact., 2003, 50, 217–221 CrossRef CAS.
- J. D. G. Fernandes, D. M. A. Melo, L. B. Zinner, C. M. Salustiano, Z. R. Silva, A. E. Martinelli, M. Cerqueira, C. Alves Júnior, E. Longo and M. I. B. Bernardi, Mater. Lett., 2002, 53, 122–125 CrossRef CAS.
- L. J. van der Pauw, Philips Res. Rep., 1958, 13, 1–9 Search PubMed.
- N. Lamrani, B. Itaalit, S. Marinel and M. Aliouat, Mater. Lett., 2011, 65, 346–349 CrossRef CAS PubMed.
- J. T. S. Irvine, D. C. Sinclair and A. R. West, Adv. Mater., 1990, 2, 132–138 CrossRef CAS.
- C.-R. Song and H.-I. Yoo, Solid State Ionics, 1999, 120, 141–153 CrossRef CAS.
- D.-K. Lee and H.-I. Yoo, Solid State Ionics, 2006, 177, 1–9 CrossRef CAS PubMed.
| This journal is © The Royal Society of Chemistry 2013 |


