 Open Access Article
Creative Commons Attribution 3.0 Unported Licence
High-performing iron phosphate for enhanced lithium ion solid state batteries as grown by atomic layer deposition
Knut Bjarne
Gandrud
*,
Anders
Pettersen
,
Ola
Nilsen
and
Helmer
Fjellvåg
Centre for Materials Science and Nanotechnology, Department of Chemistry, University of Oslo, P.O. Box 1033 Blindern, N-0315 Oslo, Norway. E-mail: k.b.gandrud@kjemi.uio.no; Fax: +47 2285 5565; Tel: +47 2285 5558
First published on 18th June 2013
Abstract
Atomic layer deposition (ALD) is an excellent tool for realisation of uniform coating of cathode materials on highly 3D-nanostructured microbatteries. We have developed an ALD-process for deposition of iron phosphate, FePO4, as a cathode material and characterised its electrochemical properties towards a lithium metal anode. Thin films were deposited between 196 and 376 °C using the precursor pairs: trimethyl phosphate (TMP, Me3PO4) with both H2O and ozone (O3) as an oxygen source, and Fe(thd)3 (Hthd = 2,2,6,6-tetramethyl-3,5-heptanedionate) with O3. The as-deposited films are amorphous and crystallize to trigonal FePO4 after heat treatment in air at 600 °C. The amorphous FePO4 films were characterised electrochemically proving exceptional cyclability and capacities almost reaching the 100% theoretical value (178 mA h g−1) for 1 hour charge–discharge rates.
Introduction
Lithium ion batteries are currently used in numerous mobile applications ranging in size from smaller electronic devices to cell phones, power drills and electric vehicles. Common to these applications is the need for materials with high gravimetric and volumetric energy densities along with large power density. Lithium ion batteries already fulfil many current demands, however, for enabling future applications even higher densities and smaller footprints are required. A 3D-integrated all-solid-state battery is a promising approach for realisation of small scale devices.1–3The latter approach is relatively demanding as it requires a production technique that provides pin-hole free films on large aspect ratio structures. Atomic layer deposition (ALD) is one of the few techniques capable of forming pin hole free conformal coverage of compounds on complex structures.4–6 Currently, we report an ALD-process for deposition of thin films of FePO4 along with electrochemical characterization of such films as cathode materials in Li-ion batteries.
In bulk, iron phosphate, FePO4, is implemented as a cathode material with a theoretical specific capacity of 178 mA h g−1 upon 1 mol of lithium intercalation. It is made of cheap and abundant elements and is environmentally benign. However, it is difficult to obtain the full theoretical capacity of FePO4 due to poor kinetics of the lithium intercalation/deintercalation process. Nevertheless, this limitation is reported to be overcome by nanostructuring.7,8
The electrochemical properties of FePO4 are strongly affected by the atomic arrangement. Amorphous FePO4 (a-FePO4) and crystalline olivine type FePO4 may show good electrochemical properties whereas the trigonal phase, which is typically formed upon annealing of amorphous FePO4, shows poor electrochemical behaviour.9–11 This is likely due to the instability of tetrahedral Fe2+ in trigonal FePO4.10
The electrochemical properties of crystalline and amorphous FePO4 have been extensively studied.7,10–14 The electrochemical capacity of amorphous hollow nanospheres of FePO4 is reported to be as large as 174 mA h g−1 at C/10 and 150 mA h g−1 at 1C,8 whereas its trigonal crystalline counterpart only shows 40 mA h g−1 at C/10.12 However, the capacity of crystalline olivine FePO4 is reported to be 154 mA h g−1 at 1C.15
Although thin films of LiFePO4 have been subject to numerous studies,14,16,17 reports on unlithiated FePO4 are rather limited. Thin films of amorphous FePO4 are reported to be grown by rf-sputtering and are used in all-solid-state batteries (Li/LiPON/FePO4) with an overall capacity of 21 μA h cm−2, which we estimate to roughly correspond to 6.6 mA h g−1 in gravimetric capacity.18
The cathode materials that previously have been made by ALD are mainly unlithiated transition metal oxides such as TiO2,19 MnO2,20,21 Co3O4,22 (Co, Fe)3O4,23 V2O5,24,25 and NiO.26 The lithiated cathode materials reported so far are LiCoO2 (ref. 27) and LiFePO4.28
The field of phosphate materials deposited by ALD is relatively limited. The first ALD deposition of phosphates was that of aluminium phosphate, AlPO4, in the 1990s29,30 using trimethyl phosphate (TMP, Me3PO4)/H2O and P2O5/H2O as phosphorous sources. Films in the Ca–P–O system were deposited using Ca(thd)2, TMP and O3.31 Recently ALD of the phosphate-containing materials LaPO4 (ref. 32) and LiFePO4 (ref. 28) has been described using the TMP/(H2O + O3) phosphorus source together with La(thd)3/O3, Li(thd)/O3 and Fe(thd)3/O3. Phosphates of both Al and Ti were reported recently using AlCl3 and TiCl4, respectively, in combination with TMP,33 and TiCl4 with TMP/H2O.34 Deposition of Li3PO4 (ref. 35) has recently been reported using TMP together with lithium hexamethyldisilazide or lithium tert-butoxide.
Iron containing oxides have previously been demonstrated to be grown by ALD using a number of different iron sources like Fe(thd)3/O3,23,36–38 Fe(acac)3/O2,39 Fe2(OtBu)6/H2O,40 and FeCp2/O2.41
In this work we first describe the FePO4 deposition process, supported by structural and morphological characterisation by X-ray diffraction (XRD) and atomic force microscopy (AFM). Second, we present electrochemical characterization data for the amorphous as-deposited films by galvanostatic measurements and cyclic voltammetry. Compared to previous work these films exhibit enhanced electrochemical performance as cathodes for Li-ion batteries.
Experimental
The films were grown in an F-120 Sat reactor (ASM Microchemistry Ltd) using Fe(thd)3, Me3PO4 (97.0%, Fluka), H2O (18 MΩ cm−1) and O3 as precursors. Fe(thd)3 was synthesized from FeCl3 (99.0%, Fluka) and Hthd (98%, Fluka) as described in ref. 42. The source temperature for Fe(thd)3 was 115 °C, and Me3PO4, H2O and O3 were introduced into the reactor at room temperature using a carrier gas for the Me3PO4 source. Ozone was generated by feeding O2 (99.999%, AGA) into an ozone generator (OT-020, OzoneTechnology, or 803N, BMT Messtechnik GMBH). The flow rate of ozone during its pulses was ca. 500 cm3 min−1. The pressure in the reactor was kept below 3 mbar using a total N2 flow (99.9995%) of 500 cm3 min−1. The films were deposited on substrates of p-type Si(111), soda lime glass and 316 Stainless steel (CR20).Material characterization
The thickness of the deposited films was analyzed by spectroscopic ellipsometry using an alpha-SE ellipsometer (J.A Woollam Co. Inc.) and by X-ray reflectivity (XRR) using an AXS D8 Discover (Bruker). The X-ray reflectivity data were fitted using the GenX software43 and the ellipsometer data were fitted to a Cauchy function. XRR was further used to determine the density of the deposited films. The deposited films were studied using X-ray diffraction in grazing incidence (GI-XRD) and θ–2θ configuration using a D5000 (Siemens) diffractometer equipped with a Göbel mirror providing parallel Cu-Kα radiation. For the GI-XRD measurements ω = 0.5° was used as the incident angle. The film roughness was analyzed by atomic force microscopy (AFM) using a XE-70 (Park Systems) in non-contact mode. X-ray fluorescence (XRF) was used to determine the composition of iron and phosphorus in the deposited films using a Philips PW2400 spectrometer and UniQuant analysis software.44Electrochemical characterization
The electrochemical properties of the deposited samples were investigated in CR2032 coin cells. Cell assembly was carried out in an Ar-filled glove box with water and oxygen levels below 0.1 ppm. Metallic lithium (99.9%, Sigma-Aldrich) was used as an anode and FePO4 films as-deposited on steel substrates were used as a cathode. The active mass was calculated based on thickness and density from XRR. The electrolyte consisted of 1 M LiClO4 (99.99%, Sigma-Aldrich) in a 1![[thin space (1/6-em)]](https://www.rsc.org/images/entities/char_2009.gif) :
:![[thin space (1/6-em)]](https://www.rsc.org/images/entities/char_2009.gif) 1 mixture of ethylene carbonate (EC) (99%, Sigma-Aldrich) and dimethyl carbonate (DMC) (≥99% Sigma Aldrich). Electrochemical properties were measured at room temperature using a MPG2 (Biologic). Cyclic voltammetry measurements were carried out in the range 2.3–4.0 V with a scanning rate of 0.1 mV s−1. The voltage was kept constant for 30 minutes at the two endpoints of 2.3 and 4.0 V. The cyclability and specific capacity of the amorphous FePO4 films were investigated by taking galvanostatic measurements. The galvanostatic data were measured during charge–discharge cycles at a current rate close to 1C (181 mA g−1) over the voltage range 2.0–4.0 V with 5 min relaxation time after each cycle.
1 mixture of ethylene carbonate (EC) (99%, Sigma-Aldrich) and dimethyl carbonate (DMC) (≥99% Sigma Aldrich). Electrochemical properties were measured at room temperature using a MPG2 (Biologic). Cyclic voltammetry measurements were carried out in the range 2.3–4.0 V with a scanning rate of 0.1 mV s−1. The voltage was kept constant for 30 minutes at the two endpoints of 2.3 and 4.0 V. The cyclability and specific capacity of the amorphous FePO4 films were investigated by taking galvanostatic measurements. The galvanostatic data were measured during charge–discharge cycles at a current rate close to 1C (181 mA g−1) over the voltage range 2.0–4.0 V with 5 min relaxation time after each cycle.
Results
The system for deposition of FePO4 is based on individual subcycles managing the iron and phosphorous content:| Fe: Fe(thd)3 – purge – O3 – purge |
| P: Me3PO4 – purge – (H2O + O3) – purge |
ALD type growth was verified by basis in a supercycle of Fe–P deposition during 1000 cycles at 246 °C by systematic variations of the length of the individual pulse cycles. The basic cycle and purge times for the parameter that was not under investigation were set at specific values: 3s Fe(thd)3 – 6s purge – 6s O3 – 6s purge – 6s TMP – 6s purge – 6s (H2O + O3) – 12s purge. The choice of deposition temperature and purge times was based on prior experience with the Fe2O3 (ref. 36) and LaPO4 (ref. 32) systems. The purge times were not subject to further optimization in the current study. The results from the investigation of the pulse times are shown in Fig. 1, and prove that all precursors saturate within the selected pulse times.
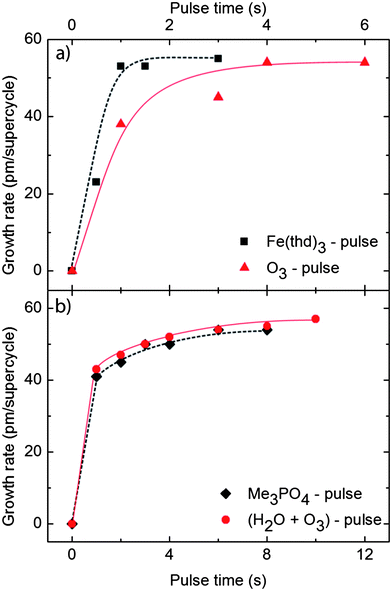 | ||
Fig. 1 Growth rate per supercycle of 1![[thin space (1/6-em)]](https://www.rsc.org/images/entities/char_2009.gif) : :![[thin space (1/6-em)]](https://www.rsc.org/images/entities/char_2009.gif) 1 pulsing of Fe 1 pulsing of Fe![[thin space (1/6-em)]](https://www.rsc.org/images/entities/char_2009.gif) : :![[thin space (1/6-em)]](https://www.rsc.org/images/entities/char_2009.gif) P, as a function of the pulsing times of (a) Fe(thd)3 and O3 and (b) Me3PO4 and (H2O + O3), based on ellipsometry measurements. P, as a function of the pulsing times of (a) Fe(thd)3 and O3 and (b) Me3PO4 and (H2O + O3), based on ellipsometry measurements. | ||
An optimised pulsing scheme was used throughout this investigation: 2s Fe(thd)3 – 1.5s purge – 4s O3 – 5s purge – 4s TMP – 3s purge – 8s (H2O + O3) – 5s purge. The temperature dependency of the growth was investigated by maintaining a 1![[thin space (1/6-em)]](https://www.rsc.org/images/entities/char_2009.gif) :
:![[thin space (1/6-em)]](https://www.rsc.org/images/entities/char_2009.gif) 1 supercycle of Fe and P and varying the deposition temperature. A total of 1000 supercycles were applied and the achieved growth rates and compositions are given in Fig. 2.
1 supercycle of Fe and P and varying the deposition temperature. A total of 1000 supercycles were applied and the achieved growth rates and compositions are given in Fig. 2.
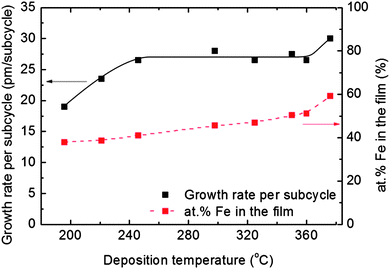 | ||
Fig. 2 Growth rate per subcycle and composition of deposited films as a function of deposition temperature for a pulsing ratio of 1![[thin space (1/6-em)]](https://www.rsc.org/images/entities/char_2009.gif) : :![[thin space (1/6-em)]](https://www.rsc.org/images/entities/char_2009.gif) 1 between Fe and P as measured by XRR and XRF, respectively. 1 between Fe and P as measured by XRR and XRF, respectively. | ||
The Fe-content in the film increases steadily with the deposition temperature, and reaches an equimolar ratio at 350 °C. However, the overall growth rate remains almost constant in the temperature range of 246–360 °C. Above 360 °C, large visible gradients suggest decomposition of at least one of the precursors.
The possibility of tuning the deposited composition was investigated by applying different combinations of subcycles. The individual subcycles were alternated in a manner that maximized the intermixing of the two components. The total number of subcycles was kept at 2000 and the deposition temperature was maintained at 246 °C. The results show a notable variation in growth rate with deposited composition, with a maximum at the equimolar pulsing ratio, Fig. 3. The deposited compositions varied from ca. 40% Fe with respect to the Fe + P content, to ca. 70% for a 4![[thin space (1/6-em)]](https://www.rsc.org/images/entities/char_2009.gif) :
:![[thin space (1/6-em)]](https://www.rsc.org/images/entities/char_2009.gif) 1 pulsing ratio of Fe
1 pulsing ratio of Fe![[thin space (1/6-em)]](https://www.rsc.org/images/entities/char_2009.gif) :
:![[thin space (1/6-em)]](https://www.rsc.org/images/entities/char_2009.gif) P.
P.
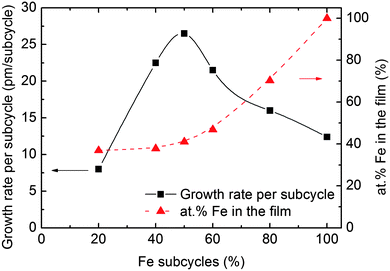 | ||
| Fig. 3 Growth rate per subcycle and composition as a function of the percentage of Fe-subcycles as measured by XRR and XRF, respectively. | ||
Fig. 3 shows that an equimolar ratio of Fe and P is obtained in the films for a pulsing ratio of 3![[thin space (1/6-em)]](https://www.rsc.org/images/entities/char_2009.gif) :
:![[thin space (1/6-em)]](https://www.rsc.org/images/entities/char_2009.gif) 2. This pulsing ratio was maintained in the following deposition processes of FePO4.
2. This pulsing ratio was maintained in the following deposition processes of FePO4.
At 246 °C the deposited film thickness varies linearly with the number of supercycles without any sign of nucleation barriers, Fig. 4. The film density remains quite constant, around 3 g cm−3, Fig. 4.
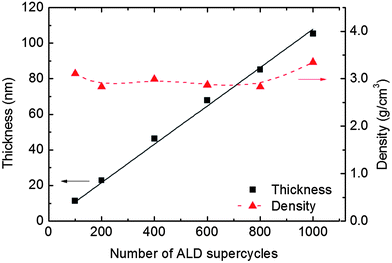 | ||
Fig. 4 Film thickness and density measured by XRR as a function of the number of supercycles with 3![[thin space (1/6-em)]](https://www.rsc.org/images/entities/char_2009.gif) : :![[thin space (1/6-em)]](https://www.rsc.org/images/entities/char_2009.gif) 2 pulsing between Fe and P. 2 pulsing between Fe and P. | ||
A 100 nm thick film deposited at 246 °C was investigated by X-ray diffraction as-deposited and after annealing at 600 °C in air, Fig. 5. The amorphous as-deposited film crystallizes into trigonal FePO4 (ref. 45) after annealing. The absence of impurity faces in the obtained diffractograms further indicates an equimolar ratio between Fe and P throughout the whole film.
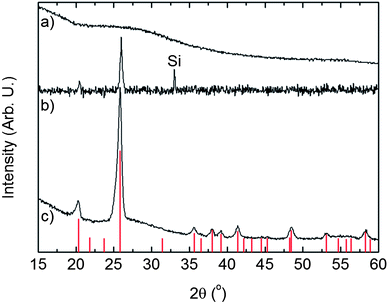 | ||
| Fig. 5 X-ray diffractograms of a 100 nm thick FePO4 film. (a) As-deposited measured with GI-XRD; (b) and (c) heat treated for 2 h at 600 °C in air and measured with XRD and GI-XRD, respectively. The vertical lines represent trigonal FePO4 PDF 29-0715. | ||
The topography of the as-deposited 100 nm thick films and of films annealed at 660 °C for 15 min in air shows rather smooth surfaces with a root mean square (RMS) roughness of ca. 0.6 nm, that increases to ca. 1.6 nm upon annealing, Fig. 6. The films were deposited in the range 220–325 °C.
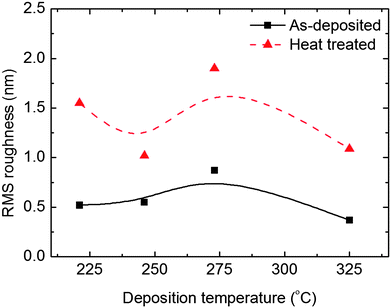 | ||
| Fig. 6 RMS roughness as measured with AFM as a function of deposition temperature for 100 nm as-deposited and annealed films on Si(111). | ||
The electrochemical activity of an amorphous 46 nm thick as-deposited FePO4 film (deposited at 246 °C) using 400 supercycles was characterized by cyclic voltammetry and galvanostatic measurements, Fig. 7 and 8.
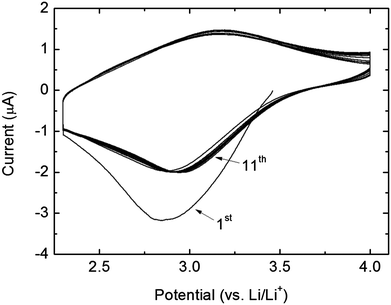 | ||
| Fig. 7 Cyclic voltammetry curves of the amorphous FePO4 thin film in the voltage range 2.3–4.0 V at a scan rate of 0.1 mV s−1. | ||
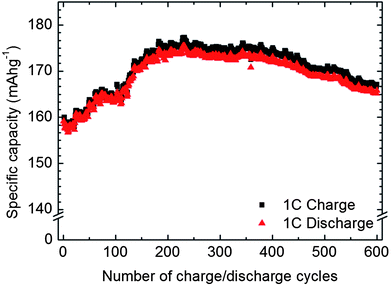 | ||
| Fig. 8 Cycling performances of the amorphous FePO4 thin film from 2.0–4.0 V at 1C rate. | ||
Previous work reports that addition of a conductive coating is required to achieve acceptable capacities for both amorphous FePO4 and crystalline LiFePO4 at current rates of 1C and higher.8,14 The ALD deposited thin films tested in this work contained no such conductive additives. We have therefore also chosen a current rate close to 1C for the galvanostatic measurements to investigate whether the inherent poor kinetics of FePO4 would be compensated by a film thickness in the nanometer range.
The cyclic voltammetry in Fig. 7 shows clear signs of reduction and oxidation taking place at 2.9 and 3.2 V, respectively. However, the features are not well defined in potential, which stems from the amorphous character of the film.
From the galvanostatic measurements (Fig. 8) the initial electrochemical capacity of the material was 159 mA h g−1 whereafter it steadily increased on cycling until it saturated at 175 mA h g−1 after 230 charge–discharge cycles. Thereafter, the capacity began gradually to decline. However, the capacity retention after 600 cycles (165 mA h g−1) is still 3% higher than the initial capacity. The electrochemical loss between charging and discharging is 0.5% at the beginning and 1% after 600 cycles, indicating good reversibility.
Discussion
As the Me3PO4 precursor does not yield thin film growth without pulsing of cation precursors, it is interesting to note that the phosphate composition, Fig. 3, saturates at around 60% P. Similar behaviour has earlier been observed for this TMP precursor. In ref. 31 Putkonen et al. reported a saturation of P/(Ca + P) = 46% for the Ca–P–O system, and in ref. 32 Sønsteby et al. observed a similar saturation of 55% in the La–P–O system.With respect to the cyclic voltammetry measurements, Fig. 7, the capacity of the first discharge is higher than the following reversible discharge capacities. This is likely attributed to SEI-layer formation and possibly other surface effects. Further in the first discharge, the peak of intercalation of lithium ions occurs at 2.84 V. In the second discharge the peak is shifted to 2.87 V, whereas it remained stable at 2.95 V in all subsequent cycles. It is therefore likely that the material rearranges during intercalation and that the increased discharge potential is due to slight changes in the Fe2+/Fe3+ local structure. The charge peaks on the other hand remained stable at 3.2 V.
Fig. 5a shows that the as-deposited films, on which the electrochemical measurements were carried out, are amorphous. Since it has not previously been observed that amorphous FePO4 crystallizes as a result of Li intercalation/deintercalation during electrochemical cycling, it is likely that the films investigated here also remained amorphous during the electrochemical measurements.7,10,12,46,47 If the films did indeed crystallize during cycling, we would have expected a decrease in capacity rather than the observed increase based on that all known crystalline phases of FePO4 have less electrochemical activity than the amorphous phase.14 Furthermore, Fig. 7 shows that the amorphous FePO4 films exhibit reversible intercalation and deintercalation of lithium at about 3 V, which is an expected value for the Fe2+/Fe3+ redox pair in an amorphous phosphate environment.7 No other peaks occur in the CV-plot that could indicate other redox active species. The lack of distinct peaks in the CV-plot supports the presence of amorphous materials,25 and also indicates single phase reactions. This is consistent with what was previously observed for a-FePO4.7,10,12,46
The high capacity observed in this work is likely due to the fact that the investigated films are only 46 nm thick, which limits the impact of the inherent poor electrical and ionic conductivity of FePO4. Amorphous materials have previously been shown to support the stress generated by lithium insertion/desertion better than crystalline films, due to a higher flexibility.25,48 To our knowledge, the type of increase in capacity during cycling we observe in our work has only been observed previously for nanostructures49,50 and amorphous films.48 We therefore suggest that the observed increase in capacity during cycling is likely linked to the amorphous structure of the film. We speculate that the flexibility of the amorphous structure allows for necessary rearrangements during lithium intercalation/deintercalation that activates more of the material, resulting in excellent cyclability. Furthermore, the advantage of an amorphous phase was also shown by K. Le Van et al. in ref. 25. They could reversibly intercalate 2.9 mole of Li into 1 mole of amorphous V2O5 in a potential window between 4 and 1.5 V versus Li/Li+. In contrast, intercalating more than 1 mole of Li into 1 mole of crystalline V2O5 results in irreversible phase changes that reduces the cycling performance.51
Conclusion
Nanostructuring of battery materials is a promising way to improve the performance of Li-ion batteries so they can meet the future demands. ALD shows large potential as an enabling technology for 3D-structured Li-ion batteries. We have developed an ALD process for deposition of electroactive FePO4 and characterized its electrochemical performance. The as-deposited material reveals excellent performance when used as a cathode in Li-ion batteries with a reversible capacity at 1C-rate as high as 98% of the theoretical capacity. In addition the material shows outstanding cyclability and after 600 charge–discharge cycles at 1C-rate the initial capacity has increased by 3%. Based on these observations nanostructured amorphous FePO4 shows great promise as a cathode for Li-ion batteries.Acknowledgements
The authors want to thank Erik Østreng for help with the XRR measurements and analysis. The current project has been funded by the University of Oslo and the Materials for 3D Battery Structures project, RCN no. 200030.Notes and references
- P. H. L. Notten, F. Roozeboom, R. A. H. Niessen and L. Baggetto, Adv. Mater., 2007, 19, 4564–4567 CrossRef CAS.
- J. W. Long, B. Dunn, D. R. Rolison and H. S. White, Chem. Rev., 2004, 104, 4463–4492 CrossRef CAS.
- D. Golodnitsky, M. Nathan, V. Yufit, E. Strauss, K. Freedman, L. Burstein, A. Gladkich and E. Peled, Solid State Ionics, 2006, 177, 2811–2819 CrossRef CAS.
- M. Knez, K. Niesch and L. Niinisto, Adv. Mater., 2007, 19, 3425–3438 CrossRef CAS.
- H. Kim, H. B. R. Lee and W. J. Maeng, Thin Solid Films, 2009, 517, 2563–2580 CrossRef CAS.
- S. M. George, Chem. Rev., 2010, 110, 111–131 CrossRef CAS.
- Y. J. Lee and A. M. Belcher, J. Mater. Chem., 2011, 21, 1033–1039 RSC.
- Y. J. Yin, Y. J. Hu, P. Wu, H. Zhang and C. X. Cai, Chem. Commun., 2012, 48, 2137–2139 RSC.
- Z. C. Shi, A. Attia, W. L. Ye, Q. Wang, Y. X. Li and Y. Yang, Electrochim. Acta, 2008, 53, 2665–2673 CrossRef CAS.
- Y. N. Song, S. F. Yang, P. Y. Zavalij and M. S. Whittingham, Mater. Res. Bull., 2002, 37, 1249–1257 CrossRef CAS.
- S. Okada, T. Yamamoto, Y. Okazaki, J. Yamaki, M. Tokunaga and T. Nishida, J. Power Sources, 2005, 146, 570–574 CrossRef CAS.
- P. P. Prosini, M. Lisi, S. Scaccia, M. Carewska, F. Cardellini and M. Pasquali, J. Electrochem. Soc., 2002, 149, A297–A301 CrossRef CAS.
- C. Masquelier, P. Reale, C. Wurm, M. Morcrette, L. Dupont and D. Larcher, J. Electrochem. Soc., 2002, 149, A1037–A1044 CrossRef CAS.
- L. X. Yuan, Z. H. Wang, W. X. Zhang, X. L. Hu, J. T. Chen, Y. H. Huang and J. B. Goodenough, Energy Environ. Sci., 2011, 4, 269–284 CAS.
- J. F. Ni, M. Morishita, Y. Kawabe, M. Watada, N. Takeichi and T. Sakai, J. Power Sources, 2010, 195, 2877–2882 CrossRef CAS.
- J. M. Tarascon and M. Armand, Nature, 2001, 414, 359–367 CrossRef CAS.
- Y. G. Wang, P. He and H. S. Zhou, Energy Environ. Sci., 2011, 4, 805–817 CAS.
- C. L. Li, B. Zhang and Z. W. Fu, J. Electrochem. Soc., 2006, 153, E160–E165 CrossRef CAS.
- A. Turkovic, A. Drasner, D. Sokcevic, M. Ritala, T. Asikainen and M. Leskela, J. Phys. IV, 1995, 5, 1133–1139 CrossRef.
- O. Nilsen, S. Foss, A. Kjekshus and H. Fjellvag, J. Nanosci. Nanotechnol., 2008, 8, 1003–1011 CAS.
- O. Nilsen, H. Fjellvag and A. Kjekshus, Thin Solid Films, 2003, 444, 44–51 CrossRef CAS.
- K. B. Klepper, O. Nilsen and H. Fjellvag, Thin Solid Films, 2007, 515, 7772–7781 CrossRef CAS.
- M. Lie, K. B. Klepper, O. Nilsen, H. Fjellvag and A. Kjekshus, Dalton Trans., 2008, 253–259 RSC.
- F. Lantelme, A. Mantoux, H. Groult and D. Lincot, J. Electrochem. Soc., 2003, 150, A1202–A1208 CrossRef CAS.
- K. Le Van, H. Groult, A. Mantoux, L. Perrigaud, F. Lantelme, R. Lindstrom, R. Badour-Hadjean, S. Zanna and D. Lincot, J. Power Sources, 2006, 160, 592–601 CrossRef CAS.
- E. Lindahl, M. Ottosson and J. O. Carlsson, Chem. Vap. Deposition, 2009, 15, 186–191 CrossRef CAS.
- M. E. Donders, H. C. M. Knoops, W. M. M. Kessels and P. H. L. Notten, ECS Trans., 2011, 41, 321–330 CrossRef CAS.
- K. B. Gandrud, A. Pettersen, O. Nilsen and H. Fjellvåg, Baltic ALD 2010 & GerALD 2, Hamburg, Germany, 2010 Search PubMed.
- M. Nieminen, L. Niinistö and R. Lappalainen, Mikrochim. Acta, 1995, 119, 13 CrossRef CAS.
- M. Tiitta, E. Nykänen, P. Soininen, L. Niinistö, M. Leskelä and R. Lappalainen, Mater. Res. Bull., 1998, 33, 1315 CrossRef CAS.
- M. Putkonen, T. Sajavaara, P. Rahkila, L. T. Xu, S. L. Cheng, L. Niinisto and H. J. Whitlow, Thin Solid Films, 2009, 517, 5819–5824 CrossRef CAS.
- H. Sønsteby, E. Østreng, H. Fjellvåg and O. Nilsen, Baltic ALD 2010 & GerALD 2, Hamburg, Germany, 2010 Search PubMed.
- J. Hämäläinen, J. Holopainen, F. Munnik, M. Heikkilä, M. Ritala and M. Leskelä, J. Phys. Chem. C, 2012, 116, 5920–5925 Search PubMed.
- M. K. Wiedmann, D. H. K. Jackson, Y. J. Pagan-Torres, E. Cho, J. A. Dumesic and T. F. Kuech, J. Vac. Sci. Technol., A, 2012, 30, 01A134–131 Search PubMed.
- J. Hämäläinen, J. Holopainen, F. Munnik, T. Hatanpää, M. Heikkilä, M. Ritala and M. Leskelä, J. Electrochem. Soc., 2012, 159, A259 CrossRef.
- M. Lie, H. Fjellvag and A. Kjekshus, Thin Solid Films, 2005, 488, 74–81 CrossRef CAS.
- O. Nilsen, M. Lie, S. Foss, H. Fjellvag and A. Kjekshus, Appl. Surf. Sci., 2004, 227, 40–47 CrossRef CAS.
- M. Lie, O. Nilsen, H. Fjellvag and A. Kjekshus, Dalton Trans., 2009, 481–489 RSC.
- M. de Ridder, P. C. van de Ven, R. G. van Welzenis, H. H. Brongersma, S. Helfensteyn, C. Creemers, P. Van Der Voort, M. Baltes, M. Mathieu and E. F. Vansant, J. Phys. Chem. B, 2002, 106, 13146–13153 CrossRef CAS.
- J. Bachmann, J. Jing, M. Knez, S. Barth, H. Shen, S. Mathur, U. Gösele and K. Nielsch, J. Am. Chem. Soc., 2007, 129, 9554–9555 CrossRef CAS.
- M. Rooth, A. Johansson, K. Kukli, J. Aarik, M. Boman and A. Harsta, Chem. Vap. Deposition, 2008, 14, 67–70 CrossRef CAS.
- G. S. Hammond, C. H. S. Wu and D. C. Nonhebel, Inorg. Chem., 1963, 2, 73–76 CrossRef CAS.
- M. Bjorck and G. Andersson, J. Appl. Crystallogr., 2007, 40, 1174–1178 CrossRef.
- UniQuant Version 2 User Manual, Omega Data Systems, Veldhoven, The Netherlands, 1994 Search PubMed.
- H. N. Ng and C. Calvo, Can. J. Chem., 1975, 53, 2064–2067 CrossRef CAS.
- Y. S. Hong, K. S. Ryu, Y. J. Park, M. G. Kim, J. M. Lee and S. H. Chang, J. Mater. Chem., 2002, 12, 1870–1874 RSC.
- S. W. Kim, J. Ryu, C. B. Park and K. Kang, Chem. Commun., 2010, 46, 7409–7411 RSC.
- X. F. Li, X. B. Meng, J. Liu, D. S. Geng, Y. Zhang, M. N. Banis, Y. L. Li, J. L. Yang, R. Y. Li, X. L. Sun, M. Cai and M. W. Verbrugge, Adv. Funct. Mater., 2012, 22, 1647–1654 CrossRef CAS.
- X. J. Wang, R. Nesper, C. Villevieille and P. Novak, Adv. Energy Mater., 2013, 3, 606–614 CrossRef CAS.
- S. Nordlinder, K. Edström and T. Gustafsson, Electrochem. Solid-State Lett., 2001, 4, A129–A131 CrossRef CAS.
- C. Delmas, H. Cognacauradou, J. M. Cocciantelli, M. Menetrier and J. P. Doumerc, Solid State Ionics, 1994, 69, 257–264 CrossRef CAS.
| This journal is © The Royal Society of Chemistry 2013 |
