 Open Access Article
Creative Commons Attribution 3.0 Unported Licence
Bicrystalline TiO2 with controllable anatase–brookite phase content for enhanced CO2 photoreduction to fuels†
Huilei
Zhao
a,
Lianjun
Liu
a,
Jean M.
Andino
bc and
Ying
Li
*a
aMechanical Engineering Department, University of Wisconsin-Milwaukee, 3200 N Cramer St, Milwaukee, Wisconsin, USA. E-mail: liying@uwm.edu; Fax: +1-414-229-6958; Tel: +1-414-229-3716
bChemical Engineering, Arizona State University, USA
cCivil, Environmental, and Sustainable Engineering, Arizona State University, USA
First published on 28th May 2013
Abstract
Among the three naturally existing phases of TiO2, brookite is the least studied as a photocatalyst. In this study, single-phase anatase and brookite, and mixed-phase anatase–brookite TiO2 nanomaterials were synthesized through a hydrothermal method. The anatase–brookite phase content was controlled by adjusting the concentration of urea in the precursor solution. XRD, Raman spectroscopy, and high-resolution TEM were used to confirm the crystal structures. SEM and TEM analyses demonstrated that anatase TiO2 were nearly spherical nanoparticles while brookite TiO2 were rod-shaped nanoparticles. UV-vis diffuse reflectance spectroscopy showed a blue shift in absorption spectra with increasing brookite content. The photocatalytic activities of the prepared bicrystalline TiO2 were evaluated for CO2 photoreduction in the presence of water vapor for production of solar fuels (CO and CH4). The activities were compared with those of pure anatase, pure brookite, and a commercial anatase–rutile TiO2 (P25). The results showed that bicrystalline anatase–brookite was generally more active than single-phase anatase, brookite, and P25. The bicrystalline mixture with a composition of 75% anatase and 25% brookite showed the highest photocatalytic activity, likely due to the enhanced interfacial charge transfer between anatase and brookite nanocrystals. In situ DRIFTS analysis showed that CO2− and HCO3− species were active reaction intermediates for CO2 photoreduction while the accumulation of non-reactive CO32− species on the TiO2 surface may be detrimental.
1 Introduction
The conversion of solar energy into fuels using CO2 as the feedstock by photocatalysts such as TiO2 offers significant promise in the development of a sustainable energy technology. The general products from CO2 photoreduction by TiO2 photocatalysts are CO, CH4, CH3OH, HCOOH, etc.1–4 However, the well-known large band gap of TiO2 and the fast recombination rate of the photogenerated electrons (e−) and holes (h+) have limited the development of solar fuel technology. Modifications of TiO2 by metal deposition or non-metal doping have been attempted to improve the CO2 conversion efficiency.1,5Anatase, brookite, and rutile are naturally existing TiO2 polymorphs.6–9 Anatase based catalysts have been demonstrated to be highly active, while rutile is less active,10,11 mainly due to the fast e− and h+ recombination in rutile.12 Mixtures of anatase–rutile such as commercially available TiO2 nanopowder, Evonik P25 (approximately 75% anatase and 25% rutile) have demonstrated higher photocatalytic activity than single-phase anatase or rutile crystals in various photocatalytic applications.13,14 Brookite is rarely studied in photocatalysis likely due to the past difficulties in synthesizing high purity brookite because of its metastable property.15–18 A few studies demonstrated the high activity of brookite in photocatalytic oxidation applications.19,20 Our recent study4 was the first one to investigate the activity of pure brookite TiO2 for CO2 photoreduction with water; brookite showed higher activity than rutile, and surface-defective brookite was even more active than anatase.
Mixed-phase TiO2 nanomaterials other than commercial P25 TiO2 nanoparticles are scarcely studied in CO2 photoreduction, and the interactions of the different phases during the CO2 photoreduction reactions have not been explored. It is believed that the junctions between different phases of TiO2 play a significant role in improving its photo-oxidation activity.6,7 Several studies have explored the mechanism for the enhanced activity of anatase and rutile mixtures such as P25; however, the findings are not conclusive. Some studies suggested that photoinduced electrons tend to transfer from the higher-level anatase conduction band (CB) to the lower-level rutile CB,21 while the holes in the anatase valance band (VB) could migrate to the rutile VB.11 On the contrary, other studies suggested that electrons transfer from rutile to anatase.12,13,22,23 Among them, Hurum et al.12,13 used electron paramagnetic resonance (EPR) spectroscopy to monitor the direction of electron migration; they suggested that electrons transfer from rutile to anatase because the energy levels of the electron trapping sites in anatase are lower than that of the rutile CB. In addition, the interfacial sites between anatase and rutile facilitate the electron transport and prevent the recombination of e− and h+.12,13 However, some recent studies reported that there are no interactions between the two phases in P25, and anatase and rutile independently catalyze reactions.24
Analogous to anatase–rutile mixed-phase TiO2, anatase–brookite heterojunctions are expected to enhance charge separation as well, probably even superior to anatase–rutile. Possible reasons are: (1) our previous study4 has discovered that brookite itself is more active than rutile in CO2 photoreduction; (2) the CB edge of brookite is slightly above that of anatase,25 making it possible for electrons to transfer from brookite to anatase even in the absence of anatase trapping sites. Some experimental evidence exists in the literature indicating that anatase–brookite mixtures are more active than anatase–rutile mixtures (e.g. P25)26 and pure anatase7,27 for photo-oxidation of organic compounds. While bicrystalline anatase–brookite TiO2 has demonstrated certain promising photocatalytic oxidation abilities, the relationship between phase composition and catalytic activity is not clear. In the case of anatase and rutile mixtures, there is an optimum phase content (i.e., anatase–rutile = 77/23) that corresponds to the highest photoactivity.28,29 The optimum phase composition in an anatase–brookite has never been explored; moreover, no studies have been reported on its application in CO2 photoreduction and the correlation of material properties with photocatalytic activities.
In this work, we have synthesized pure phase anatase, brookite, and mixed-phase anatase–brookite catalysts with a controllable brookite fraction. For the first time in the literature, we have investigated and report the effect of TiO2 phase fractions and nanostructures on CO2 photoreduction, including the optimum phase composition for CO2 photoreduction. We have also conducted in situ spectroscopic studies to investigate the CO2 reduction mechanism.
2 Experiments
2.1 Catalyst preparation
TiO2 nanocrystals of single-phase anatase and brookite and mixed-phase anatase–brookite were prepared using a hydrothermal method.19 In a typical preparation process, 10 ml titanium bis(ammonium lactate)dihydroxide (50% in H2O, Sigma-Aldrich), was mixed with 90 ml urea solution (with varying concentration of urea) and sealed in a 250 ml Teflon-lined autoclave, which was then sealed and placed in an electric oven at 160 °C for 24 h. After the hydrothermal process, the autoclave was naturally cooled down to room temperature. The precipitates were centrifuged, washed with de-ionized water, dried at 60 °C for 12 h, grinded and finally calcined at 400 °C for 3 h. To prepare pure phase anatase, the urea concentration in the precursor solution was 0.1 M. A urea concentration above 0.1 M led to the formation of an anatase–brookite mixture, and the brookite content increased with the urea concentration. At 7.0 M, pure brookite was formed. Table 1 summarizes the relation between the urea concentration and the phase composition. The prepared TiO2 mixtures were denoted as AxBy, where x and y are the phase fraction of anatase and brookite, respectively.| Catalyst | Urea conc. (M) | Anatase phase (%) | Brookite phase (%) | BET specific surface area (m2 g−1) | Pore size (nm) | Pore volume (cm3 g−1) | Band gap (eV) |
|---|---|---|---|---|---|---|---|
| A100 | 0.1 | 100 | 0 | 145.6 | 6.2 | 0.23 | 3.08 |
| A96B4 | 0.25 | 96 | 4 | 134.5 | 5.9 | 0.20 | 3.12 |
| A75B25 | 0.5 | 75 | 25 | 140.3 | 5.5 | 0.20 | 3.15 |
| A50B50 | 1.0 | 50 | 50 | 84.5 | 7.0 | 0.18 | 3.15 |
| A37B63 | 1.5 | 37 | 63 | 70.2 | 10.7 | 0.19 | 3.20 |
| B100 | 7.0 | 0 | 100 | 76.6 | 18.4 | 0.35 | 3.22 |
2.2 Catalyst characterization
The crystal structures of the prepared TiO2 samples were identified by X-ray diffraction (Scintag XDS 2000) using Cu Kα irradiation at 45 kV and a diffracted beam monochromator operated at 40 mA in the 2θ range from 20° to 50° at a scan rate of 2° min−1. The crystallite sizes of catalysts were calculated by the Scherrer equation. Quantitative phase composition analysis of as prepared TiO2 was performed using Rietveld refinement method by the MAUD software (version 2.33).30,31 The XRD data of as prepared TiO2 samples together with the known standard data of anatase (tetragonal) and brookite (orthorhombic) were loaded into the MAUD software. The isotropic model and anisotropic model were chosen for anatase and brookite, respectively.30 Peak positions and scale factors were adjusted before quantitative analysis.Raman spectroscopy was carried out with a Renishaw 1000B system in the range of 100–700 cm−1. The specific surface areas of all synthesized catalysts were obtained by nitrogen adsorption–desorption at 77 K using the Brunauer–Emmett–Teller (BET) method (Micrometrics, ASAP 2020). UV-vis spectra of the catalysts were obtained by a diffuse reflectance UV-vis spectrophotometer (Ocean Optics) using BaSO4 as the background. The morphologies of TiO2 polymorphs were characterized by scanning electron microscopy (SEM, Hitachi S4800), using a secondary electron detector (SE) at an accelerating voltage range of 5–10 kV. Transmission electron microscopy (TEM) and high-resolution transmission electron microscopy (HRTEM) were carried out with 300 keV electrons in a Hitachi H9000NAR instrument with 0.18 nm point and 0.11 nm lattice resolutions, to obtain crystal structure, morphology, and lattice information of TiO2 nanocrystals.
2.3 Photocatalytic activity measurement
The photocatalytic reduction of CO2 over the TiO2 samples was conducted in a photoreactor operating in a continuous-flow mode. The experimental setup was similar to that described in our previous work.1 A solar simulator (Oriel, 150 W) was used as the light source. The light intensity was 69.6 mW cm−2 for 200 < λ < 1000 nm and 12.5 mW cm−2 for 200 < λ < 400 nm (UV region), as measured by a spectroradiometer (International Light Technologies ILT950). The photoreactor was cylindrical shape with a stainless steel housing and a quartz window (dia. = 7.5 cm). For each test, 100 mg TiO2 powder catalyst was evenly dispersed onto a glass-fiber filter that was placed at the bottom of the photoreactor facing the light source. Ultrahigh purity CO2 (99.999%, Praxair) regulated by a mass-flow controller (MFC) continuously passed through a bubbler that contained de-ionized water. The resulting gas mixture (CO2 and 2.3 vol% H2O vapor) was introduced to the photoreactor. A gas chromatograph (GC, Agilent 7890A) equipped with a thermal conductivity detector (TCD) and a flame ionization detector (FID) was used to continuously analyze the gaseous products. A Carboxen-1010 PLOT capillary column coupled with the TCD was used for CO measurement, and a HP-PLOT-Q capillary column coupled with the FID was used for CH4 measurement.2.4 In situ DRIFTS analysis
In situ diffuse reflectance infrared Fourier transform spectroscopy (DRIFTS) is one of the most powerful tools to identify and characterize adsorption species and reaction intermediates on the catalyst surface; however, it is not often used in studying CO2 activation and reduction on TiO2. In this work, in situ DRIFTS analysis was conducted to evaluate the interaction of CO2 and H2O vapor with the photocatalyst surface in the dark and under photo-illumination. Detailed description of the DRIFTS setup can be found in our previous publication.4 The in situ experiments were conducted under such a sequential procedure: (1) the catalyst was purged with He at 200 °C to remove the residual water and hydroxyl groups on the surface, (2) a CO2–H2O mixture was continuously introduced to the DRIFTS cell for 30 min when the intensities of adsorption peaks of CO2 and H2O reached saturation levels, and (3) the light from the solar simulator was introduced to the DRIFTS cell by a liquid guide. The IR spectra were recorded as a function of time to monitor the surface adsorbed species during H2O and CO2 adsorption in the dark (step 2) and the surface intermediates during the photocatalytic reaction process (step 3).3 Results and discussion
3.1 Crystal structure and morphology of TiO2 polymorphs
The urea concentration in the precursor solution was directly related to the phase content of the prepared TiO2 nanocrystals (Table 1). The crystal structure of TiO2 with different ratios of anatase–brookite was confirmed by XRD, as shown in Fig. 1a. The anatase–brookite ratios were calculated by the Rietveld refinement method. Fig. 1b shows the Rietveld refinement result of A50B50 as an example. It demonstrates three important aspects about the crystal structure of TiO2: (1) the peak positions of the fitting curve match the standard anatase and brookite peak positions nicely, which directly proved the bicrystalline TiO2 was composed of anatase and brookite mixture crystal phases; (2) the black solid fitting curve (from refinement result) and the blue dots (experimental XRD data) match very well, indicating a high goodness of fitting (GOF); and (3) the very small fluctuation of the GOF curve at the bottom indicates a high quality refinement result.32 The phase ratio is calculated by the MAUD software automatically after the appropriate refinement. The Rietveld refinement results for all the bicrystalline TiO2 samples are shown in Fig. S1 to S4 in the ESI.†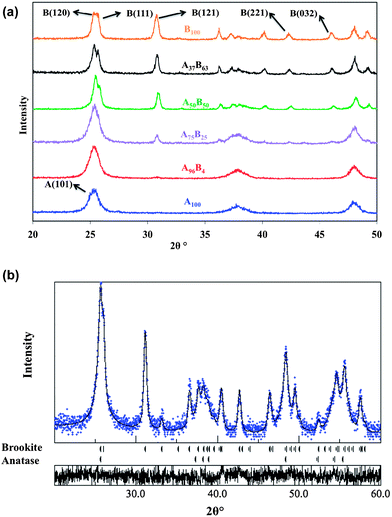 | ||
| Fig. 1 XRD patterns of the prepared TiO2 catalyst powders with different fractions of anatase and brookite phases (a); Rietveld refinement result for the A50B50 sample – solid line: fitting curve; blue dots: experimental data; bottom panel: goodness of fitting (GOF) (b). | ||
At the lowest concentration of urea (0.1 M), pure phase anatase (JCPDS no. 21-1272), i.e., A100, was obtained. With an increasing concentration of urea up to 1.5 M, bicrystalline anatase–brookite mixtures with an increasing brookite fraction, i.e., A96B4, A75B25, A50B50, and A37B63 were formed. At the highest urea concentration (7.0 M), pure brookite (JCPDS no. 29-1360) was obtained. The existence of brookite in the resultant powders is readily discernible from its unique (121), (221), and (032) diffraction peaks at 30.81, 42.34, 46.07° (2θ), respectively (Fig. 1a). Clearly, through adjusting the concentration of urea, anatase, brookite or mixtures with controllable anatase–brookite phase fractions were successfully prepared.
The morphologies of the prepared TiO2 nanocrystals were examined by SEM, as shown in Fig. 2. Pure anatase, A100, consisted of agglomerate sphere-shaped nanoparticles, while pure brookite, B100, was rod-shaped nanoparticles. For anatase–brookite mixtures, the brookite nanorods appeared to have a lower aspect ratio (brick-shaped) than those observed in pure brookite (rod-shaped). With an increasing brookite fraction in the anatase–brookite mixtures, the number of nanobricks/nanorods increased and the size became larger. Eventually, the brookite crystals evolved from nanobricks to nanorods as the brookite content approached 100%.
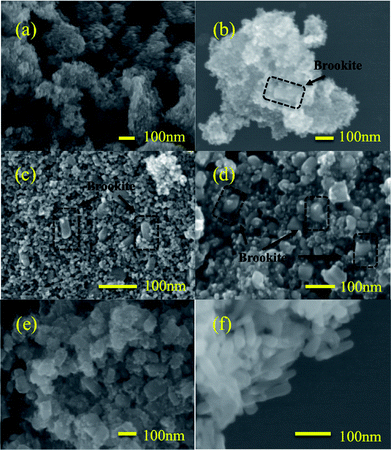 | ||
| Fig. 2 SEM images of A100 (a), A96B4 (b), A75B25 (c), A50B50 (d), A37B63 (e), and B100 (f). The circled areas in black in (b), (c), and (d) indicate brookite nanobricks. | ||
The particle size, morphology, and lattice structure of A75B25 were further evaluated by TEM and HRTEM, as shown in Fig. 3. Mixtures of spherical and rod-shaped nanoparticles were observed (Fig. 3a). The spherical particles are in the range of 5–10 nm and the nanorod has a width of 20 nm and length of 60 nm. HRTEM images in Fig. 3b and c clearly demonstrated that the spherical nanoparticle was anatase (lattice spacing = 0.35 nm, corresponding to the (101) plane) and the nanorod was brookite (lattice spacing = 0.91, 0.35 nm, corresponding to (100) and (210) plane, respectively).4
 | ||
| Fig. 3 TEM images of A75B25 (a), and HRTEM images of A75B25 (b and c). | ||
Fig. 3b and c also demonstrated the overlapping anatase and brookite particles and the interface between them. In Fig. 3b the lattice fringe becomes fuzzy and even discontinued (Region 1) where the anatase and brookite crystals overlap. An anatase particle was also located at the edge of brookite (Region 2). Besides those simple attachments of anatase particles to brookite particles, a coherent interface between anatase and brookite could be formed. As shown in Fig. 3c, the lattice spacing of the anatase (101) plane matches that of the brookite (210) plane (0.35 nm) in the region where the two particles overlap (Region 3). This observation agrees with theoretical simulation results that the brookite (210) surface and the most stable anatase (101) plane have the same type of building block, and both phases may share a common boundary.33 On anatase (101) all the octahedron units are closely packed, while on brookite (210) the rotated units are closely packed only along the direction.33,34 This difference may cause a distortion at the interface between the two crystal phases. The HRTEM images in Fig. 3 demonstrated that when anatase and brookite nanocrystals grow in the same orientation, a unique interface between them could be possibly formed.
Raman spectra (Fig. 4) have further proved the existence of both anatase and brookite crystals in the A–B mixture (A75B25). Brookite has the most intense Raman bands at ∼245, ∼320, ∼399, ∼410, and ∼637 cm−1, while anatase has intense Raman bands at ∼399, ∼519, and ∼639 cm−1.35 As compared with the spectra of A100 and B100, the Raman spectrum of A75B25 included all the bands of the two crystal phases, thus indicating a mixed phase of anatase and brookite.
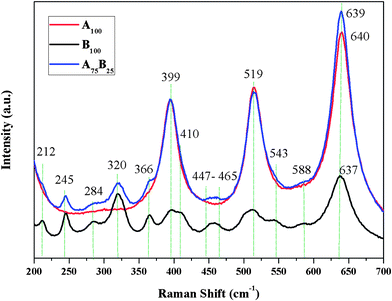 | ||
| Fig. 4 Raman spectra of A100, B100, and A75B25 samples. | ||
3.2 Textural and optical properties of TiO2 polymorphs
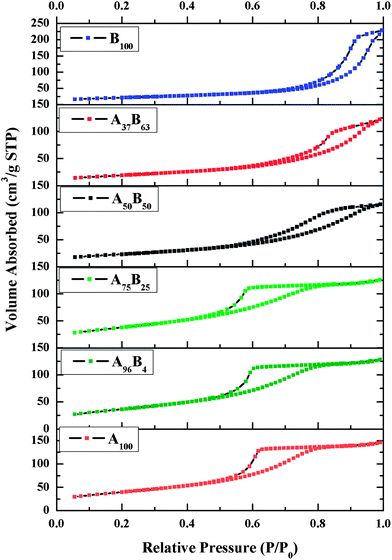
Fig. 5 shows that the N2 adsorption–desorption isotherms for all the six TiO2 samples are Type IV, characteristics of materials with mesoporous structures. The isotherms of B100 and A37B63 have a similar shape and close at a higher relative pressure compared to those of A100, A96B4, A75B25, and A50B50. Correspondingly, the calculated pore sizes of anatase-rich TiO2 are smaller than those of brookite-rich TiO2 (Table 1). This is because the inter-particle spaces between the agglomerated anatase TiO2 nanoparticles were smaller than those between the nanobricks/nanorods in brookite-rich TiO2. Table 1 also compared the BET specific surface areas of the various TiO2 catalysts. The surface areas of anatase and anatase-rich samples (A100, A96B4, and A75B25) were close (around 140 m2 g−1) and were twice as much as those of brookite-rich and pure brookite TiO2 (A37B63 and B100). The sharp decrease in surface area from A75B25 to A50B50 can be explained from their SEM images in Fig. 2: for A75B25, brookite nanobricks are embedded in agglomerated anatase nanoparticles; whereas, for A50B50, a smaller amount of anatase nanoparticles are dispersed on the surfaces of brookite nanobricks. The surface area of the larger brookite crystals is smaller than that of the smaller anatase crystals.Fig. 6 compares the UV-vis spectra, displayed in absorbance units, of the prepared TiO2 catalysts. The absorption edge of A100 is around 402 nm, corresponding to a band gap at 3.08 eV, close to the value reported in the literature.4,36 An increase in the brookite fraction in the anatase–brookite mixture results in a blue shift in the absorption spectra and an increase in the band gap (listed in Table 1). B100 has the largest band gap at 3.22 eV. The observed larger band gap of brookite than anatase agrees with that reported in the literature,19 as the conduction band of brookite is positioned at 0.14 eV more negative than that of anatase.37 The catalysts after CO2 photoreduction experiments were also characterized by UV-vis, and no changes in the catalyst band gap were observed.
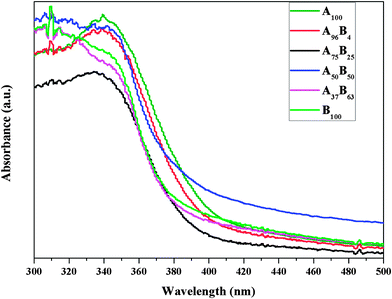 | ||
| Fig. 6 The UV-vis diffuse reflectance spectra (displayed in absorbance) of the prepared TiO2 catalysts. | ||
3.3 Photocatalytic activity for CO2 reduction
The photocatalytic activities of the prepared TiO2 catalysts were tested for CO2 photoreduction with H2O vapor. Background experiments were first conducted under the following conditions: (1) blank glass-fiber filter in the reactor without loading catalysts under the irradiation of solar simulator in a CO2 + H2O flow; (2) catalysts loaded on a glass-fiber filter in the dark in a CO2 + H2O flow; and (3) catalysts loaded on a glass-fiber filter under simulated solar radiation in a He + H2O flow. In all cases, no carbon-containing products were detected. These background tests indicated that any carbon-containing products formed (described in the subsequent part of this paper) were generated solely from the reaction of CO2 + H2O over the photocatalysts under light irradiation, not from any surface impurities on the catalysts.As consistent with our previous studies,4,5 CO was the major product and CH4 was the minor product formed during CO2 photoreduction with H2O vapor, and no other products (such as H2) were detected. The absence of H2 production was consistent with the literature that H2 production is prominent only in the presence of noble metal co-catalysts (e.g., Pt, Ag)1,38 or in the presence of sacrificial agents (e.g., CH3OH).1,39 CH4 production was much lower than CO production, likely because the formation of CH4 requires the complete reduction of CO2 to C, and a subsequent reaction with available H atoms from the decomposition of water vapor on the same catalyst surface. If the CO desorbs from the surface before it can be fully reduced, then the formation of CH4 is impacted.
Fig. 7 compares the production rates of CO on various TiO2 catalysts. For each test 100 mg of catalyst was used (see Fig. S5 in the ESI† regarding the additional experiments using different amount of catalysts and the justification of using 100 mg to study the intrinsic catalyst activity). The test for each sample was repeated twice (a fresh catalyst was used each time), and the errors were within reasonable experimental uncertainties. The CH4 production rates are not plotted in Fig. 7 because they were too low (less than 0.005 μmol h−1) and did not vary significantly for different catalysts. B100 had the lowest activity among all the catalysts, with a CO production rate at 0.07 μmol h−1. A100 had a CO production rate at 0.12 μmol h−1, higher than that of B100. The bicrystalline samples with dominating anatase phase (A96B4 and A75B25) or equal anatase–brookite content (A50B50) were the most active ones, having a CO production rate from 0.16 to 0.21 μmol h−1. The activity of A75B25 was nearly twice as high as that of A100 and three times as high as that of B100. Further increasing the brookite content (i.e., brookite-rich A37B63) led to a lower CO production rate at 0.12 μmol h−1. Commercial TiO2 P25 was also tested as comparison; it had a CO production rate of 0.13 μmol h−1, lower than the anatase-rich bicrystalline anatase–brookite samples. The above results demonstrate that the anatase-rich bicrystalline anatase–brookite mixtures are superior to single crystalline anatase or brookite and anatase–rutile mixtures (i.e., P25). Considering that pure anatase A100 had the largest specific surface area and the smallest band gap (Table 1), the higher activity of bicrystalline anatase–brookite is very likely ascribed to the interactions between the anatase and brookite nanocrystals. This interaction between anatase and brookite seems to be more effective than that between anatase and rutile (as in P25). In addition, it is reasonable to find that anatase-rich A–B mixtures are more active than brookite-rich A–B mixtures since pure anatase is more active than pure brookite.
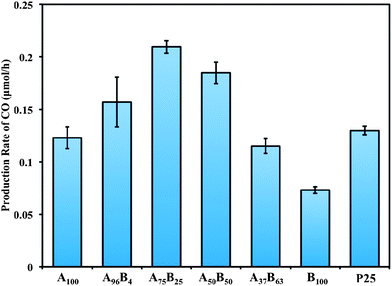 | ||
| Fig. 7 The production rates of CO using various TiO2 catalysts (the reactants were a gas mixture of 97.7 vol% CO2 and 2.3 vol% H2O; 100 mg catalysts were used for each test). | ||
The experimental results in Fig. 7 indicate that anatase rich A–B mixture with 75% anatase and 25% brookite, i.e., A75B25 is the most active among all the prepared catalysts. There are three possible reasons for its superior activity: (1) the more negative CB band of brookite may induce electron transfer from brookite to anatase, thus enhancing charge separation; (2) the facilitated formation of the intrinsic defect sites in brookite may enhance electron trapping,40 and (3) the distorted interfaces between anatase and brookite crystals (as evidenced in the HRTEM images) may facilitate interfacial electron transport and prevent the recombination of electron–hole pairs.41 It is also noticed from Fig. 6 that anatase-rich A–B mixtures such as A75B25 showed less light absorption in the UV region compared to other samples; the highest photocatalytic activity of A75B25 implies the importance of interfacial charge transfer between the A and B nanocrystals.
Additional experiments were conducted to explore the potential O2 production from H2O oxidation using the sample of A75B25. Prior to the photocatalytic reaction, the photoreactor was purged with a CO2–H2O gas mixture to eliminate the air inside the reactor. However, even after purging for a few hours, there was still background O2 (in a few hundred ppm range) together with N2 detected in the reactor effluent gas. Hence, a better indicator of O2 production by the catalyst is the volumetric ratio of O2/N2 in the effluent gas, as also suggested in the literature and in our previous work.4,42Fig. 8 shows the O2/N2 ratio before, during and after the photoreaction, when the reactor effluent gas was sampled every 15 min. Before turning on the light (in the dark), the O2/N2 ratio was steady. Immediately upon photo-illumination, the O2/N2 ratio dramatically decreased in the first 60 min and then gradually increased. The sharp decrease is probably due to the consumption of residual O2 in the reactor through the reaction with photogenerated electrons O2 + e− → O2− and consecutive reactions.4 In the meantime upon photo-illumination, the production of CO and CH4 occurred, and the rates increased to their maximum in 30 to 60 min (see Fig. S6, ESI†). This indicates that although O2 competes with CO2 for photogenerated electrons, it cannot completely block the electron transfer to CO2, since the concentration of CO2 was several orders of magnitude higher than O2 in the reactor. The gradual increase in the O2/N2 ratio after 60 min photo-irradiation (Fig. 8) indicates the generation of O2 through oxidation of H2O with photogenerated holes, H2O + 2h+ → 2H+ + (1/2)O2. Because the increasing amount of generated O2 overweighed the concurrent O2 consumption process, the net result was that the O2/N2 ratio gradually increased with time and finally reached in a steady state after 200 min. After turning off the light (the second dark period), the O2/N2 ratio dropped slightly. This result again verified the generation of O2 during the photocatalytic CO2 reduction with H2O vapor.
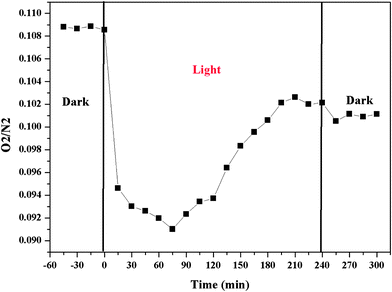 | ||
| Fig. 8 Time dependence of the volumetric ratio of O2/N2 before, during and after the photoreduction of CO2 with H2O on the A75B25. | ||
3.4 In situ DRIFTS investigation on surface chemistry and reaction intermediates
The lifetime of the catalysts used in this work was about 4 h, as the production rate of CO dropped to a very low level after 4 h of photo-illumination (results not shown). The short lifetime of photocatalysts (typically in the range of a few hours, if without sacrificial agents like methanol) is a well known research challenge in photoreduction applications including H2 production from water or CO2 reduction. The in situ DRIFTS analysis in this work is helpful to explore the surface chemistry and the reason for catalyst deactivation.As shown in Fig. 9, in the dark, CO2–H2O adsorption on A75B25 resulted in the formation of bicarbonate (HCO3−, 1220 and 1420 cm−1), bidentate carbonate (b-CO32−, 1360 and 1570 cm−1), monodentate carbonate (m-CO32−, 1300 and 1540 cm−1), and carboxylate (CO2−, 1250 and 1673 cm−1).4,43,44 The intensities of the peaks remained almost unchanged from 20 min to 30 min, indicating that the adsorption of CO2–H2O reached the saturated level on the surface of A75B25. Immediately upon photo-irradiation for 15 min, the peaks for HCO3− and CO2− species decreased or even disappeared, while the peak for surface H2O (1639 cm−1)4 and CO32− increased. Upon increasing the photo-illumination time from 15 min to 3 h, the intensities of the H2O and CO32− peaks gradually increased, while that of HCO3− was gradually decreased and CO2− completely disappeared.
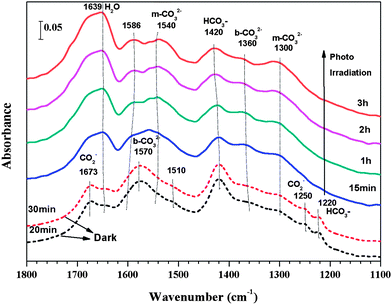 | ||
| Fig. 9 In situ DRIFTS spectra of CO2 and H2O adsorption on A75B25 for 30 min in the dark (short-dash lines), and subsequent photoreduction process under the UV-vis light irradiation for 3 h (solid lines). | ||
In our previous studies,45 we found that HCO3− and CO2−, formed from CO2 interaction with OH groups and Ti3+ sites, are the possible intermediates for CO2 photoreduction to CO and C1 fuels (e.g., CH4) once the dissociative H atom is available. The DRIFTS results in Fig. 9 again demonstrated the importance of the HCO3− and CO2− as the CO2 reduction intermediates, evidenced by the weakened HCO3− peak and the disappearance of CO2− upon photo-illumination. The increase of CO32− species could partially result from HCO3− transformation. The increase in surface H2O may be explained as follows. It is known that H2O and CO2 competitively adsorb on TiO2. H2O and CO2 adsorption reached equilibrium in the dark. Upon photo-illumination, this equilibrium was broken when adsorbed CO2 species was reduced to CO and desorbed into the gas phase. Hence, some surface sites like OH groups became available for incoming gas molecule adsorption. Because H2O has a higher binding energy with surface OH groups than CO2, once the OH groups were re-exposed, most of them may be occupied by H2O, and thus preventing subsequent CO2 adsorption on the surface. The lack of continuous formation of active CO2 adsorption species (HCO3− and CO2−, not CO32−) species may cause the observed catalyst deactivation over a few hours observed in the photocatalytic activity measurements. The above described DRIFTS results have provided significant insights into the reaction mechanism and catalyst deactivation, which have been rarely studied in the literature.
4 Conclusions
For the first time in the literature, this paper reports the superior activity of anatase-rich anatase–brookite mixtures for the photocatalytic reduction of CO2 to fuels. The interfaces between anatase and brookite nanocrystals are believed to enhance photo-induced charge transfer and electron–hole separation, and thus they are more active than single-phase anatase or brookite. Anatase-rich A–B mixtures are more active than brookite-rich A–B mixtures since the anatase nanoparticles used in this study have higher specific surface area and smaller band gaps than the brookite nanorods that were used. The anatase-rich A–B mixture (A75B25) was far more active than the anatase-rich A–R mixture with similar anatase fraction (i.e. P25). This important finding suggests a new direction for the development of efficient catalysts for CO2 photoreduction to fuels, i.e. brookite-containing mixed phase TiO2 nanocrystals including tri-phasic TiO2 (anatase–brookite–rutile). Our in situ DRIFTS analysis has demonstrated that HCO3− and CO2− species are important reaction intermediates for CO production. Unfortunately, the formation of those species cannot be sustained which may lead to the deactivation of the photocatalysts. Continued research in advancing the understanding of the surface chemistry is important to the design of more efficient photocatalyst in CO2 reduction.Acknowledgements
This work was supported by National Science Foundation (CBET-1067233 and CBET-1067340).Notes and references
- C. Y. Zhao, A. Krall, H. L. Zhao, Q. Y. Zhang and Y. Li, Int. J. Hydrogen Energy, 2012, 37, 9967–9976 CrossRef CAS.
- Y. Izumi, Coord. Chem. Rev., 2013, 257, 171–186 CrossRef CAS.
- A. Dhakshinamoorthy, S. Navalon, A. Corma and H. Garcia, Energy Environ. Sci., 2012, 5, 9217–9233 CAS.
- L. J. Liu, H. L. Zhao, J. M. Andino and Y. Li, ACS Catal., 2012, 2, 1817–1828 CrossRef CAS.
- Q. Y. Zhang, Y. Li, E. A. Ackerman, M. Gajdardziska-Josifovska and H. L. Li, Appl. Catal., A, 2011, 400, 195–202 CrossRef CAS.
- Y. L. Liao, W. X. Que, Q. Y. Jia, Y. C. He, J. Zhang and P. Zhong, J. Mater. Chem., 2012, 22, 7937–7944 RSC.
- T. Ozawa, M. Iwasaki, H. Tada, T. Akita, K. Tanaka and S. Ito, J. Colloid Interface Sci., 2005, 281, 510–513 CrossRef CAS.
- D. Reyes-Coronado, G. Rodriguez-Gattorno, M. E. Espinosa-Pesqueira, C. Cab, R. de Coss and G. Oskam, Nanotechnology, 2008, 19, 145605 CrossRef CAS.
- M. Landmann, E. Rauls and W. G. Schmidt, J. Phys.: Condens. Matter, 2012, 24, 195503 CrossRef CAS.
- G. Liu, X. W. Wang, Z. G. Chen, H. M. Cheng and G. Q. Lu, J. Colloid Interface Sci., 2009, 329, 331–338 CrossRef CAS.
- J. T. Carneiro, T. J. Savenije, J. A. Moulijn and G. Mul, J. Phys. Chem. C, 2011, 115, 2211–2217 CAS.
- D. C. Hurum, A. G. Agrios, S. E. Crist, K. A. Gray, T. Rajh and M. C. Thurnauer, J. Electron Spectrosc. Relat. Phenom., 2006, 150, 155–163 CrossRef CAS.
- D. C. Hurum, A. G. Agrios, K. A. Gray, T. Rajh and M. C. Thurnauer, J. Phys. Chem. B, 2003, 107, 4545–4549 CrossRef CAS.
- Q. Zhu, J. S. Qian, H. Pan, L. Tu and X. F. Zhou, Nanotechnology, 2011, 22, 395703 CrossRef.
- V. Stengl and D. Kralova, Mater. Chem. Phys., 2011, 129, 794–801 CrossRef CAS.
- Q. X. Deng, M. D. Wei, Z. S. Hong, X. K. Ding, L. L. Jiang and K. M. Wei, Curr. Nanosci., 2010, 6, 479–482 CrossRef CAS.
- D. Dambournet, I. Belharouak and K. Amine, Chem. Mater., 2010, 22, 1173–1179 CrossRef CAS.
- A. Garcia-Ruiz, A. Morales and X. Bokhimi, J. Alloys Compd., 2010, 495, 583–587 CrossRef CAS.
- T. A. Kandiel, A. Feldhoff, L. Robben, R. Dillert and D. W. Bahnemann, Chem. Mater., 2010, 22, 2050–2060 CrossRef CAS.
- H. Pan, X. F. Qiu, I. N. Ivanovc, H. M. Meyer, W. Wang, W. G. Zhu, M. P. Paranthaman, Z. Y. Zhang, G. Eres and B. H. Gu, Appl. Catal., B, 2009, 93, 90–95 CrossRef CAS.
- T. Kawahara, Y. Konishi, H. Tada, N. Tohge, J. Nishii and S. Ito, Angew. Chem., Int. Ed., 2002, 41, 2811–2813 CrossRef CAS.
- G. Liu, X. X. Yan, Z. G. Chen, X. W. Wang, L. Z. Wang, G. Q. Lu and H. M. Cheng, J. Mater. Chem., 2009, 19, 6590–6596 RSC.
- G. H. Li, C. P. Richter, R. L. Milot, L. Cai, C. A. Schmuttenmaer, R. H. Crabtree, G. W. Brudvig and V. S. Batista, Dalton Trans., 2009, 10078–10085 RSC.
- B. Ohtani, O. O. Prieto-Mahaney, D. Li and R. Abe, J. Photochem. Photobiol., A, 2010, 216, 179–182 CrossRef CAS.
- A. Di Paola, M. Bellardita, R. Ceccato, L. Palmisano and F. Parrino, J. Phys. Chem. C, 2009, 113, 15166–15174 CAS.
- J. C. Yu, L. Z. Zhang and J. G. Yu, Chem. Mater., 2002, 14, 4647–4653 CrossRef CAS.
- S. Ardizzone, C. L. Bianchi, G. Cappelletti, S. Gialanella, C. Pirola and V. Ragaini, J. Phys. Chem. C, 2007, 111, 13222–13231 CAS.
- S. Bakardjieva, J. Subrt, V. Stengl, M. J. Dianez and M. J. Sayagues, Appl. Catal., B, 2005, 58, 193–202 CrossRef CAS.
- M. Boehme and W. Ensinger, Nano-Micro Lett., 2011, 3, 236–241 CrossRef CAS.
- H. R. Wenk, L. Lutterotti and S. C. Vogel, Powder Diffr., 2010, 25, 283–296 CrossRef CAS.
- M. Rezaee, S. M. M. Khoie and K. H. Liu, CrystEngComm, 2011, 13, 5055–5061 RSC.
- B. H. Toby, Powder Diffr., 2006, 21, 67–70 CrossRef CAS.
- X. Q. Gong and A. Selloni, Phys. Rev. B: Condens. Matter Mater. Phys., 2007, 76, 11 Search PubMed.
- Rashmi, N. Singh and A. K. Sarkar, Powder Diffr., 2004, 19, 141–144 CrossRef CAS.
- K. R. Moonoosawmy, H. Katzke, M. Es-Souni, M. Dietze and M. Es-Souni, Langmuir, 2012, 28, 6706–6713 CrossRef CAS.
- K. Nagaveni, M. S. Hegde, N. Ravishankar, G. N. Subbanna and G. Madras, Langmuir, 2004, 20, 2900–2907 CrossRef CAS.
- T. A. Kandiel, L. Robben, A. Alkaim and D. Bahnemann, Photochem. Photobiol. Sci., 2013, 12, 602–609 CAS.
- O. K. Varghese, M. Paulose, T. J. LaTempa and C. A. Grimes, Nano Lett., 2009, 9, 731–737 CrossRef CAS.
- X. B. Chen, L. Liu, P. Y. Yu and S. S. Mao, Science, 2011, 331, 746–750 CrossRef CAS.
- H. Pan, B. Gu and Z. Zhang, J. Chem. Theory Comput., 2009, 5, 3074–3078 CrossRef CAS.
- S. A. Wohlgemuth, R. J. White, M. G. Willinger, M. M. Titirici and M. Antonietti, Green Chem., 2012, 14, 1515–1523 RSC.
- W.-N. Wang, W.-J. An, B. Ramalingam, S. Mukherjee, D. M. Niedzwiedzki, S. Gangopadhyay and P. Biswas, J. Am. Chem. Soc., 2012, 134, 11276–11281 CrossRef CAS.
- W. Su, J. Zhang, Z. Feng, T. Chen, P. Ying and C. Li, J. Phys. Chem. C, 2008, 112, 7710–7716 CAS.
- C.-C. Yang, Y.-H. Yu, B. van der Linden, J. C. S. Wu and G. Mul, J. Am. Chem. Soc., 2010, 132, 8398–8406 CrossRef CAS.
- L. J. Liu, C. Y. Zhao and Y. Li, J. Phys. Chem. C, 2012, 116, 7904–7912 CAS.
Footnote |
| † Electronic supplementary information (ESI) available: Detailed description of the Rietveld refinement of the XRD data, and the investigation of the effect of catalyst mass on the photocatalytic activity. See DOI: 10.1039/c3ta11226h |
| This journal is © The Royal Society of Chemistry 2013 |

