 Open Access Article
Creative Commons Attribution 3.0 Unported Licence
SiC nanocrystals as Pt catalyst supports for fuel cell applications†
Rajnish
Dhiman
ab,
Erik
Johnson
c,
Eivind M.
Skou
b,
Per
Morgen
*a and
Shuang M.
Andersen
b
aDepartment of Physics, Chemistry and Pharmacy, University of Southern Denmark (SDU), Campusvej 55 DK-5230 Odense M, Denmark. E-mail: permorgen@sdu.dk; Fax: +45-6615 8760; Tel: +45-6550 3529
bDepartment of Chemical Engineering, Biotechnology and Environmental Technology, University of Southern Denmark (SDU), Niels Bohr Alle 1, DK-5230 Odense M, Denmark
cNano Science Center, Niels Bohr Institute, University of Copenhagen, Universitetsparken 5, Copenhagen 2100, Denmark
First published on 18th March 2013
Abstract
A robust catalyst support is pivotal to Proton Exchange Membrane Fuel Cells (PEMFCs) to overcome challenges such as catalyst support corrosion, low catalyst utilization and overall capital cost. SiC is a promising candidate material which could be applied as a catalyst support in PEMFCs. SiC nanocrystals are here synthesized using nano-porous carbon black (Vulcan® XC-72) as a template using two different reactions, which result in particle sizes in the ranges of 50–150 nm (SiC-SPR) and 25–35 nm (SiC-NS). Pt nano-catalysts of size 5–8 nm and 4–5 nm have successfully been uniformly deposited on the nanocrystals of SiC-SPR and SiC-NS by the polyol method. The SiC substrates are subjected to an acid treatment to introduce the surface groups, which help to anchor the Pt nano-catalysts. These SiC based catalysts have been found to have a higher electrochemical activity than commercially available Vulcan based catalysts (BASF & HISPEC). These promising results signal a new era of SiC based catalysts for fuel cell applications.
Introduction
The Proton Exchange Membrane Fuel Cells (PEMFCs) are, in combination with the easy availability of hydrogen or methanol, considered to be among the most promising clean energy providers in the near future for both stationary and portable power supplies.1 The catalyst support material is a vital component of PEMFCs, and it should be engineered to reduce the demand for expensive noble metal catalysts (for example, platinum). The conventionally used carbon support materials are susceptible to oxidization under the chemical and electrochemical conditions at both electrodes in the fuel cell.2,3 This corrosive environment is even made more aggressive with the catalytic effect of the noble metal particles. Furthermore, with corrosion of the carbon support the nano-sized noble metal particles may fall off leading to a loss of catalytic activity and decreasing cell performance.4,5 Generally, a good catalyst support material for fuel cells should have high chemical/electrochemical durability, high thermal stability, high mechanical strength, good thermal conductivity and a reasonably high surface area. Moreover it should be inexpensive. SiC synthesized with nano-scale dimensions possesses all of these properties and may have a high surface area.Nano-scale SiC is synthesized mainly by two different reactions, the first involving the reaction of carbon with gaseous SiO and, the second, a direct reaction of silicon with carbon. Reaction of SiO vapors with different nano-scale carbon templates has been extensively studied and used to synthesize SiC with nano-dimensions. The different starting carbon materials were carbon microfibers,6 nanodiamonds,7 activated charcoal,8carbon nanotubes9,10etc. The generation of SiO can be done by reacting Si with silica or by the carbothermal reduction of silica. There are also several methods to synthesize SiC particles using the direct reaction of silicon and carbon. Some of these methods use ion beam implantation of C ions into silicon,11 carbon and silicon ion implantation;12 a Na-flux method uses fullerene and silicon;13 a template technique forms porous SiC using polymethylsilane as a precursor14 or an induction plasma in silane.15Chemical vapor deposition methods are also used with tetramethyl silane.16,17 All these methods are, however, quite expensive, with a low yield, and they are complex. SiC nanopowders are also synthesized by different combustion reactions18 (such as from the silica–magnesium–carbon system in argon), mechanical alloying,19 and in a combination of mechanical alloying and a combustion reaction of Si and C in open air.20 Apart from the above mentioned reactions, one-dimensional SiC nanowhiskers have also been grown as a byproduct in a reaction of SiO vapors with CO,21 which is similar to the synthesis of SiC whiskers from rice hulls22 since their generation is always accompanied by SiC particulates which grow by the carbothermal reduction of silica.
Deposition of Pt on a substrate has also been a popular process in the last two decades. Esmaeilifar et al.23 have given a detailed review of all the current Pt loading methods. As a general finding, the Pt crystallite size increases when a higher Pt loading is targeted. Among the methods, the polyol process displays the best combination of a high platinum content, small particle size, and uniform dispersion. It is therefore one of the most popular techniques being used and optimized.24,25 The polyol process is a wet deposition method using ethylene glycol, acting both as a dispersing solvent for the Pt support and also as a reduction agent for the metal precursor. Only H. Lv et al.26 have earlier reported the deposition of Pt on SiC by the ethylene glycol reduction method, and they have demonstrated an electrochemical activity of 13 m2 g−1 for Pt/SiC and an enhanced activity of up to 48 m2 g−1 with the addition of Vulcan.
In the present work SiC nanocrystals have been synthesized and Pt nano-catalysts have been deposited on these (SiC) supports. The nano-scale SiC material has been synthesized using nano-porous carbon black (XC-72) as a template by either reacting it with molten silicon or SiO vapor, which forms nanocrystals in different forms and shapes. To the best of our knowledge, only Larpkiattaworn et al.27 have synthesized nano-SiC using the same solid phase reaction of silicon with carbon black, but at relatively lower temperatures (1250–1350 °C) than in the present work. Contrary to our observations, they found the reaction with SiO as a parallel synthesis route along with the solid phase reaction. The mechanism of growth of SiC nanocrystals using the solid phase reaction in the present work is explained in the ESI.† The method to grow nano-porous and micro-porous SiC from respective carbon templates by the reaction with SiO vapors has already been studied.6–10,28 The surfaces of the SiC particles were activated by treatment with oxidizing acids. The platinum nanoparticles have been deposited over the SiC support materials by using the polyol method. The platinum loaded electrocatalyst particle aggregates are characterized by X-ray diffraction, X-ray photoelectron spectroscopy, scanning electron microscopy and transmission electron microscopy for assessing the successful loading of platinum on the SiC support. The electrochemical behavior of the electrocatalysts has been investigated by a three-electrode set up using different electrodes.
Experimental methods
The synthesis of SiC nanocrystals has been carried out by using two different reactions, (1) the solid phase reaction of carbon with molten silicon and (2) a reaction of carbon with in situ generated silicon monoxide vapors.28 In the solid phase reaction, silicon powder is uniformly mixed with carbon black in a 1![[thin space (1/6-em)]](https://www.rsc.org/images/entities/char_2009.gif) :
:![[thin space (1/6-em)]](https://www.rsc.org/images/entities/char_2009.gif) 1 molar ratio and is heated to a temperature of 1525 °C ± 25 °C in a tubular furnace for 6 h in an argon flow of 250–300 ml min−1.
1 molar ratio and is heated to a temperature of 1525 °C ± 25 °C in a tubular furnace for 6 h in an argon flow of 250–300 ml min−1.
Platinum loading of SiC was carried out (after the surface treatment with concentrated acids24,29) by using potassium tetra-chloroplatinate (K2PtCl4), as the metal precursor by the polyol method.24,29 The procedures related to the syntheses of SiC nanocrystals and the deposition of Pt nanoparticles on SiC is given in detail in the ESI.† The methods of the electrode preparation and electrochemical measurements are also discussed in the ESI.†
Results and discussion
Characterization
Fig. 1 shows the XRD patterns of SiC nanocrystals and the prepared Pt/SiC electrocatalysts. The SiC nanocrystals are synthesized (1) by the solid phase reaction (designated as SiC-SPR) or (2) by the reaction of carbon with silicon monoxide (designated as SiC-NS). The peaks corresponding to SiC are observed at 2θ = 35.6°, 41.3°, 60.0°, 71.7° and 75.4°, and are due to diffraction from (111), (200), (220), (311) and (222) planes respectively. The XRD pattern of SiC confirms the presence of β-SiC. The peaks corresponding to Pt are observed at 2θ = 39.7°, 46.2° and 67.5° which correspond to reflections from (111), (200), and (220) planes respectively. The calculation of the average crystallite size using the Scherrer formula30 for the FWHM (full width at half maximum) of the peak at 2θ = 35.6° for SiC-SPR and SiC-NS gives 40 nm and 22 nm respectively. There is also a small shoulder observed at 33.6° for SiC-NS, which corresponds either to the traces of α-SiC31 or it may be the characteristic of stacking faults in β-SiC.28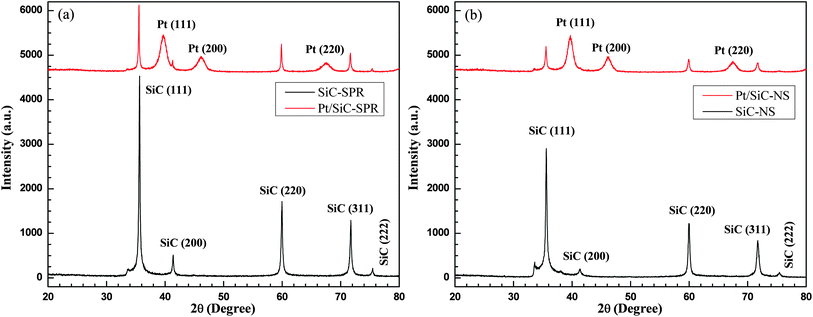 | ||
| Fig. 1 XRD patterns of SiC nanocrystals and the electrocatalysts Pt/SiC. Nanocrystals synthesized by (a) the solid phase reaction and (b) by the reaction with silicon monoxide. (The Pt traces have been shifted upwards for convenience.) | ||
The SiC nanocrystals synthesized by the solid phase reaction of carbon black and molten silicon are more crystalline than those synthesized by the reaction of carbon with SiO, as seen from the comparison of the XRD patterns of both samples (Fig. 1). The intensities of the SiC peaks are reduced considerably after loading the SiC with Pt nanoparticles due to the coverage of SiC planes or facets with Pt crystals. The intensities of the Pt peaks in both types of samples are nearly identical, indicating similar amounts of Pt on both the substrates. The mean crystal size of Pt for the samples SiC-NS and SiC-SPR is 3.7 nm and 5.6 nm respectively as calculated according to the Scherrer formula using the FWHM of the peak at 39.7°.
The Raman spectra for SiC-SPR (Fig. 2a) show two peaks with their positions in the narrow ranges of 787–790 cm−1 and 954–961 cm−1, which correspond to the transverse optical (TO) and longitudinal optical (LO) modes of the SiC.32 These peaks confirm the nanocrystals as β-SiC. The FWHMs of the observed peaks lie in the narrow ranges of 14–15 cm−1 for the TO mode and 35–45 cm−1 for the LO mode. These narrow FWHMs and small ranges of localization of the peaks show the good quality of these crystals and suggest that these samples are free from defects and stacking faults. The TO and LO peaks in SiC-NS (Fig. 2b), on the contrary, are observed in the broader ranges of 762–784 cm−1 and 910–952 cm−1 and their FWHMs lie in the range of 21–35 cm−1, suggesting that these samples contain defects and stacking faults, which are also responsible for the shifts and variation in the peak positions of the TO and LO modes. The comparison of both samples shows that SiC-SPR is more crystalline and has fewer defects than SiC-NS.
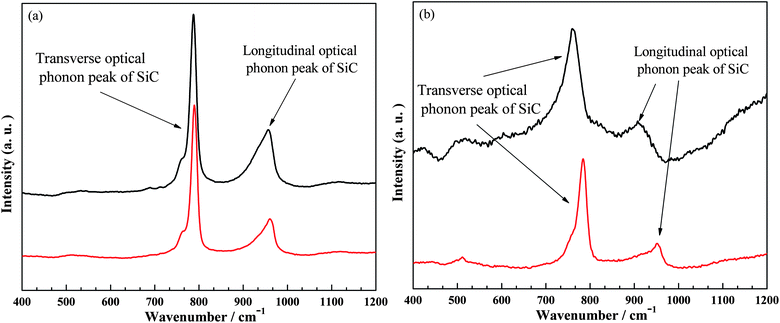 | ||
| Fig. 2 Raman spectra of SiC nanocrystals at different spots, (a) SiC-SPR and (b) SiC-NS. | ||
As demonstrated with scanning electron microscopy, the SiC nanocrystals synthesized by the solid phase reaction (SiC-SPR) are free from agglomeration and show a particular morphology, with the particle size in the range of 50–150 nm (Fig. 3a and b). A few crystals of more than 200 nm diameter are also found and the images at higher magnifications show the facets of the crystals. High magnification images, presented in the ESI (Fig. S2b†), show very fine protrusions or outgrowths at the surface of the different facets, which might have occurred during the termination of crystal growth, since the growth becomes 3-dimensional rather than lateral, during its termination due to the scarcity of silicon for reaction at nucleation sites. The SiC nanocrystals synthesized by reaction with SiO (SiC-NS) show a fluffy and porous morphology (Fig. 3c and S3a†) along with some agglomerates of different sizes. The particles appear in the form of spheres with an average size in the range of 25–35 nm. Some particles are also found to be below 20 nm in size. The images at higher magnifications indicate that the agglomerates are also porous and that the individual particles are separated from each other, thus increasing the surface area of the nanoporous SiC powder.
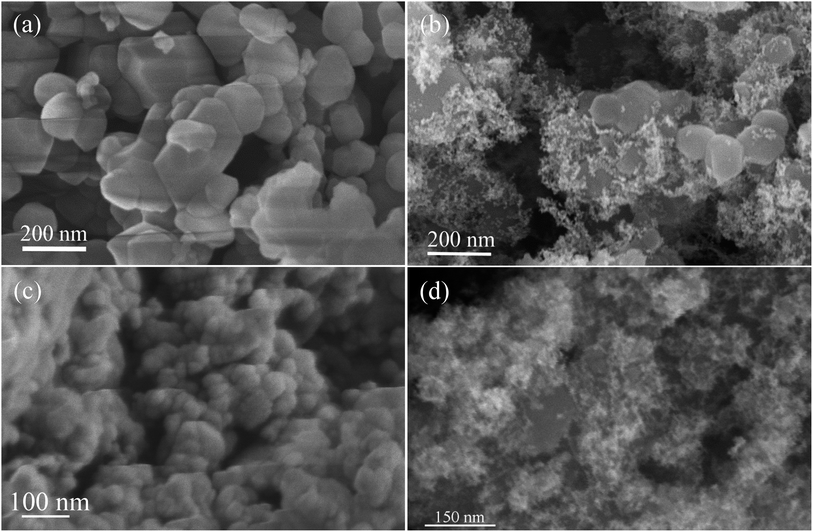 | ||
| Fig. 3 SEM images of (a) SiC-SPR (synthesized by the solid phase reaction), (b) Pt/SiC-SPR electrocatalysts, (c) SiC-NS (synthesized by the reaction with silicon monoxide) and (d) Pt/SiC-NS electrocatalysts. | ||
The SEM images of Pt loaded SiC (Fig. 3b and d) clearly show a uniform distribution of Pt nanoparticles over the SiC substrates. Pt nanoparticles appear white, in contrast to the darker SiC particles. The SiC substrates have been masked by the Pt particles. The size of the Pt nanoparticles in the samples SiC-NS and SiC-SPR is in the ranges 4–5 nm and 5–8 nm respectively. The Pt nanoparticles on both types of SiC particles have uniform sizes.
Fig. 4 shows the TEM images of SiC nanocrystals (Fig. 4a, b and d) and electrocatalysts Pt/SiC (Fig. 4c, e and f) at different magnifications. The shapes and dimensions of SiC nanocrystals are in complete agreement with those obtained from the SEM images. These images also witness the absence of agglomeration, but they show some linings and streaks in individual SiC crystals, which might be due to stacking faults and twin-interfaces. In the TEM images of Pt loaded SiC samples, Pt appears dark, while SiC appears bright. The sizes of Pt nanoparticles also show the same range as given by the SEM images. TEM confirms the uniform dispersion of Pt nanoparticles throughout the SiC substrates. The size of Pt particles in the Pt/SiC-NS sample is smaller in comparison to Pt/SiC-SPR and it also has a narrower Pt size distribution.
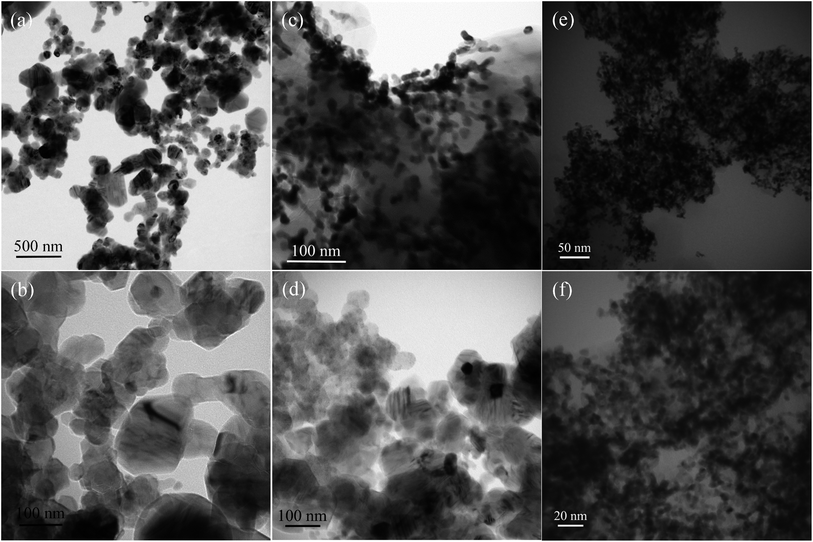 | ||
| Fig. 4 TEM images of the SiC nanocrystals and the electrocatalysts, Pt/SiC, (a) and (b) SiC-SPR, (c) Pt/SiC-SPR electrocatalysts, (d) SiC-NS and (e) and (f) Pt/SiC-NS electrocatalyst. | ||
The XPS survey spectra of Pt/SiC electrocatalysts are shown in Fig. 5, while the survey spectra of SiC nanocrystals are given in Fig. S4 of the ESI.† The survey spectra (resolution of 2.5 eV) of all the samples (with and without Pt loading) are recorded for kinetic energies from 200 eV to 1260 eV, as they are excited with an Mg X-ray source (Mg Kα). The XPS data have been analysed using the CasaXPS™ software. The spectra show the presence of silicon, carbon, and oxygen, while the samples loaded with Pt also show Pt peaks. The relative atomic percentages of the different elements within the probed depths are shown in Table S1.† The presence of oxygen indicates that the top layers of SiC are oxidized, while silicon and carbon show a near 1![[thin space (1/6-em)]](https://www.rsc.org/images/entities/char_2009.gif) :
:![[thin space (1/6-em)]](https://www.rsc.org/images/entities/char_2009.gif) 1 stoichiometry. The nanocrystal sample SiC-NS shows traces of nitrogen and it also shows a relatively higher amount of oxygen in comparison to SiC-SPR. This might be due to the longer syntheses time of SiC-NS than SiC-SPR (discussed in the ESI†). The analysis from Table S1† shows that the acid treatment reduces the amount of silicon and enhances the amount of carbon, while the amount of oxygen increases in SiC-SPR and it remains the same in SiC-NS. This might be due to the etching of surface oxide on SiC, with later addition of species containing carbon and oxygen. The acid treatment of the substrates was done to introduce oxygen containing surface groups. These surface groups are well known33,34 to help anchor the Pt particles on the support, during the reduction of the precursor solution to metallic Pt, and thus to enhance the even dispersion of platinum particles on the substrate. The platinization of the acid treated substrates significantly reduces the relative amount of carbon detected. This may be a shadow effect, due to the lower inelastic mean free paths of electrons for carbon than for silicon (explained in the ESI†).
1 stoichiometry. The nanocrystal sample SiC-NS shows traces of nitrogen and it also shows a relatively higher amount of oxygen in comparison to SiC-SPR. This might be due to the longer syntheses time of SiC-NS than SiC-SPR (discussed in the ESI†). The analysis from Table S1† shows that the acid treatment reduces the amount of silicon and enhances the amount of carbon, while the amount of oxygen increases in SiC-SPR and it remains the same in SiC-NS. This might be due to the etching of surface oxide on SiC, with later addition of species containing carbon and oxygen. The acid treatment of the substrates was done to introduce oxygen containing surface groups. These surface groups are well known33,34 to help anchor the Pt particles on the support, during the reduction of the precursor solution to metallic Pt, and thus to enhance the even dispersion of platinum particles on the substrate. The platinization of the acid treated substrates significantly reduces the relative amount of carbon detected. This may be a shadow effect, due to the lower inelastic mean free paths of electrons for carbon than for silicon (explained in the ESI†).
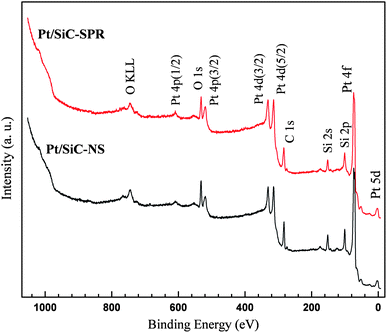 | ||
| Fig. 5 Survey XPS spectra of the electrocatalysts Pt/SiC. | ||
The deconvolution of the complex peaks in high resolution spectra (resolution of 1.3 eV) has been done by fitting these with pure Gaussian peaks on a linear background and is discussed in the ESI(Fig. S5–S7 and Tables S1–S3).† The deconvolution of the C 1s peak of nanocrystals (both types of SiC samples) shows the presence of Si–C as a major component along with small amount of C–C and C–OH, while SiC-NS also has traces of C–N (amine). Similarly the deconvolution of Si 2p shows mostly Si–C along with Si–O, while SiC-NS also shows traces of Si (N, O) (explained in the ESI†). The deconvolution of C 1s and Si 2p peaks of Pt/SiC is similar to those of SiC, with the difference of increased amounts of C–OH, C–N in C 1s, and Si (N, O) in Si 2p. As mentioned before, the addition of such surface groups is a well-known phenomenon for the acid treatment of carbon based supports33,34 (for C 1s spectrum). The Pt 4f peak in metallic Pt is generally a doublet due to spin orbit splitting and consists of 4f (7/2) at 71.1 eV and 4f (5/2) at 74.4 eV.35 Deconvolution of the Pt peaks results in three doublets, where the more intense component corresponds to metallic Pt, while the less intense peaks can be ascribed to +2-valent and +4-valent Pt as in PtO and PtO2.36
Electrochemical measurements
The electrochemical behavior of the catalysts was studied via hydrogen adsorption/desorption in aqueous acidic media using a three-electrode set up. The electrochemical active surface area (ESA) of the platinum catalyst was measured by sweeping the potential between 20 mV and 1.4 V vs. a reversible hydrogen electrode (RHE). The evaluation of the platinum surface area is carried out by measuring the columbic charge required for monolayer atomic hydrogen adsorption and is calculated with the following equation: | (1) |
The voltammogram consists of different signals and provides information about different chemical processes such as hydrogen adsorption/desorption, platinum oxide formation and stripping and double layer charging (marked in Fig. 6). Both the adsorption and desorption regions are generally composed of two distinct peaks emanating from currents due to adsorption/desorption onto the Pt (100) and Pt (110) facets of the Pt crystals. The ESA measurements for the Pt/SiC, homemade Pt/Vulcan and two commercial Vulcan based platinum catalysts were performed using a glassy carbon electrode (Fig. 6a) and a gold electrode (Fig. 6b) as supports. The conventionally used Vulcan® XC-72 was also loaded with Pt nanoparticles by the same procedure as for SiC except the acid treatment. Table 1 gives the calculated specific ESA of the samples and Fig. 6 shows the CVs of different catalysts. The nature of the voltammograms and the ESA values obtained using the two different working electrodes are fairly identical.
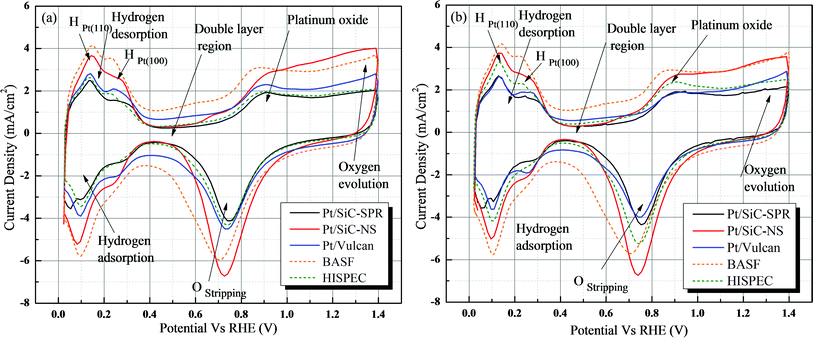 | ||
| Fig. 6 Cyclic voltammogram (CV) of different catalysts using (a) a glassy carbon electrode and (b) a gold electrode measured at 50 mV s−1 in 0.5 M HClO4. | ||
| Sample name | Pt size/nm | Pt wt% | Pt loading/μg cm−2 | ESA/m2 g−1 | |
|---|---|---|---|---|---|
| Glassy carbon electrode | Gold electrode | ||||
| a TEM results. b XRD results. | |||||
| Pt/SiC-NS | 4–5,a 3.7b | 20–22 | 120 | 55.8 | 55.9 |
| Pt/SiC-SPR | 5–8,a 5.6b | 20–22 | 120 | 35.6 | 39.2 |
| Pt/Vulcan | 5.8b | 20–22 | 120 | 33.9 | 31.0 |
| BASF | 2.5b | 20 | 120 | 50.5 | 50.1 |
| HISPEC 9000 | 5.7b | 56 | 120 | 35.5 | 43.5 |
Both SiC nanocrystals based samples show higher electrochemical activity than the homemade Pt/Vulcan catalyst. The nano-porous SiC nanocrystals (SiC-NS) demonstrate higher electrochemical activity (Pt availability) than commercial Vulcan based Pt catalysts. A possible reason for the higher ESA of Pt/SiC-NS than the commercial sample BASF is that all the Pt nanoparticles are forced to stay on the outer surface of the catalyst supports, thus it forms a network of Pt particles on the SiC, unlike the uniform dispersion of Pt on the inner nanopores of Vulcan (BASF). Thus, in the case of BASF, some of the Pt particles may not be contributing to the electrochemical activity. The higher ESA of Pt/SiC-NS in comparison to Pt/SiC-SPR is probably due to the smaller size of Pt particles. The values of ESA obtained from Pt/SiC catalysts in the present work show four times higher activity than the work presented by H. Lv et al.26 Moreover, there is no carbon involved in the SiC based catalyst support which promises a better stability for fuel cell applications. The pseudo capacitance double layer region (from 0.4 V to 0.6 V vs. RHE) for SiC is significantly narrower than for the Vulcan based catalysts (Fig. 6), which might be due to the lower specific surface area of the SiC compared to Vulcan.
Conclusions
The most essential achievements of the present work are the successful synthesis of SiC nanocrystals; the deposition of the Pt nano-catalyst on nano-scale SiC supports using the polyol method, which is conventionally used for Pt loading on carbon based supports; and the encouraging results obtained from the electrochemical surface area (ESA) measurements. The SiC nanocrystals are synthesized in two different reactions. In one reaction, molten silicon reacts with carbon black in the solid phase at a temperature of 1525 ± 25 °C under a continuous Ar flow of 250–300 ml min−1 (SiC-SPR). The SiC nanocrystals obtained are free from agglomeration and have a granular morphology with particle sizes in the range of 50–150 nm which constitutes a specific surface area of 10–19 m2 g−1. In the other reaction, SiO vapors react with carbon black at 1450 °C (SiC-NS) to form nanocrystals with the particle size in the range of 25–35 nm corresponding to 55–75 m2 g−1. Thus, this synthesis route preserves the particle size of the starting carbon material.The polyol method has been successfully applied to deposit Pt nanoparticles of size 5–8 nm (SiC-SPR) and size 4–5 nm (SiC-NS) over the SiC nanocrystals and is characterized by SEM, TEM, XRD and XPS. The standard procedure for deposition of Pt on carbon-based supports has here been implemented successfully with SiC based supports. The electrochemical activity of the catalysts has been characterized by measuring the ESA. Both SiC supported catalysts demonstrate good electrochemical activity (Pt availability), and especially Pt/SiC-NS has shown better activity (55.9 m2 g−1) than for the commercially available carbon based supports (BASF & HISPEC (50.1 & 43.5 m2 g−1)). These results open up to the use of this new class of SiC materials for fuel cell catalyst supports because of their good chemical and mechanical stability, without compromising a high electrochemical activity.
Acknowledgements
The authors are grateful to the Danish Ministry for Research and Innovation for providing a grant to R. Dhiman, 2104-05-0073 through its program for Sustainable Energy and The Environment and to the Danish PSO–PEM fuel cell durability project (2007-1-7156). Authors are thankful to S. N. Stamatin, T. Warner, P. B. Hansen, D. Kyrping, and T. Sørensen at SDU for their advice and technical support.Notes and references
- A. L. Ong, A. Bottino, G. Capannelli and A. Comite, J. Power Sources, 2008, 183, 62–68 CrossRef CAS.
- N. Cheng, S. Mu, M. Pan and P. P. Edwards, Electrochem. Commun., 2009, 11, 1610–1614 CrossRef CAS.
- L. M. Roen, C. H. Paik and T. D. Jarvi, Electrochem. Solid-State Lett., 2004, 7, A19–A22 CrossRef CAS.
- Y. Shao, G. Yin and Y. Gao, J. Power Sources, 2007, 171, 558–566 CrossRef CAS.
- X. Yu and S. Ye, J. Power Sources, 2007, 172, 145–154 CrossRef CAS.
- N. Keller, C. Pham-Huu, M. J. Ledoux, C. Estournes and G. Ehret, Appl. Catal., A, 1999, 187, 255–268 CrossRef CAS.
- N. Keller, O. Reiff, V. Keller and M. J. Ledoux, Diamond Relat. Mater., 2005, 14, 1353–1360 CrossRef CAS.
- N. Keller, C. Pham-Huu, S. Roy, M. J. Ledoux, C. Estournes and J. Guille, J. Mater. Sci., 1999, 34, 3189–3202 CrossRef CAS.
- J. Nhut, R. Vieira, L. Pesant, J. Tessonnier, N. Keller, G. Ehret, C. Pham-huu and M. J. Ledoux, Catal. Today, 2002, 76, 11–32 CrossRef CAS.
- X.-H. Sun, C.-P. Li, W.-K. Wong, N.-B. Wong, C.-S. Lee, S.-T. Lee and B.-K. Teo, J. Am. Chem. Soc., 2002, 124, 14464–14471 CrossRef CAS.
- L.-S. Liao, X.-M. Bao, Z.-F. Yang and N.-B. Min, Appl. Phys. Lett., 1995, 66, 2382–2384 CrossRef CAS.
- R. Kögler, F. Eichhorn, J. R. Kaschny, A. Mücklich, H. Reuther, W. Skorupa, C. Serre and A. Perez-Rodriguez, Appl. Phys. A: Mater. Sci. Process., 2003, 76, 827–835 CrossRef.
- F. Kawamura, H. Yamane, T. Yamada, S. Yin and T. Sato, J. Ceram. Soc. Jpn., 2007, 115, 74–76 CrossRef CAS.
- H. Wang, I. Sung, X. Li and D. Kim, J. Porous Mater., 2004, 11, 265–271 CrossRef CAS.
- F. Vivet, A. Bouchoule and L. Boufendi, J. Appl. Phys., 1998, 83, 7474–7481 CrossRef CAS.
- J. Y. Fan, X. L. Wu and P. K. Chu, Prog. Mater. Sci., 2006, 51, 983–1031 CrossRef CAS.
- V. Buschmann, S. Klein, H. Fue and H. Hahn, J. Cryst. Growth, 1998, 193, 335–341 CrossRef CAS.
- Z. Yermekova, Z. Mansurov and A. Mukasyan, Ceram. Int., 2010, 36, 2297–2305 CrossRef CAS.
- X. Y. Yang, Z. W. Huang, Y. K. Wu and H. Q. Ye, Mater. Sci. Eng., A, 2001, 300, 278–283 CrossRef.
- Y. Yang, Z.-M. Lin and J.-T. Li, J. Eur. Ceram. Soc., 2009, 29, 175–180 CrossRef.
- R. Dhiman, E. Johnson and P. Morgen, Ceram. Int., 2011, 37, 3759–3764 CrossRef CAS.
- R. V. Krishnarao and J. Subrahmanyam, Ceram. Int., 1996, 22, 489–492 CrossRef CAS.
- A. Esmaeilifar, S. Rowshanzamir, M. H. Eikani and E. Ghazanfari, Energy, 2010, 35, 3941–3957 CrossRef CAS.
- S. L. Knupp, W. Li, O. Paschos, T. M. Murray, J. Snyder and P. Haldar, Carbon, 2008, 46, 1276–1284 CrossRef CAS.
- W. Li, C. Liang, W. Zhou, J. Qiu, Z. Zhou, G. Sun and Q. Xin, J. Phys. Chem. B, 2003, 107, 6292–6299 CrossRef CAS.
- H. Lv, S. Mu, N. Cheng and M. Pan, Appl. Catal., B, 2010, 100, 190–196 CrossRef CAS.
- S. Larpkiattaworn, P. Ngernchuklin, W. Khongwong, N. Pankurddee and S. Wada, Ceram. Int., 2006, 32, 899–904 CrossRef CAS.
- R. Dhiman, V. Petrunin, K. Rana and P. Morgen, Ceram. Int., 2011, 37, 3281–3289 CrossRef CAS.
- Y. Xing, J. Phys. Chem. B, 2004, 108, 19255–19259 CrossRef CAS.
- A. L. Patterson, Phys. Rev., 1939, 56, 978–982 CrossRef CAS.
- E. Vogli, J. Mukerji, C. Hoffman, R. Kladny, H. Sieber and P. Greil, J. Am. Ceram. Soc., 2001, 84, 1236–1240 CrossRef CAS.
- R. Dhiman, K. Rana, E. Bengu and P. Morgen, J. Eur. Ceram. Soc., 2012, 32, 1105–1116 CrossRef CAS.
- F. Rodriguez-reinoso, Carbon, 1998, 36, 159–175 CrossRef CAS.
- S. Sharma and B. G. Pollet, J. Power Sources, 2012, 208, 96–119 CrossRef CAS.
- Z. Liu, L. M. Gan, L. Hong, W. Chen and J. Y. Lee, J. Power Sources, 2005, 139, 73–78 CrossRef CAS.
- N. Rajalakshmi, H. Ryu, M. Shaijumon and S. Ramaprabhu, J. Power Sources, 2005, 140, 250–257 CrossRef CAS.
Footnote |
| † Electronic supplementary information (ESI) available: The detailed experimental procedures, the growth mechanism of SiC nanocrystals and detailed XPS analysis are given along with some additional SEM and TEM images. See DOI: 10.1039/c3ta10238f |
| This journal is © The Royal Society of Chemistry 2013 |
