 Open Access Article
 This Open Access Article is licensed under a
 Creative Commons Attribution 3.0 Unported Licence
In situ high temperature powder neutron diffraction study of undoped and Ca-doped La28−xW4+xO54+3x/2 (x = 0.85)†
Anna
Magrasó
*a,
Charles H.
Hervoches
a,
Istaq
Ahmed‡
b,
Stephen
Hull
b,
Jonas
Nordström
c,
Anders Werner Bredvei
Skilbred
a and
Reidar
Haugsrud
a
aDepartment of Chemistry, Centre for Materials Science and Nanotechnology, University of Oslo, FERMiO, NO-0349, Oslo, Norway. E-mail: a.m.sola@smn.uio.no
bThe ISIS Facility, STFC Rutherford Appleton Laboratory, Chilton, Didcot, Oxfordshire OX11 0QX, UK
cDepartment of Applied Physics, Chalmers University of Technology, SE-412 96 Gothenburg, Sweden
First published on 11th January 2013
Abstract
In situ
neutron diffraction experiments of 2% Ca-doped and nominally undoped lanthanum tungstate (La28−xW4+xO54+3x/2, with x = 0.85) have been carried out under controlled pD2O and pO2 at elevated temperatures. All the diffraction patterns could be refined using an average cubic fluorite-related structure, in accordance with recent reports. The material exhibits disorder of the oxygen and the cation sublattices. Splitting of the oxygen sites around tungsten from the 32f to 96k Wyckoff position in the Fm![[3 with combining macron]](https://www.rsc.org/images/entities/char_0033_0304.gif) m space group improves the model and can better represent the oxygen disorder. No phase transition was detected from room temperature up to 800 °C under any of the studied conditions. Expansion of the unit cell constants in the presence of water at intermediate and low temperatures was correlated with the formation of protonic defects. The thermal expansion coefficient for lanthanum tungstate is rather linear under all studied conditions (∼11 × 10−6 K−1). The in situ diffraction studies are correlated with dilatometry investigations and conductivity measurements.
m space group improves the model and can better represent the oxygen disorder. No phase transition was detected from room temperature up to 800 °C under any of the studied conditions. Expansion of the unit cell constants in the presence of water at intermediate and low temperatures was correlated with the formation of protonic defects. The thermal expansion coefficient for lanthanum tungstate is rather linear under all studied conditions (∼11 × 10−6 K−1). The in situ diffraction studies are correlated with dilatometry investigations and conductivity measurements.
1 Introduction
Lanthanum tungstates, represented by the general formula La28−xW4+xO54+δv2−δ (where δ = 3x/2),1 are attractive for practical applications. These materials are predominantly proton conductors at low and intermediate temperatures2–4 with conductivity slightly above 10−3 S cm−1 at 600 °C.2–5 They are, therefore, potential candidate materials as electrolytes in proton conducting solid oxidefuel cells (PC-SOFCs).6–9 At higher temperatures, above 900 °C, significant electronic conductivity evolves under reducing conditions which, in combination with proton conductivity, makes the material suitable for applications as dense hydrogen gas separation membranes.10–15 The hydrogen flux of thick (∼1–2 mm) membranes has recently been measured for several compositions, including LWO56 (La/W = 5.6) to be ∼0.04 ml min−1 cm−2,13 “La5/6Nd1/6WO12” 0.046 ml min−1 cm−2,14 “Nd5/6La1/6WO12” 0.0145 ml min−1 cm−2,15 all at 1000 °C. Last but not the least, these tungstates are chemically stable in CO2 and H2S containing environments above 650 °C.16The crystal structure and exact stoichiometry of lanthanum tungstate have been controversial. Recent investigations show that the material can be described as La28−xW4+xO54+δv2−δ, where x is the amount of tungsten sitting on a lanthanum site and, in turn, determines how many oxygen vacancies (v) are in the structure as inherent defects.1 Lanthanum tungstate was earlier referred to as La6WO12 (La/W = 6, LWO60), which according to Yoshimura et al. only exists as a high temperature phase, not being thermodynamically stable below 1740 °C.17,18 La10W2O21 (La/W = 5) is not single phase either.5,19 A systematic study in the La/W system showed that single phase materials can be prepared at 1500 °C for stoichiometries between 5.3 and 5.7,5 and it is now established that both La6WO12 and La10W2O21 are incorrect formula simplifications of the general La28−xW4+xO54+δ.1
Previously, it was reported that the ionic conductivity decreased in the order undoped > 0.5% Ca > 5% Ca when lanthanum was substituted by calcium in LWO60 (La/W = 6).2 This indicates that acceptor substitution must either decrease the number of protons incorporated, or slow down their mobility. It was speculated that the acceptor (Ca2+) could trap protons based on the observation that the enthalpy of proton mobility increased upon acceptor doping. One of the purposes of this contribution is to determine possible structural differences between a nominally undoped and a 2% Ca-doped LWO56 to rationalise the results reported in ref. 2.
Lanthanum tungstate hydrates similarly to a nominally acceptor-doped material by interaction between oxygen vacancies and water vapour forming hydroxide defects (protons):20
| H2O(g) + OxO + v˙˙O = 2OH˙O | (1) |
In general, this reaction is exothermic, so protons dominate at low temperatures and oxygen vacancies become more significant at high temperatures. An expansion of the material at low temperatures will occur upon hydration, and this can be monitored by different techniques, including diffraction and dilatometry.
It is crucial to study the structural changes related to the dissolution of water and temperature, such as phase transitions, changes in the coordination environment of the cations or in the unit cell. In situneutron diffraction under controlled atmosphere is, in this respect, an invaluable tool to determine temperature- and atmosphere-induced structural changes that would occur under real conditions. We hereby report a crystallographic study from in situneutron diffraction experiments on undoped and Ca-doped lanthanum tungstate under controlled partial pressures of heavy water and oxygen (pD2O and pO2) from 800 °C to RT. We correlate the structural changes with expansion of the material from dilatometry and with its conducting properties.
2 Experimental procedure
2.1 Synthesis of powders and sintering
Powders of undoped lanthanum tungstate with a La/W atomic ratio of 5.6 (hereafter referred as LWO56), i.e. La28−xW4+xO54+δv2−δ (δ = 3x/2) with x = 0.85, and 2% Ca-doped LWO56 with a cation ratio (La + Ca)/W = 5.6 (Ca-LWO56) were prepared by combustion synthesis.21,22 Stoichiometric quantities of La2O3 (99.99% Aldrich) and CaCO3 (99.95%, Aldrich) were dissolved in diluted nitric acid, whereas WO3 (99.8% Alfa Aesar) was dissolved in ammonia. Ethylenediaminetetraacetic acid (99.7% Aldrich) was added to each of the solutions as complexing agent in a 1![[thin space (1/6-em)]](https://www.rsc.org/images/entities/char_2009.gif) :1 molar ratio EDTA:metal and the pH was adjusted to be in the range 7–8. After neutralization, the solutions were mixed without any visible precipitation. The solution was dried and fired at 300–500 °C followed by calcination at 1000 °C. The powders were ground, cold-pressed into tablets, and sintered in air at 1500 °C to ensure that single-phase compositions were formed, according to ref. 5. Some pellets of each composition were reserved for electrical measurements and electron probe microanalysis (EPMA, Cameca SX100), and the remaining ones were crushed for the neutron diffraction experiment.
:1 molar ratio EDTA:metal and the pH was adjusted to be in the range 7–8. After neutralization, the solutions were mixed without any visible precipitation. The solution was dried and fired at 300–500 °C followed by calcination at 1000 °C. The powders were ground, cold-pressed into tablets, and sintered in air at 1500 °C to ensure that single-phase compositions were formed, according to ref. 5. Some pellets of each composition were reserved for electrical measurements and electron probe microanalysis (EPMA, Cameca SX100), and the remaining ones were crushed for the neutron diffraction experiment.
A powder X-ray diffraction (XRD) pattern was also collected at room temperature on a Huber G670 diffractometer with Cu Kα1 radiation selected by a Ge(111) monochromator, 2θ range [4–100°], step size 0.005°, exposure time of 5 × 3 hours.
2.2 In situ neutron diffraction experiment
Neutron powder diffraction (NPD) experiments were carried out at the ISIS facility (Oxford, UK) using the POLARIS instrument23 for both LWO56 and Ca-LWO56.The sample was inserted into the humidity cell24 (see Fig. S1†) for the in situNPD experiment and datasets were collected in both dry and humid atmospheres. First, each sample was heated in a dry Ar atmosphere until 800 °C in a vanadium shielded furnace, and when no change/shift on the cell parameter was observed, it was considered that equilibrium was achieved. The neutron data were then collected for 1–2 hours from 800 to 150 °C (ΔT = 50 °C) after equilibration at each temperature. After the dry runs, the sample was heated and equilibrated at 800 °C under humid conditions, following a similar procedure as for the dry runs. The humidity (pD2O) was controlled by bubbling the carrier gas through a D2O solution at a controlled temperature of 60 °C (pD2O = 0.18 atm), where D2O was used instead of H2O to decrease incoherent scattering. A heating cord wrapped with aluminium foil was used around the flowing hose to avoid undesirable condensation.
Additional diffractograms were collected at intermediate pD2O for Ca-LWO56 every 100 °C between 200 and 800 °C. The different humidity levels were established by changing the temperature of the D2O bath from 40, 60 and 80 °C, which yielded pD2Os of 0.065, 0.18 and 0.44 atm as calculated from the pH2O at saturation temperature using the Antoine equation and a pH2O/pD2O correction factor reported by Jakll and Alexander Van Hook.25
The backscattered C-bank data were analysed by the Rietveld method26 as implemented in the GSAS software package.27
2.3 Raman spectroscopy measurements
Raman measurements were performed on a Bruker IFS 66v/s spectrometer equipped with an FRA-106 FT-Raman module. The light source was a frequency doubled Nd:YAG laser with a wavelength of 1064 nm and a power intensity of 50 mW. The resolution was 3.4 cm−1, measured as the width at half maximum of the laser line. The final spectrum was the average of 8 measurements collected for 1 hour each.2.4 Conductivity measurements
Impedance spectra were measured using a Solartron 1260 FRA at an oscillation voltage of 100 mV rms as a function of temperature in argon. By bubbling the gas in a KBr saturated water solution or through a column of P2O5 we obtain wetted (pH2O ∼ 0.03 atm) and dried (pH2O ∼ 3 × 10⁻⁵ atm) gas, respectively. The grain interior conductivity was extracted from the complex impedance plots by using a suitable equivalent circuit and the Zview software.283 Room temperature structural model: initial considerations
The position of the cations in lanthanum tungstate is, at present, known. The first structural model5 described the La1(4a), La2(24g) and W1(4b) cation positions in the F![[4 with combining macron]](https://www.rsc.org/images/entities/char_0034_0304.gif) 3m cubic model (Fig. 1a). Due to the constrictions given by the density, elemental analysis and volume of the unit cell, ∼20% of the tungsten was “missing” in the structure. The authors in ref. 5 therefore suggested the possible occurrence of W2(4d) and W3(24f), although these positions had a very low occupancy and were unlikely to be real. Later, DFT and potentials-based calculations1 confirmed that those positions were not real and rather indicated that the “additional” tungsten occupies La2 sites, i.e. tungstate sits in lanthanum sites (Fig. 1b). At first glance this seems counterintuitive, since lanthanum and tungsten have quite different ionic radii. However, the oxygen coordination around La2 is distorted and accommodates tungsten with W–O distances similar to those reported for regular (W1)O6 polyhedra.1 Tungsten (W6+) on La2 sites (La3+) increases the concentration of positive charges, which is counterbalanced by additional oxygen (O2−). In this way, the amount of oxygen vacancies in the structure is reduced and the phase becomes thermodynamically stable. DFT calculations also indicated that tungsten was (locally) 6-fold coordinated instead of the (average) 8-fold coordination reported in ref. 5.
3m cubic model (Fig. 1a). Due to the constrictions given by the density, elemental analysis and volume of the unit cell, ∼20% of the tungsten was “missing” in the structure. The authors in ref. 5 therefore suggested the possible occurrence of W2(4d) and W3(24f), although these positions had a very low occupancy and were unlikely to be real. Later, DFT and potentials-based calculations1 confirmed that those positions were not real and rather indicated that the “additional” tungsten occupies La2 sites, i.e. tungstate sits in lanthanum sites (Fig. 1b). At first glance this seems counterintuitive, since lanthanum and tungsten have quite different ionic radii. However, the oxygen coordination around La2 is distorted and accommodates tungsten with W–O distances similar to those reported for regular (W1)O6 polyhedra.1 Tungsten (W6+) on La2 sites (La3+) increases the concentration of positive charges, which is counterbalanced by additional oxygen (O2−). In this way, the amount of oxygen vacancies in the structure is reduced and the phase becomes thermodynamically stable. DFT calculations also indicated that tungsten was (locally) 6-fold coordinated instead of the (average) 8-fold coordination reported in ref. 5.
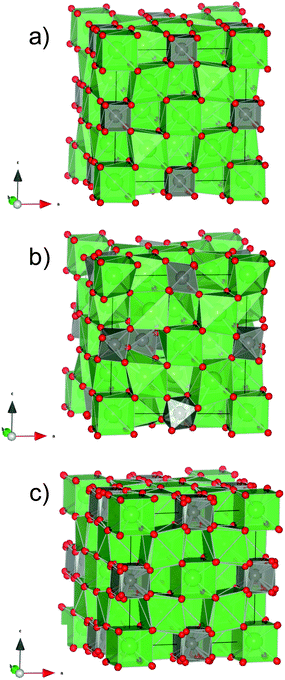 | ||
| Fig. 1 Schematic representation of the (a) averaged high symmetry crystal structure from ref. 5, (b) a relaxed local structure modeled by DFT from ref. 1, and (c) averaged structure obtained by replacing O2a and O2b from ref. 1 with the relaxed oxygen position according to the octahedra model,5 by DFT. | ||
The determination of the exact location of the oxygen sites is more troublesome since tungsten is 6-fold coordinated and forms octahedra that are disordered.1 The oxygen vacancies in lanthanum tungstate are essentially not ordered, as opposed to the tungstates with a smaller rare-earth, e.g. Y6WO12 and Ho6WO12,29 where the vacancies stay in well defined positions in the structure. In the average high symmetry description of lanthanum tungstate,5 oxygen can be located around the 16e (x, x, x) Wyckoff position: La1 is coordinated with O1a (x = 0.1376) and O1b (x = 0.8677). These oxygens are easy to locate, the refinement renders reasonable thermal factors, and form relatively symmetric LaO8 cubes. W(4b), on the other hand, is coordinated with O2a (x = 0.4005) and O2b (x = 0.5995), forms [WO8] “cubes” with oxygen positions that exhibit partial occupancy and high thermal factors. Since the coordination of tungsten with oxygen at the local scale is octahedral and not cubic, the high thermal factors of O2a and O2b are likely to reflect disorder. Fig. 1c shows the averaged structure obtained by replacing O2a and O2b from ref. 5 (Fig. 1a) with the relaxed oxygen positions forming octahedra as according to the DFT model1 (Fig. 1b). Accordingly, 3 equivalent O positions are generated around each cube corner with no preference for any of the orientations (Fig. 1c).
The relative distortion from the cubic cell has been reported to be 2.5 × 10−4,1 a deviation that is too small to be seen by the NPD data from POLARIS. Indeed, refinements using the tetragonal and rhombohedral space groups reported in ref. 1 did not improve the agreement factor. Therefore, deviation from the cubic structure in the present dataset will not be considered further.
4 Results and discussion
4.1 Raman spectroscopy measurements
Fig. 2 shows the Raman spectrum recorded for LWO56. Several bands at lower wavenumbers in the Raman spectrum are close to what has been assigned to reflect [WO6] octahedra for similar materials.30 The Raman bands due to [WO6] octahedra can be assigned as follows: ∼800 cm−1 (symmetric stretch A1g), ∼410 cm−1 (asymmetric stretch Eg), and ∼370 cm−1 (bending stretch F2g). The absence of clear bands in the 500–700 cm−1 region (characteristic of bridging W–O–W bonds) is consistent with the essentially isolated character of the polyhedra in the structure,31,32 although an additional, very weak band at ∼670 cm−1 is present. This is well in accordance with the model drawn in Fig. 1b: [(W1)O6] octahedra are mainly isolated from each other, while the [(W2La2)O6] octahedron (∼20% of the tungsten in the structure) is connected to [(W1)O6] octahedra. The small band at ∼670 cm−1 could be an indication of the connectivity between these octahedra. In addition, the presence of a symmetric stretch band position at ∼800 cm−1 suggests distortion. There are no bands above 910 cm−1, which rules out the presence of [WO4] tetrahedral moieties.30,31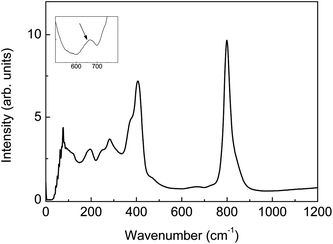 | ||
| Fig. 2 Raman spectrum of La28−xW4+xO54+3x/2 (La/W = 5.6, x = 0.85). Inset: zoom showing a weak band at ∼670 cm−1. | ||
Overall, the Raman spectrum is in agreement with the model shown in Fig. 1b;1 tungsten can be described locally as forming distorted octahedra, also consistent with average W–O distances.
4.2 Room temperature model from neutron powder diffraction data from POLARIS
Both X-ray and neutron powder diffraction data support the presence of a cubic system at room temperature with a ∼ 11.18 Å [a = 11.188(1) Å from XRD; a = 11.175(1) Å from NPD], and the microanalyses by EPMA show that the cation stoichiometry is essentially equal to that expected (Table S1†). All the Bragg peaks can be indexed using the reported F3m space group.5 Although a reasonable Rietveld refinement could be obtained, the structural model can be further improved, as described in the following paragraphs.
The Rietveld refinements were performed using F3m and Fmm space groups. The atomic positions by the two models are illustrated in Table 1. They both give a similar agreement factor: F3m: χ2 = 2.032, Rp = 0.0303, Rwp = 0.0181 for 52 variables; Fmm: χ2 = 2.225, Rp = 0.0312, Rwp = 0.019 for 47 variables. From these refinements it is evident that the positions La1(4a), La2(24g), W1(4b) and O(16e) (x ∼ 0.13 and x ∼ 0.87) in F3m and Fmm are essentially correct, and there are minimal differences by using one or the other space group. Decreasing the average symmetry further, as suggested from synchrotron studies,1 does not improve the model significantly. However, the description of the oxygen sublattice in the structure needs a slightly different approach to be represented more accurately. In the Fmm space group, it is possible to split the oxygen positions (32f) into three equivalent positions (96k) that are similar to the oxygen positions predicted by the “average” DFT structure shown in Fig. 1c. We have, therefore, refined our patterns using the Fmm space group with a split oxygen position, for which further reasoning will be discussed in the coming section. The final refined parameters are shown in Table 2 and Table 3.
m or the F3m model
|
Fmm |
F3m1 |
||
|---|---|---|---|
| Atom(Wyckoff) | Position (x y z) | Atom(Wyckoff) | Position (x y z) |
| La1(4a) | (0 0 0) | La1(4a) | (0 0 0) |
| La2(24d) | (0 0.25 0.25) | La2(24g) | (−0.004(6) 0.25 0.25) |
| W1(4b) | (0.5 0.5 0.5) | W1(4b) | (0.5 0.5 0.5) |
| O1(32f) | (x x x); x = 0.1336(1) | O1a (16e), O1b (16e) | (x x x); x = 0.1376(8), (x' x' x'); x' = 0.8677(8) |
| O2(32f) | (y y y); y = 0.4032(2) | O2a (16e), O2b (16e) | (y y y); y = 0.4005(6), (y' y' y'); y' = 0.5995(6) |
m space group (with split 96k position) at room temperature. Lattice parameter: a = 11.1746(1) Å
| Fractional atomic coordinates and isotropic or equivalent isotropic displacement parameters (Å2)a | |||||
|---|---|---|---|---|---|
| Atom | x | y | z | Ueq | Occ. |
| a χ2 = 1.716, Rp = 0.031, Rwp = 0.017, Rexp = 0.013 for 50 parameters. | |||||
| La1 | 0.0 | 0.0 | 0.0 | 0.01954 | 1.0 |
| La2 | 0.0 | 0.25 | 0.25 | 0.0325 | 0.95 |
| W1 | 0.5 | 0.5 | 0.5 | 0.01204 | 1.0 |
| O1 | 0.13369(9) | 0.13369(9) | 0.13369(9) | 0.02022 | 1.0 |
| O2 | 0.4357(3) | 0.3878(2) | 0.3878(2) | 0.0183 | 0.199(5) |
| W2 | 0.0 | 0.25 | 0.25 | 0.0325 | 0.05 |
| Atomic displacement parameters (Å2)a | ||||||
|---|---|---|---|---|---|---|
| Atom | U11 | U22 | U33 | U12 | U13 | U23 |
| La1 | 0.0195(7) | 0.0195(7) | 0.0195(7) | 0.0 | 0.0 | 0.0 |
| La2 | 0.0074(7) | 0.0451(8) | 0.0451(8) | 0.0 | 0.0 | −0.0353(7) |
| W1 | 0.0120(9) | 0.0120(9) | 0.0120(9) | 0.0 | 0.0 | 0.0 |
| O1 | 0.0202(4) | 0.0202(4) | 0.0202(4) | 0.0031(4) | 0.0031(4) | 0.0031(4) |
| O2 | 0.037(3) | 0.009(1) | 0.009(1) | −0.015(1) | −0.015(1) | −0.0010(9) |
| W2 | 0.0074(7) | 0.0451(8) | 0.0451(8) | 0.0 | 0.0 | −0.0353(7) |
Rietveld refinements corresponding to the Ca-LWO56 followed the same approach. Placing calcium in different cation sites did not make a significant difference in the refinement parameters as the doping concentration is only 2%. Moreover, the neutron coherent scattering lengths for W (4.86) and Ca (4.7) are very similar. On these bases it was not possible to determine the location of Ca.
| Atoms | Interatomic distances (Å) |
|---|---|
| La1—O1( × 8) | 2.588(1) |
| La2—O1( × 4) | 2.369(2) |
| La2—O2( × 4) | 2.294(3) |
| La2—O2( × 8) | 2.872(3) |
| W1—O2( × 24) | 1.913(3) |
4.3 The problems with the thermal factors and W–O distance: split of the oxygen position
This section will give further evidence that splitting the oxygen position improves the former model as a consequence of a disordered oxygen sublattice.The refinement of the anisotropic atomic displacement parameters (ADPs) using the “simple model” (O2 in the 32f position in the Fmm space group) is shown as supplementary material (Fig. S3†). The refinement yields very large ADPs for O2 oxygens at the 32f position (∼0.4 0.4 0.4), which are those surrounding tungsten in the cube-like symmetry description (“simple model”). Moreover, the refined ADPs for O2 have negative mean-square atomic displacements. Such physically unrealistic results suggest a strong local structural disorder, as reported for other materials.33 The refined ADPs of oxygen bonded to tungsten in this model show that the oxygen presents high anisotropy around the “corners of the cube”, which are represented as cuboids (see Fig. S5a†). An additional inconsistency we observed in the “simple model” is that the ADPs do not extrapolate towards zero at T = 0 K when drawing a median line through the O(2) Uij (Fig. S3†), which indicates that the position of the O2 atoms is either displaced or split (static disorder).
An improvement of the “simple model” can be achieved by splitting the O2 position into three equivalent positions as explained in Section 4.2, i.e. the oxygen occupying the atomic position 96k (∼0.44 0.39 0.39) with an occupancy of ∼0.2 rather than the 32f (∼0.4 0.4 0.4) with occupancy ∼0.54. Analysis of the evolution of the anisotropic ADPs (Uij) with temperature for LWO56 under wet Ar in the improved “split model” is shown in Fig. 3. The ADPs of O2 can now be fitted with a median line passing through zero at T = 0 K, which shows that the “split model” is an improvement of the former model. The ADPs are still relatively large and some slightly negative mean-square atomic displacements remain, but the evolution of Uij with temperature indicates that the ADPs in the “split model” are essentially due to localized dynamic (vibrational) disorder of the O2 oxygens around W.
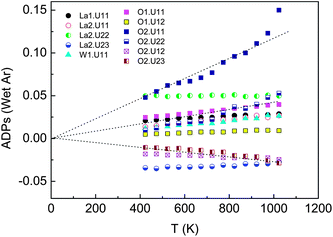 | ||
| Fig. 3 Evolution of Uij anisotropic displacement parameters with temperature in wet Ar in the “split model” with O2 in 96k position. Dashed lines are guide to the eye. | ||
This model has been independently suggested by DFT calculations,1 which support that the split of the oxygen positions is a reasonable representation of the disordered oxygen positions around tungsten (see comparison in Fig. S6†). Information about the atomic pair distribution functions (PDF) using the total scattering method34 could overcome the problem of negative mean-square atomic displacements obtained by the Rietveld method and would clearly be valuable in this highly disordered material. This is, however, out of the scope of the present contribution, and will be treated separately.
In a similar fashion, the ADPs for La2 (0 0.25 0.25) are rather large, with strong anisotropy in the La2–W1 direction, and do not extrapolate towards zero at T = 0 K. Since the site contains a mixed La/W occupancy (∼95%/5%), it is conceivable that tungsten (much smaller than lanthanum) occupies a slightly displaced position. This is consistent with both the large anisotropic ADP of the La2 site and the weak Raman band at ∼670 cm−1 that indicates the presence of W–O–O–W bonds.31 The crystal structural model from DFT calculations1 shows that the La2 cations are not perfectly aligned with each other, which is also in line with our study. We have tried to include splitting the La2 site in our model, as suggested recently by Scherb et al.,35 but the refinements are unstable and tend to diverge. It is reasonable that the La2 site may be split, but the limitations due to the high disorder of the material along with the medium resolution of the POLARIS diffractometer make it difficult to confirm this unambiguously.
The evolution of W–O distances with temperature in dry and wet Ar is displayed in Fig. 4. It shows that the apparent W–O distance is decreasing with increasing temperature, which is clearly unphysical. This artificial bond shortening is due to the disorder of the oxygen positions around tungsten. The circular oscillating movements (libration) of oxygen atoms around W increase with temperature, which make the interatomic distances appear shorter on average. The bond length was therefore corrected using the simple rigid bond model correction proposed by Downs et al.36 after which the bond length between W and O increases with increasing temperature, as expected. The La1–O and La2–O distances also increase with temperature (shown as supplementary material, Table S3†).
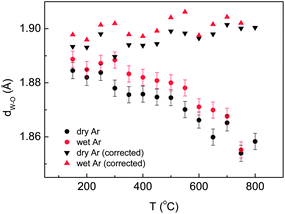 | ||
| Fig. 4 Evolution of W–O distances with temperature in dry and wet argon atmosphere (circles), and the distance corrected by the simple rigid bond correction model (triangles).36 | ||
The final refinements for both LWO56 and Ca-LWO56 at all temperatures will be performed using the Fmm space group with split oxygen position (96k). The refinement of the XRD and NPD patterns obtained at room temperature using this model are shown in Fig. 5, and the atomic coordinates and displacement parameters of LWO56 in Table 2.
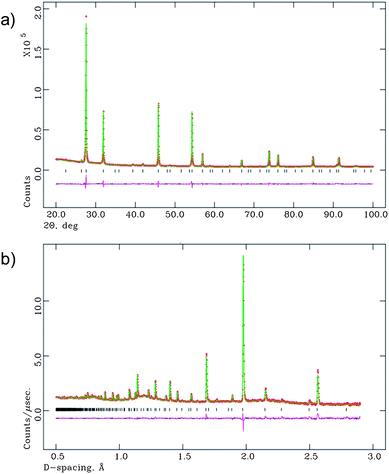 | ||
| Fig. 5 Final Rietveld fits of the (a) XRD data and (b) neutron diffraction data, at room temperature. | ||
4.4 Final Rietveld refinements as a function of temperature, humidity level and doping
Representative NPD patterns for the LWO56 in dry Ar as a function of temperature are shown in Fig. 6. There are no detectable changes in the structure from room temperature up to 800 °C and the diffractograms can be indexed and refined as Fmm space group with the “split model” described above. LWO56 does, consequently, not exhibit any phase transition from RT to 800 °C. Neither did Ca-LWO56, which could be fitted with the same model.
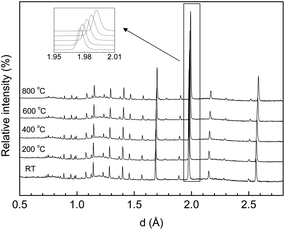 | ||
| Fig. 6 Representative NPD patterns collected in dry Ar for undoped LWO56 at different temperatures. | ||
It is interesting to investigate whether water affects the structure to any significant degree. Representative NPD patterns for both LWO56 and Ca-LWO56 in D2O–Ar and nominally dry Ar at 500 °C are shown as supplementary information (Fig. S7†). The water vapour did not introduce any measurable symmetry distortions for any of the compositions studied here, and the Rietveld refinement confirms that the structure remains as a cubic fluorite-type Fmm (on average) at all measured temperatures, pD2O and doping. Atomic positions and selected bond lengths and angles from the final Rietveld refinement at room temperature for LWO56 are presented in Table 2, and additional temperatures are available as supplementary material (Tables S4–S9).
The variation of the lattice parameter as a function of temperature in dry and wet Ar is shown in Fig. 7a. First, the lattice parameters increase with increasing temperature in a rather linear fashion, which supports the finding that the material does not exhibit any measurable phase transition over the studied temperature range. Being a cubic system, the expansion is isotropic along the three directions of the unit cell. It is important from a technological point of view that a material with a practical application exhibits a linear isotropic thermal expansion coefficient, to make thermal compatibility with the surrounding materials easier. Second, there is a small but significant decrease of the lattice parameter upon Ca substitution (in dry Ar), which indicates that some substitution has occurred, in accordance with the smaller ionic radius of Ca2+ (1.12 Å) compared to La3+ (1.16 Å) in VIII coordination.37 Third, a measurable cell expansion upon wetting is detected for both the doped and undoped LWO56, and can be associated with the incorporation of protons in the material. The differences between wet and dry conditions become smaller at higher temperatures which reflect that the concentration of protons in the structure of LWO56 and Ca-LWO56 gradually decreases as a consequence of the exothermic nature of the hydration reaction in eqn (1).20
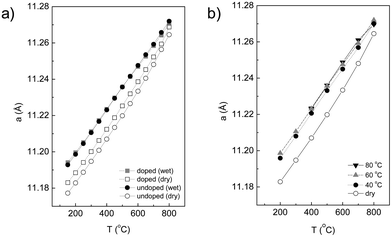 | ||
| Fig. 7 (a) Evolution of lattice parameter with temperature in dry and wet argon for both LWO56 and Ca-LWO56. (b) Additional tests with different D2O bath temperatures (variation in pH2O) for Ca-LWO56. | ||
It is important in the study of proton conductors to determine how the structure changes as a function of pH2O, and correlate this behaviour with its functional properties. This can be assessed in our experiment by following the variation in the lattice parameters with temperature under different pD2O for the Ca-LWO56, as displayed in Fig. 7b. The lattice parameters increase with increasing pD2O, which supports that the material incorporates more protons with increasing humidity, as expected from eqn (1). There are no detectable differences between pD2O of 0.18 atm (TD2O = 60 °C) and 0.44 atm (TD2O = 80 °C), which indicates that the material is saturated with water at these pressures, i.e. no more protons can be further incorporated. These results are in very good agreement with recent thermogravimetric measurements, which showed saturation of protonic defects at pH2O ∼0.2 atm.38
4.5 Dilatometric measurements
Measurements of the thermal expansion of LWO56 with temperature in wet/dry flowing air and wet/dry 5% H2/Ar are shown in Fig. 8. Several features are visible in the curves. First, it is clear that the behaviour and overall expansion of the material is quite similar in reducing and oxidizing conditions. Second, the thermal expansion under dry conditions is essentially linear with temperature from RT to 1000 °C, which is consistent with no phase transitions being detected in this temperature range, in accordance with the results from neutron diffraction. Third, there is detectable expansion from wet to dry conditions at intermediate temperatures, both under reducing and oxidizing conditions. This can be ascribed to the hydration of LWO56 on cooling, being most pronounced between ∼500 °C and ∼700 °C. This may also be correlated with the neutron diffraction dataset described earlier: the difference between the lattice parameters in wet and nominally dry conditions of LWO56 (cf.Fig. 7a) becomes progressively larger with decreasing temperature down to ∼500 °C which is in accordance with chemical expansion due to hydration.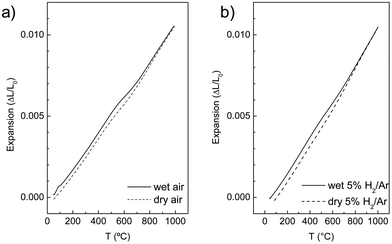 | ||
| Fig. 8 Representative temperature dependence of the linear thermal expansion for LWO56 upon cooling from 1000 to 50 °C in (a) flowing air and (b) 5% H2/Ar (harmix). | ||
The thermal expansion coefficient can be calculated from both the dilatometric studies and the evolution of the lattice parameters from the neutron diffraction experiment, which are summarized in Table 4. The overall thermal and chemical expansion coefficient of LWO56 is 10.9 × 10⁻⁶ K−1 and 11.9 × 10⁻⁶ K−1 in wet and dry Ar, respectively, while the values are 11.0 × 10⁻⁶ K−1 in wet air and wet 5% H2/Ar, and increases slightly under dry conditions: ∼11.5 × 10⁻⁶ K−1. This confirms that the expansion coefficients are very consistent within the different techniques used, essentially constant throughout the studied temperature range, independent of the oxygen partial pressure, and somewhat dependent on the water vapour partial pressure, all in line with earlier reports.1–3,5,38
| Atmosphere | From neutron diffraction (cooling cycle) | From dilatometry (cooling cycle) | ||||
|---|---|---|---|---|---|---|
| 150–500 °C | 600–800 °C | Overall | 100–550 °C | 650–900 °C | Overall | |
| Wet Ar | 11.0 | 10.9 | 10.9 | — | — | — |
| Dry Ar | 10.9 | 14.0 | 11.9 | — | — | — |
| Wet air | — | — | — | 10.8 | 11.7 | 11.0 |
| Dry air | — | — | — | 10.7 | 12.7 | 11.4 |
| Wet 5% H2/Ar | — | — | — | 10.8 | 11.7 | 11.0 |
| Dry 5% H2/Ar | — | — | — | 10.8 | 12.9 | 11.6 |
4.6 Conductivity measurements
The temperature dependence of the grain interior conductivity for both the undoped and Ca-doped LWO56 from 800 to 200 °C is shown in Fig. 9. The conductivity in wet atmospheres is considerably higher than under dry conditions, and the difference decreases with increasing temperature. This is expected for a proton conducting oxide, in accordance with the exothermic hydration reaction, eqn (1): protons dominate at intermediate and low temperatures. When comparing the conductivity of Ca-doped LWO56 with its undoped counterpart from the literature2,5,39 it is clear that 2% Ca doping does not affect the conducting properties. This behaviour seems to be well in accordance with the in situNPD experiment where the lattice parameters for both the doped and undoped samples under wetted gas are essentially identical for the whole temperature range studied here. Therefore, this work shows that 2% Ca doping in LWO56 does not seem to influence the crystal structure, hydration properties or conductivity behaviour compared to LWO56 to any significant degree. This behaviour is different from a previous report where the conductivity was observed to decrease with Ca doping.2 One may speculate whether different synthesis and thermal histories of the batches may account for this different behaviour. In this respect, it should also be mentioned that the conductivity of the 2% Ca-doped LWO56 degraded slightly upon long-term temperature exposure. This may indicate that the solubility limit of Ca is low and that changes of the grain interior composition may rationalize the effects on conductivity. One should consequently be careful while treating effects of acceptor doping of these materials.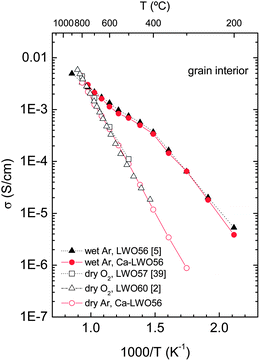 | ||
| Fig. 9 Arrhenius representation of the grain interior conductivity vs. temperature for LWO56 and Ca-LWO56, and compared to literature data. | ||
5 Summary and concluding remarks
Lanthanum tungstate (La28−xW4+xO54+δ, x = 0.85) and 2% Ca-doped lanthanum tungstate exhibit a complex fluorite-type structure that can be described in average using a Fmm space group. The description of the structure has been improved by using a “split model”, where the oxygen 32f position is split into three equivalent 96k positions. This helps to describe the disorder in these sites. In situneutron diffraction studies with controlled pO2 and pD2O reveal that there are no measurable phase transitions, and the structure remains as a cubic Fmm up to 800 °C. Doping and humidity did not alter the symmetry to any detectable degree. Saturation of protonic defects in the structure could be monitored in the neutron diffraction experiment by following the variation of the lattice parameters with temperature under controlled pD2O. The expansion of lanthanum tungstate with temperature has been measured by dilatometry to be ∼11 × 10−6 K−1, a value that corresponds well with the in situneutron diffraction data: ∼11–12 × 10−6 K−1. 2% Ca doping in LWO56 does not seem to influence the crystal structure, hydration properties or conductivity behaviour compared to LWO56 to any significant degree.
Acknowledgements
This work was supported by the “N-INNER” project (187160/S30) of the Research Council of Norway and the Science and Technology Facilities Council for provision of neutron beam time (RB 920185) and the POLARIS sample environment group at ISIS for excellent technical support. We would also like to thank Dr Polfus for providing the crystal structure figures from DFT modelling.References
- A. Magrasó, J. M. Polfus, C. Frontera, J. Canales-Vázquez, L.-E. Kalland, C. H. Hervoches, S. Erdal, R. Hancke, M. S. Islam, T. Norby and R. Haugsrud, J. Mater. Chem., 2012, 22(5), 1762–1764 RSC.
- R. Haugsrud, Solid State Ionics, 2007, 178, 555–560 CrossRef CAS.
- R. Haugsrud and C. Kjølseth, J. Phys. Chem. Solids, 2008, 69, 1758–1765 CrossRef CAS.
- T. Shimura, S. Fujimoto and H. Iwahara, Solid State Ionics, 2001, 143, 117–123 CrossRef CAS.
- A. Magrasó, C. Frontera, D. Marrero-López and P. Núñez, Dalton Trans., 2009, 10273–10283 RSC.
- R. Hancke, Z. Li and R. Haugsrud, Int. J. Hydrogen Energy, 2012, 37(9), 8043–8050 CrossRef CAS.
- R. Hancke, S. Fearn, J. A. Kilner and R. Haugsrud, Phys. Chem. Chem. Phys., 2012, 14, 13971–13978 RSC.
- C. Solís, L. Navarrete, S. Roitsch and J. M. Serra, J. Mater. Chem., 2012, 22, 16051 RSC.
- E. Quarez, K. V. Kravchyk and O. Joubert, Solid State Ionics, 2012, 216, 19–24 CrossRef CAS.
- E. Vøllestad, A. Gorzkowska-Sobas and R. Haugsrud, Thin Solid Films, 2012, 520(21), 6531–6534 CrossRef.
- M. Weirich, J. Gurauskis, V. Gil, K. Wiik and M. A. Einarsrud, Int. J. Hydrogen Energy, 2012, 37(9), 8056–8061 CrossRef CAS.
- M. E. Ivanova, J. Seeger, J. M. Serra, C. Solis, W. A. Meulenberg, W. Fischer, S. Roitsch and H. P. Buchkremer, Chemistry and Materials Research, 2012, 2(1), 56–81 Search PubMed.
- S. Erdal, PhD thesis, “Hydrogen in Oxides: incorporation, transport and effects on electrical properties”, University of Oslo, 2011.
- S. Escolástico, C. Solís and J. M. Serra, Solid State Ionics, 2012, 216, 31–35 CrossRef.
- S. Escolástico, C. Solís and J. M. Serra, Int. J. Hydrogen Energy, 2011, 36(18), 11946–11954 CrossRef.
- J. M. Serra, S. Escolástico, M. Balaguer, W. A. Meulenberg, H. P. Buchkremer, T. Scherb, G. Schumacher, M. W. Lumey and R. Dronskowski, Ceramic Hydrogen-Permeable Membranes made of Mixed Proton-Electronic Conducting Materials based on the system Ln6WO12, Proceedings of 2009 E-MRS Fall Meeting, September 14-18, Warsaw, p. 140 Search PubMed.
- M. Yoshimura, A. Rouanet and F. Sibieude, High Temp. - High Pressures, 1975, 7, 227–234 CAS.
- M. Yoshimura and J. F. Baumard, Mater. Res. Bull., 1975, 10, 983–988 CrossRef CAS.
- A. Lashtabeg, J. Bradley, A. Dicks, G. Auchterlonie and J. Drennan, J. Solid State Chem., 2010, 183(5), 1095–1101 CrossRef CAS.
- S. Erdal, L.-E. Kalland, R. Hancke, J. Polfus, R. Haugsrud, T. Norby and A. Magrasó, Int. J. Hydrogen Energy, 2012, 37(9), 8051–8055 CrossRef CAS.
- A. Magrasó, X. Solans, J. T. S. Irvine and M. Segarra, Ceram. Int., 2009, 35, 1819–1827 CrossRef.
- A. Magrasó, F. Espiell, M. Segarra and J. T. S. Irvine, J. Power Sources, 2007, 169(1), 53–58 CrossRef.
- S. Hull, R. I. Smith, W. I. F. David, A. C. Hannon, J. Mayers and R. Cywinski, Phys. B, 1992, 180–181, 1000–1002 CrossRef.
- F. G. Kinyanjui, S. T. Norberg, I. Ahmed, S. G. Eriksson and S. Hull, Solid State Ionics, 2012, 225, 312–316 CrossRef CAS.
- Gy. Jakll and W. Alexander Van Hook, J. Chem. Eng. Data, 1981, 26, 243–245 CrossRef.
- H. M. Rietveld, J. Appl. Crystallogr., 1969, 2, 65 CrossRef CAS.
- A. C. Larson and R. B. Von Dreele, Generalised Structure Analysis System Report LAUR86-748, Los Alamos National Laboratory, 2004 Search PubMed.
- D. Johnson, NC: Scribner Associates, Inc., 2002.
- N. Diot, O. Larcher, R. Marchand, J. Y. Kempf and P. Macaudière, J. Alloys Compd., 2001, 323–324, 45–48 CrossRef CAS.
- J. A. Horsley, E. Wachs, J. M. Brown, G. H. Via and F. D. Hardcastle, J. Phys. Chem., 1987, 91, 4014–4020 CrossRef CAS.
- L. Macalik, J. Hanuza and A. A. Kaminskii, J. Mol. Struct., 2000, 555, 289–297 CrossRef CAS.
- E. I. Ross-Medgaarden and I. E. Wachs, J. Phys. Chem. C, 2007, 111, 15089–15099 CAS.
- M. Gateshki, V. Petkov, S. K. Pradhan and T. Vogt, J. Appl. Crystallogr., 2005, 38, 772–779 CrossRef CAS.
- M. T. Dove, M. G. Tucker and D. A. Keen, Eur. J. Mineral., 2002, 14, 331–348 CrossRef CAS.
- T. Scherb, C. Stephan, S. A. J. Kimber, P. F. Henry, S. Escolastico and J. M. Serra, Proton diffusion through geometrically frustrated lanthanum tungstate, Presentation at the Solid State Proton Conducting Conference (SSPC16), 10–14 September 2012, Grenoble (France) Search PubMed.
- R. T. Downs, G. V. Gibbs, K. L. Bartelmehs and M. B. Boisen, Jr., Am. Mineral., 1992, 77, 751–757 CAS.
- R. D. Shannon, Acta Crystallogr., Sect. A: Cryst. Phys., Diffr., Theor. Gen. Crystallogr., 1976, 32, 751–767 CrossRef.
- R. Hancke, A. Magrasó, T. Norby and R. Haugsrud, Solid State Ionics, 2013, 231, 25–29 CrossRef.
- M. Amsif, A. Magrasó, D. Marrero-López, J. C. Ruiz-Morales, J. Canales-Vázquez and P. Núñez, Chem. Mater., 2012, 24(20), 3868–3877 CrossRef CAS.
Footnotes |
| † Electronic supplementary information (ESI) available. See DOI: 10.1039/c3ta00497j |
| ‡ Now working at Volvo Group Trucks Technology, Advanced Technology & Research, Gothenburg, Sweden. |
| This journal is © The Royal Society of Chemistry 2013 |