 Open Access Article
Creative Commons Attribution 3.0 Unported Licence
Interfacial assembly of lipopeptide surfactants on octyltrimethoxysilane-modified silica surface†
Jiqian
Wang‡
*a,
Donghui
Jia‡
ab,
Kai
Tao
a,
Chengdong
Wang
a,
Xiubo
Zhao
c,
Mohammed
Yaseen
b,
Hai
Xu
a,
Guohe
Que
a,
John R. P.
Webster
d and
Jian R.
Lu
*b
aState Key Laboratory of Heavy Oil Processing and Centre for Bioengineering and Biotechnology, China University of Petroleum (East China), 66 Changjiang West Road, Qingdao 266555, China. E-mail: jqwang@upc.edu.cn; Tel: +86-532-8698-1569
bBiological Physics Laboratory, School of Physics and Astronomy, University of Manchester, Schuster Building, Manchester M13 9PL, UK. E-mail: j.lu@manchester.ac.uk; Tel: +44 (0)-161-306-3926
cDepartment of Chemical and Biological Engineering, University of Sheffield, Mappin Street, Sheffield, S1 3JD, UK
dISIS Neutron Facility, Rutherford Appleton Laboratory, Science and Technology Facilities Council, Chilton, Didcot, Oxfordshire OX11 0QZ, UK
First published on 9th August 2013
Abstract
The adsorption of a series of cationic lipopeptide surfactants, C14Kn (where C14 denotes the myristic acyl chain and Kn represents n number of lysine residues) at the hydrophobic solid/water interface has been studied using spectroscopic ellipsometry (SE) and neutron reflection (NR). The hydrophobic C8 surface was prepared by grafting a monolayer of octyltrimethoxysilane on the silicon surface. SE was used to follow the dynamic adsorption from these lipopeptide surfactants and the amount was found to undergo a fast increase within the first 2–3 min, followed by a much slower process tending to equilibration in the subsequent 15–20 min. Lipopetide surfactants with n = 1–4 showed similar dynamic features, indicating that the interaction between the acyl chain and the C8 surface is the main driving force for adsorption. The saturation adsorption amount of C14Kn at the C8/water interface was found to be inversely related to the increasing number of Lys residues in the head group due to the increase of steric hindrance and electrostatic repulsion between the head groups. Solution concentration had a significant effect on the initial adsorption rate, similar to the feature observed from nonionic surfactants CmEn. The structure of the adsorbed layers was studied by NR in conjunction with isotopic contrasts. The layer formed by the head groups of C14K1 was 10 Å thick, and those formed by C14K2, C14K3 and C14K4 head groups were all about 13 Å thick. In contrast, the thicknesses of the layers formed by hydrophobic tails of C14K1, C14K2 C14K3, and C14K4 were found to be 17, 13, 10, and 10 Å, respectively, resulting in the steady increase of area per molecule at the interface from 29 ± 2 Å2 for C14K1 to 65 ± 2 Å2 for C14K4. Thus, with an increase in the head group length, the molecules in the adsorbed layer tended to lie down upon adsorption.
1 Introduction
Lipopeptides are comprised of an acyl chain and a short peptide head. They are an important group of biomolecules expressed by microorganisms with distinct physical and biological functions, including unusual physical, antibacterial and antifungal properties.1–5 Bacteria such as the Gram-positive genus Bacillus often produce more than twenty different amphiphilic molecules with antibiotic activity, many of which are lipopeptides.One aspect of their attractive physical properties is the reduction of surface and interfacial tension and provision of effective emulsifying and stabilizing power. A particular interest lies in identifying surface and interfacial structures that underline these important properties. Surfactin is one of the most frequently studied lipopeptides that is often linked with exceptional interfacial characteristics. It is easily expressed from different strains of Bacillus. Its peptide part is a loop of seven amino acids with the sequence of Glu-Leu-DLeu-Ala-Asp-DLeu-Leu starting from the carboxyl terminal, and the other end is linked to the β-hydroxy group on the same fatty acid chain via a lactone bond. In addition to its antibiotic properties, surfactin is one of the most powerful biosurfactants known so far. It has a low CMC (critical micellar concentration) around 1 × 10⁻⁵ M (ref. 6) and can lower the surface tension of water from 72 to some 25 mN m−1 at concentrations as low as 20 μM. Its attractive properties have now led to the first round of effort to unravel its structural features using leading physical techniques such as neutron reflection (NR) and small angle neutron scattering (SANS). The NR and SANS results showed that surfactin adopts a ball-like structure with a thickness of 15 Å and an area per molecule of 145 Å2 at both hydrophobic octadecyltrichlorosilane-coated silicon/water interface and air/water interface.7–10 The low surface tension must thus arise from the unique packing of the molecular nanoparticles.
Because of their biological origin, lipopeptide surfactants often possess good biocompatibility to mammalian hosts. These features make them attractive as biomaterials and ingredients for biomedical and personal care formulations.5,11,12 However, the development of technological applications hinges heavily on the understanding of their fundamental physical and biological properties in a systematic manner and more importantly, their behavior upon mixing with other molecules such as surfactants. Because natural lipopeptides are expressed from microorganisms, they are highly mixed and difficult to purify. In contrast, synthetic lipopeptides can be made very pure and are thus the better model systems for basic characterisation.
We have demonstrated that spectroscopic ellipsometry (SE) and neutron reflection (NR) are powerful techniques for unraveling complementary information about surfactant adsorption at different interfaces. SE allows fast and convenient monitoring of adsorption dynamics and surface adsorbed amount.13–15 However, the structure of adsorbed layers can only be derived from neutron reflection that can not only determine surface adsorbed amount but also interfacial mixing.16 Flat silicon surface has been widely used as a model in NR and SE experiments for the adsorption of many surfactants. Moreover, it can be modified conveniently to provide a hydrophobic surface by grafting a layer of hydrocarbon chains on the oxidized silicon surface with organosilanes17–20 through siloxy bonds formed between the head group of organosilane and hydroxyls on the substrate surface. The self-assembled monolayer (SAM) of closely packed alkyl chains provides a model substrate with well defined chemical nature. The SAM layer is extraordinarily stable and can be characterized by infrared absorbance and reflectance,21–23 X-ray reflectivity,24 and atomic force microscopy.25 Meanwhile, neutron reflection also has particular benefits for studying the relatively complex systems that are created when a surfactant adsorbs onto a hydrophobic SAM layer.26–29
We designed a series of linear lipopeptide surfactants C14Kn (n = 1–4) as shown in Fig. 1, where C14 denotes a straight acyl hydrocarbon chain with 14 carbons, and Kn is n number of lysine residues. The C terminus of the peptides was amidated to make the head group only carry positive charges at lysine's side amino group. The adsorption of C14Kn has recently been investigated at the hydrophilic silica/water interface.30,31 All the lipopeptides formed interfacial bilayers with little intermixing between tails and heads. It is necessary to study the adsorption of these lipopeptide surfactants on hydrophobic surface as well. In this work, we prepared the hydrophobic SAM layer on oxide silica surface with octyl trimethoxysilane (C8). Adsorption of C14Kn at the hydrophobic SAM C8/water interface was studied to understand the dynamic adsorption process and the adsorbed layer structure by a combination of SE and NR. This work thus constitutes an important effort of understanding the basic adsorption characteristics of lipopeptides and will contribute to the development of their structure–function relations.
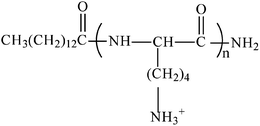 | ||
| Fig. 1 Molecular structure of lipopeptide surfactants C14Kn (n = 1–4), where C stands for the C14 acyl chain and K stands for lysine residue. | ||
2 Experimental
2.1 Chemicals
Fmoc-Lys(Boc)-OH, O-benzotriazole-N,N,N′,N′-tetramethyl-uronium hexafluoro phosphate (HBTU), 1-hydroxybenzotriazole anhydrous (HOBt anhydrous), diisopropyl ethylamine (DIEA), and Rink-amide MBHA resin were purchased from GL Biochem (Shanghai) Ltd. Tetradecanoic acid (myristic acid, ≥99%) was purchased from Sigma-Aldrich, and deuterated tetradecanoic-d27 acid (>98% D in the acyl chain) was supplied by the Oxford Deuteration Laboratory. Trifluoroacetic acid (TFA, ≥99.0%), N,N-dimethylformamide (DMF, ≥ 99.98%), and dichloromethane (DCM, ≥ 99.98%) were obtained from BMJ Technology (Beijing) Co. Ltd. All the chemicals are used without further purification unless otherwise stated.2.2 Preparation of the surface
Silicon wafers were purchased from Compart Technology Ltd, UK. Prior to each experiment the silicon wafers were cut approximately into 1× 1 cm squares (to fit into the SE liquid measuring cell) and cleaned with 5% Decon 90 solution, followed by copious rinsing with ultrahigh quality (UHQ) water.Silicon block used for neutron reflection was polished by Crystran Ltd. UK with diamond particles of varying sizes, followed by fine polishing with 1/10 mm alumina colloids.32,33 The freshly polished surface was then rinsed with water, wiped with 5% Decon 90 solution repeatedly, and followed by further water and ethanol rinsing. The block was then immersed in an acid peroxide mixture (560 ml of 98% H2SO4 and 28 ml of 35% H2O2) for 1 min at 90 °C. It was then lifted out and rinsed with copious UHQ water. The silicon dioxide layer thickness of the wafers and blocks were 12 ± 1.5 Å as determined by SE. Silicon wafer and the oxidized blocks were immersed into 100 mM octyl trimethoxysilane in chloroform solvent for 12 h, and annealed at 150 °C overnight in a vacuum oven. The coated surfaces were then rinsed with ethanol and UHQ successively and denoted as C8 surfaces.
2.3 Synthesis of lipopeptide surfactants
The lipopeptides were synthesized using the standard Fmoc solid-phase synthesis technique on CEM Liberty microwave peptide synthesizer. The carboxyl terminal was amidated by Rink-amide resin in the synthesis. The C14 acyl chain was coupled onto the N terminal of the peptide backbone through the same procedure of coupling between amino acids to form amide bonding. The methods of synthesis and purification were described in detail in our previous papers.30,31 The final products were analyzed by HPLC and ESI-MS and the purities were over 98%. The CMC values of C14Kn were determined through surface tension measurements, with the CMC values of 0.55, 0.75, 2.0, and 2.7 mM being obtained for C14K1 to C14K4, respectively.2.4 Spectroscopic ellipsometry (SE)
SE measurements of lipopeptide adsorption on the C8 surface were carried out on a Jobin–Yvon UVISEL spectroscopic ellipsometer over the wavelength range of 300–600 nm. Silicon wafer was put at the bottom of a liquid cell specially constructed. The adsorption at the solid/liquid interface was measured with an incident angle of 70° with respect to the wafer surface. The experimental data were analyzed to give the thickness and the optical constant (the refractive index) of the layer involved, using the software DeltaPsi2. The amount of surfactant adsorbed was calculated using the following equation as proposed by De Feijter et al.:34 | (1) |
 , indicating the change in the refractive index of the surfactant solution with increasing concentration. The value of a is close to 0.18 cm3 g−1 for a variety of proteins and surfactants.
2.5 Neutron reflection (NR)
Neutron reflection experiments were carried out on a SURF reflectometer at Rutherford Appleton Laboratory (RAL), UK, with the wavelength of the neutron beam ranging from 0.5 to 6.5 Å. The silicon 〈111〉 block with one side of the large surface polished (dimensions of 6 × 5 × 1.2 cm) along with a Perspex trough of the same size was clamped by a stainless-steel frame to form a sample cell with the volume about 2 ml. The neutron beam entered one end of the small face of the silicon block, was reflected from the solid/solution interface, and exited from the other end. The typical beam illuminated area is around 3 × 4 cm after the beam was defined by a series of slits. Each reflectivity was carried out at three incidence angles of 0.35, 0.8 and 1.8°, and the reflectivity profiles were combined to cover the wave vector (κ) range between 0.012 and 0.5 Å−1. Reflectivity profiles below the critical angle were theoretically equal to unity and all the data measured were scaled accordingly. The average reflectivity between 0.3 and 0.5 Å−1 (around 2 × 10⁻⁶ in D2O) was subtracted as a constant background.The theory of neutron reflection has been described in our previous papers30,31 and also in the ESI† of this paper. The measured neutron reflectivity profiles were analyzed using models based on the optical matrix formula. The fitting usually started with an assumed interfacial structure, followed by the calculation of the reflectivity. The calculated reflectivity was then compared with the measured one. The process was iterated until the calculated one fitted the measured one well on a visual basis.
3 Results and discussion
3.1 Interfacial adsorption of lipopeptide surfactants
SE was used to follow the dynamic adsorption of lipopeptide surfactants at the hydrophobic C8/water interface. As an example, Fig. 2 shows changes in the amount of C14K1 adsorbed onto the C8 surface at pH 6 plotted as a function of time. The time dependent adsorption profiles show the initial rapid increase of adsorbed amount in the first 2–3 min, with the majority of the lipopeptide adsorbed onto the interface. The adsorption rates then level off dramatically and the adsorbed amounts tend to equilibration over the subsequent 15–20 min when the bulk solution concentration was around and above CMC. Under the low concentrations studied, the adsorbed amount didn't reach equilibration within the first 30 min. Under these conditions, lipopeptide molecules were adsorbed in single molecules during the early stage and they might lie rather flat on the surface. As the adsorption amount increased with time, the molecules would become erect. Such molecular readjustment and rearrangement would take more time. This feature is in good agreement with the results obtained from nonionic surfactants CmE6 (m = 12, 14, 16) adsorbed onto hydrophilic surfaces.35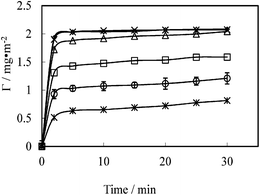 | ||
| Fig. 2 Adsorbed amount of lipopeptide surfactant C14K1versus time at the concentration of 1 mmol L−1 (◊), 0.5 mmol L−1 (×), 0.4 mmol L−1 (△), 0.125 mmol L−1 (□), 0.01 mmol L−1 (○) and 0.005 mmol L−1 (*) at the hydrophobic solid/water interface, pH 6 and 22–23 °C. The continuous line is drawn to guide the eyes. | ||
Further SE measurements of adsorption of C14Kn with n = 2, 3 and 4 at the hydrophobic C8/water interface were undertaken to examine the effect of the molecular structure of the head on adsorption process. As evident from Fig. S1,† lipopetide surfactants with greater sizes of the head group have similar dynamic features to C14K1. Although the initial rates (the slopes of the early linear parts in the curves) are very close between the four surfactants, differences are still visible. The adsorption rates decrease with increasing head group length, indicating that the steric hindrance and static repulsion among peptide head groups cause retardation or depression. It is useful to note that the slope of C14K4 is slightly larger than that of C14K3, but when the adsorbed amount is changed from mg m−2 to μmol m−2, the dynamic adsorption curve of C14K3 coincides with that of C14K4 as shown in Fig. 3. This observation indicates that the effect of peptide chain length on adsorption is not linear when it is long enough, implying subtle conformational changes. The steric hindrance and static repulsion might affect the spatial conformation and vice versa. The flexibility of lipopeptide molecules increases with the number of positively charged lysine residues. The molecules may well adopt a more flexible conformation to minimize the electrostatic repulsion. Therefore, the adsorption rates of C14K3 and C14K4 can end up almost the same.
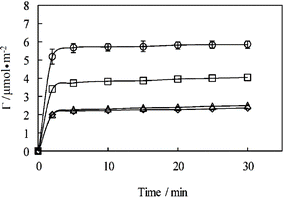 | ||
| Fig. 3 Interfacial adsorption of lipopeptide surfactants plotted as surface adsorbed amount expressed in μmol m−2versus time at the hydrophobic solid/water interface at the concentrations above CMC, pH 6 and 22–23 °C: C14K1(○, 1 mM), C14K2 (□, 1 mM), C14K3 (△, 3 mM), and C14K4 (◊, 4 mM). The continuous lines are drawn to guide the eyes. | ||
Fig. 4 shows Langmuir adsorption isotherms of lipopeptide surfactants C14K1–C14K4 on the hydrophobic C8 surface. At low concentrations, the adsorbed amount of C14Kn was as high as 0.4–0.8 mg m−2. At middle concentrations, the adsorbed amount rose quickly toward its plateau value. Lateral interactions among surfactants, including hydrophobic interaction of acyl chains and electrostatic repulsion of head groups led to a packed surfactant monolayer at the interface. For C14K1 and C14K2, the adsorbed amount increases linearly with the bulk concentration. The slope of the C14K1 isotherm is steeper than that of C14K2. It is suggested that the hydrophobic interaction between the C8 surface and acyl chains of surfactant dominates the adsorption process. However, for C14K3 and C14K4, the slopes and the adsorbed amounts over comparable bulk solution concentration range become smaller than those of C14K1 and C14K2. This result indicates that a different type of interaction among the head groups starts to overwhelm the hydrophobic interactions. At high concentrations equal to or above CMC, the adsorbed amounts from all lipopeptides reached their saturation levels and no further increase in adsorption occurred. Furthermore, Fig. 4a shows that the saturation adsorbed amounts of C14Kn at the C8/water interface decrease as the number of lysine residues increases. This follows the same trend as nonionic surfactants C12En (n = 5, 6, 8) (ref. 33) and confirms the importance of lateral molecular interactions for the adsorption of these surfactants at the hydrophobic surface.
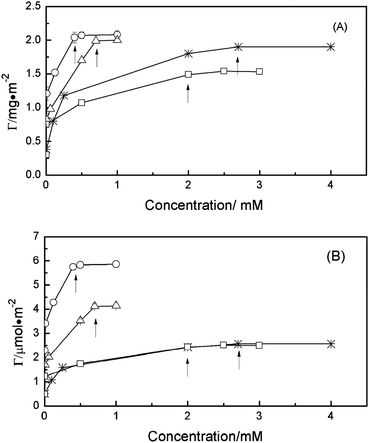 | ||
| Fig. 4 Adsorption isotherms for C14Kn at the hydrophobic C8/water interface, pH 6 and 22–23 °C: C14K1 (○), C14K2 (△), C14K3 (□), and C14K4 (*). The CMC of the different surfactants are indicated with arrows. The continuous lines are drawn to guide the eyes. The surface excess is expressed in mg m−2 (A) and in μmol m−2 (B). | ||
The plateau values of the adsorbed amount for C14Kn surfactants are also plotted versus the number of lysine residues in the head group (Fig. 5). When shown in mg m−2, the adsorbed amount of C14K4 is higher than that of C14K3, but as shown in the inset of Fig. 5 the values are almost the same in μmol m−2, suggesting that the same limiting surface area is occupied by a single C14K3 and C14K4, although the volume of C14K4 is 701.6 Å3 larger than that of C14K3 (525.9 Å3 due to an extra K residue). A reasonable explanation is that the conformation of K3 at the surface is not tightly packed with some room available for the fourth lysine. The adsorbed amounts from NR are also shown in Fig. 5 with those from SE for comparison. The two sets of data are in excellent agreement apart from a minor deviation for C14K2.
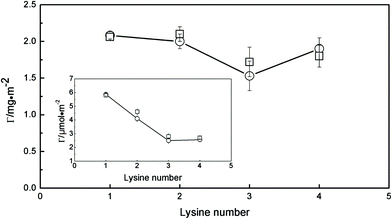 | ||
| Fig. 5 Interfacial adsorption of C14K1–4 measured by ellipsometry (○) and neutron reflection (□) plotted as surface adsorbed amount versus the number of the head group K at the hydrophobic C8/water interface above CMC, at pH 6 and 22–23 °C. The continuous lines are drawn to guide the eyes. The inset shows the corresponding surface excess expressed in μmol m−2. | ||
3.2 Layer structure from lipopeptide adsorption
Before starting the characterization of adsorbed surfactant layers, the thickness and mean composition of the hydrophobic C8 SAM layer was determined by NR in D2O. This reflectivity profile (shown in Fig. 6) was then used as a reference and any difference from it as a result of lipopeptide adsorption served as a useful indication of changes in amount and layer structure. A uniform single-layer model was used to fit the neutron reflectivity profile and the best fit is shown as a continuous line with a thickness of 10 ± 3 Å and a scattering length density 1.4 × 10⁻⁶ Å−2. The thickness is close to the a fully extended C8 (L = 11.6 Å), indicating that the hydrocarbon chain is nearly perpendicular to the surface. The volume fraction of the SAM derived from equation S5† is 73%, indicting the formation of a well packed hydrophobic C8 layer. This C8 structure was used for the subsequent NR study of surfactant adsorption.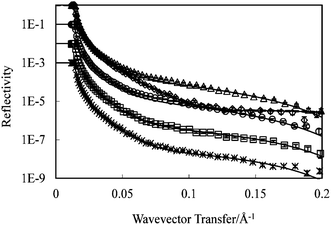 | ||
| Fig. 6 Uniform layer model fitting to the C14K1–4 lipopeptide layers adsorbed at the C8/D2O interface (◇): C14K1(△, 1 cmc), C14K2 (○, 1 cmc), C14K3 (□, 1.5 cmc) and C14K4 (*, 1.5 cmc). All the measurements were made at pH 6 and an ambient temperature of 22–23 °C. Symbols represent the measured data; continuous lines represent the best fit for one layer model. (Profiles of C8, C14K3 (□) and C14K4 (*) have been shifted down for 1 to 3 magnitudes for clarity). | ||
Fig. 6 also shows a set of neutron reflectivity profiles measured from different C14Kn adsorptions at the hydrophobic C8/D2O interface above their respective CMCs in D2O. Reflectivity profiles from different C14Kn deviate strongly from that of the C8/D2O profile, indicating that surfactants C14Kn adsorbed on the C8 surface resulted in different layer thicknesses and scattering length densities.
It can be seen from Fig. 6 that a single layer model can fit the four measured data from the C14Kn (all in the form of hC14hKn, h means the lipopeptide is hydrogenated), and the fitting parameters are summarized in Table S2.† The fitted thicknesses are 22 Å for C14K1, 21 Å for C14K2, 19 Å for C14K3 and 19 Å for C14K4, which are shorter than the extended length of these molecules (see Table S1†). This indicates that molecules within the layers are tilted more and more with respect to the surface as the number of lysine residues in the head group increases.
The interfacial assembly of the lipopeptide monolayers leads to the alignment of acyl tails to the C8 surface and the projection of peptide heads towards the aqueous solution. This unsymmetrical lipopeptide assembly discriminates water association across the interface; whilst water hydration is strongly favored with the lysine based head group region it can only penetrate the tail region via voids and defects, as the hydrophobic chains would disfavor any direct exposure to water. The unsymmetrical water association would lead to highly different values of scattering length density between tail and head regions, but the ability to fit into uniform layer distributions implies that under these conditions we are unable to comment on any further structural distributions. It is nevertheless worth mentioning that some of the structural parameters arising from the uniform layer modeling are not physically sound. For example, the fitted scattering length densities from C14K1 and C14K2 led to the converted lipopeptide volume fractions of 0.92 and 0.98, implying little structural defects for this kind of self-assembled monolayers and unusually low levels of water hydration.
For better determination of the adsorbed surfactant layer structures, partially deuterated surfactants such as acyl chain deuterated ones (dC14hKn, d means the acyl chain is deuterated) were deployed. For each lipopeptide, four isotopic contrasts were adopted including hC14hKn in D2O, dC14hKn in D2O, H2O and CMSi (contrast matched to Si, ρ = 2.07 × 10⁶ Å−2). These profiles provide the thickness of the adsorbed layer and the surface excess at different isotopic contrasts. The partial labeling of the lipopeptide surfactant also highlights the tail region in H2O and CMSi. Comparison of these data gives better structural sensitivity and improves the understanding of the layer structure, as shown below.
Unlike the case of hC14hKn in D2O as discussed above, fitting the profiles from dC14hKn in D2O with a single uniform layer model was not possible. A two-layer model as schematically shown in Fig. 7 has to be adopted because the deuterated acyl chains have a higher scattering length density than the hydrogenated head group region and the C8 layer. In this set of modeling involving clearly defined head and tail regions (sublayers), all the C14Kn adsorbed reflectivity profiles obtained from different isotopic contrasts resulted in the formation of a monolayer structure consisting of an inner hydrophobic region adjacent to the C8 surface and an outer head group region projecting into the bulk solution. In addition, the adsorbed layers of lipopeptide surfactants were not necessarily uniform because of different conformations of chains and heads and chains incorporating into defects on the SAM layer resulting in different degrees of head–chain intermixing and water association.
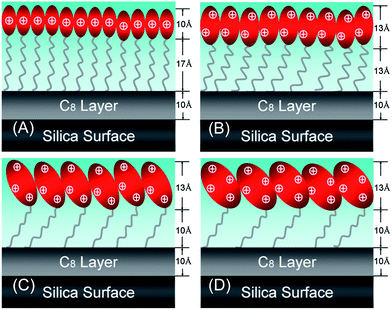 | ||
| Fig. 7 Schematic model to indicate the formation of the monolayer structure of C14K1–4 at the hydrophobic C8/water interface. The thicknesses marked for the chain and head group regions refer to the structure measured at the above CMC. | ||
The reflectivity profiles in Fig. 6 (involving all hC14hKn in D2O) and those in Fig. 8, and Fig. S2–S4† (involving other combinations of isotopic contrasts) were fitted using the two-layer model as described above, with the best fitted structural parameters summarized in Table 1 and also those fitted to the hC14hKn set (in D2O) shown in Table S3† and to other contrast combinations with different n in Tables S4–S7.† The continuous lines represent the best fits showing the excellent agreement to the measured neutron reflectivity profiles. In general, the results from hydrogenated and deuterated samples are in good agreement within experimental errors despite that slight lower values were found for hC14hK3. All other hC14hKn samples have slightly higher values than dC14hKn. The total thicknesses of the adsorbed monolayers on the hydrophobic C8/water interface were found to be 26 Å for C14K1, 25 Å for C14K2, 21 Å for C14K3 and 21 for Å C14K4, which were 2–4 Å higher than the respective values obtained from the uniform layer model fitting of the hydrogenated samples and which gave more physically meaningful volume fractions of lipopeptide surfactants and fractions of water association. The surface excesses from the different model fittings were however in good agreement with each other within experimental errors, indicating that the derived surface excess is independent of the fitting models, consistent with our previous observations.
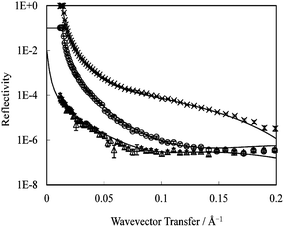 | ||
| Fig. 8 2-Layer model fitting to C14K1 monolayer adsorbed at the C8/water interface: hC14hK1 in D2O (×) dC14hK1 in D2O (○); and dC14hK1 in D2O–H2O mixture (ρ = 2.07 × 10⁻⁶ Å−2) (△). All the measurements were made at 1 cmc, pH 6 and at 22–23 °C. Symbols represent the measured data; continuous lines represent the best fits. | ||
| Sample (concentration) | Layer | τ ± 2 Å | ϕ p ± 0.05 | Γ ± 0.15 mg m−2 | Γ total ± 0.15 mg m−2 | A ± 2 Å2 |
|---|---|---|---|---|---|---|
| a The C8 layer was determined from pure D2O with τ = 11 ± 2 Å and ρ = 1.4 × 10⁻⁶ Å−2. All the lipopeptide measurements were made above CMC, pH 6 and at 22–23 °C. Symbols: τ, thickness of each layer; ϕp, chain and Lys head volume fractions derived from layer fitting; Γ, interfacial adsorbed amount calculated from respective layers; Γtotal, total adsorbed amount for each lipopeptide surfactant; A, area per molecule. | ||||||
| C14K1 (1 cmc) | C14 | 17 | 0.85 | 1.26 | 2.06 | 28.6 |
| K1 | 10 | 0.59 | 0.80 | |||
| C14K2 (1 cmc) | C14 | 13 | 0.91 | 1.03 | 2.23 | 36.1 |
| K2 | 13 | 0.71 | 1.20 | |||
| C14K3 (1.5 cmc) | C14 | 10 | 0.73 | 0.63 | 1.71 | 59.5 |
| K3 | 12 | 0.71 | 1.08 | |||
| C14K4 (1.5 cmc) | C14 | 9 | 0.71 | 0.55 | 1.91 | 64.5 |
| K4 | 14 | 0.77 | 1.36 | |||
The thicknesses of the acyl chain regions for C14K1, C14K2 and C14K3 were 17, 13 and 10 Å, respectively, decreasing with increasing head group size, but C14K4 has the same thickness of the chain layer as C14K3 10 Å. These values suggest that as the number of the head group lysines increases, the extent of the hydrocarbon chains tilts further away from the surface normal. The reasonable explanation is that the space occupied by every surfactant molecule becomes much larger when the number of K residues in the head group increases from 1 to 3, forcing the tails to project further away from the surface normal. The space of C14K4 is as large as that of C14K3 although C14K4 has one more K.
The head group region of C14K1 has a thickness of 10 Å and is shorter than that of C14K2 (13 Å). These two values are higher than the length of the backbone for K1 (3 Å) and K2 (6 Å), respectively, indicating that the side R group of lysine at the end partly contributes to the thickness of the head groups through different projection. Given the length of the R group is 8 Å, the fully extended lengths of the head group are 11 and 14 Å for K1 and K2, respectively—close to the fitted thicknesses, suggesting that the head groups within the adsorbed layers were nearly perpendicular to the surface. However, the thicknesses of the head group for C14K2, C14K3 and C14K4 remain almost unchanged at 13 Å. This observation must imply that the head groups heavily tilt away from the surface normal as the length of the peptide chain is further increased. The adoption of these head group conformations must however influence the area per molecule.
As expected, the areas per molecule are 28.6 ± 2 Å2 for C14K1, 36.1 ± 2 Å2 for C14K2, 59.5 ± 2 Å2 for C14K3 and 64.5 ± 2 Å2 for C14K4, following a clear trend of increasing with the size of the head group. This tendency is similar to nonionic surfactants C12Em with m = 1–8 adsorbed at the air/liquid interface. The values of the areas per molecule of C14K1, C14K2, C14K3 and C14K4 are in good agreement with 29 Å2 of C12E1, 34 Å2 of C12E2 and C12E3, 55 Å2 of C12E6 and 63 Å2 of C12E8, respectively.36–39 However, the areas per molecule of cationic surfactants, such as C12TAB,40 C14TAB41 and C16TAB42,43 are all about 44 Å2, larger than that of C14K1 and C14K2, but smaller than that of C14K3 and C14K4, again showing the impact of the different sizes of the head groups in the latter series.
The detailed structural changes within the lipopeptide surfactant monolayers show that for n = 1 and 2, hydrophobic interactions dominate, resulting in high density packing and ordered monolayers. As a result, the side chain amino acid residues within the head group region of C14K1 are forced into rather vertical projections, giving a head group thickness of 10 Å. In contrast, hydrophobic interactions are weakened in C14K2 by the substantially increased influence arising from the size doubling of the peptide head group, evident from the increase of the head group region thickness to 13 Å and the steady decline of the acyl chain region thickness from 17 to 13 Å. The reduced increase in the head group layer thickness is consistent with the increase in the area per molecule from some 29 to 36 Å2, showing that the head groups start to dominate the area per molecule. A further increase in n to 3 leads to further dominance of the head groups. By now, the head groups adopt the in-plane growth with their polypeptide backbone lying almost flat on the surface. This trend is consistent with the almost constant thickness of the head group region and the slight decline of the thickness of the acyl tail region due to the greater free space available. The behavior of C14K4 largely confirms the structural features as determined for C14K3 and as expected, the increase of n from 3 to 4 led to the mere increase of the area per molecule with little changes in the thicknesses for head and tail regions.
The adsorbed layer structures of natural lipopeptides, such as surfactin and bacillomycin D, at air/water, hydrophobic solid/water and oil/water interfaces have been studied by NR,7–10,44 infrared reflection absorption spectroscopy (IRRAS),45 and molecular dynamics simulation.46–49 As already indicated, surfactin forms a ball-like structure at air/water and hydrophobic solid/water interfaces with thicknesses of about 15 Å and molecular areas of about 145 Å2. The ball-like structure mainly originates from the interaction between the hydrocarbon and the hydrophobic amino acid residues such as leucine residues. Although the adsorption is pH sensitive and also affected by cation binding, the ball-like structure persists in all conditions in spite of the changes in area per molecule. The adsorption of surfactin at interfaces is mainly dominated by hydrophobic interactions although electrostatic interaction also plays a crucial role.7,10,44 Molecular dynamics simulation indicated the formation of intermolecular hydrogen bonds, β-turn structures and also β-sheet domains of the peptide rings when surfactin molecules were packed at the air/water interface.46,47 The adsorbed layer structures of surfactin and surfactin monomethyl ester at the oil (organic solvent)/water interface were also studied using molecular dynamics simulation. The results showed that the molecules stood vertically at the interface with acyl chains extending into the organic phase and the peptide rings tilted slightly at the interface.48,49 Unlike surfactins, the designed lipopeptides C14Kn adopted sandwich-like bilayers at the hydrophilic silica oxide/water interface and the process was driven by both electrostatic and hydrophobic interactions. Because there was no hydrophobic amino acid reside in the peptide chain, the hydrocarbon tails must be mixed back-to-back at the center of the bilayer, with one lysine head layer adsorbed on the silica surface through electrostatic interaction and the other lysine head layer pointed to the solution.30,31 In the present study, the adsorption on the hydrophobic C8/water interface was dominated by hydrophobic interactions. Thus, C14Kn formed monolayer structures with tails anchored on the hydrophobic C8 surface and the heads pointing to the bulk solution. Although the molecules tend to lie down with the number of lysine residues increasing, the main feature of monolayer adsorption still persists.
4 Conclusions
The adsorption of lipopeptide surfactants C14Kn at the hydrophobic C8/water interface is driven by the hydrophobic attraction between the acyl chain of the surfactant and the C8 surface. SE study revealed that the dynamic process is characterized by a fast initial step over the first 2–3 min in which the mass of adsorption substantially increases, followed by a slow step over the subsequent 15–20 min. The main structural feature is characterized by the anchoring of the hydrophobic acyl chain of the lipopeptide surfactant onto the hydrophobic surface, resulting in the formation of surfactant monolayer with the head groups pointing to the aqueous solution. This feature of lipopeptide monolayer is distinctly different from the bilayer formed at the hydrophilic silica/water interface as reported in our previous studies.30,31 Further NR studies in conjunction with deuterium labeling showed that the thicknesses of the hydrophilic head layers for C14K1, C14K2, C14K3 and C14K4 are 10, 13, 12 and 14 ± 2 Å, respectively, and the corresponding thicknesses for the hydrophobic layers are 17 Å, 13 Å 10 Å, and 10 ± 2 Å. These changes in regional thickness together with the steady increase in area per molecule suggest the steady increase in the extent of molecular tilting with n for the whole lipopeptides. The detailed NR structural analysis enabled us to ascertain that whilst the acyl chains tilt away from the surface normal, the head groups underwent far more substantial changes in their projection and conformational orientation with an increase in n due to the unique peptide backbone configuration.Acknowledgements
We thank the Engineering and Physical Sciences Research Council (EPSRC), Natural Science Foundation of China (20906105), Natural Science Foundation of Shandong Province, China (ZR2010EZ006), Natural Science Funds of Shandong Province of China for Distinguished Young Scholar (JQ201105) and China Scholarship Fund for financial support and the ISIS Neutron Facility at the Rutherford Appleton Laboratory for the provision of neutron beam time.References
- M. Strieker and M. A. Marahiel, ChemBioChem, 2009, 10, 607 CrossRef CAS PubMed.
- N. Roongsawang, K. Washio and M. Morikawa, Int. J. Mol. Sci., 2011, 12, 141 CrossRef CAS PubMed.
- M. Ongena and P. Jacques, Trends Microbiol., 2008, 16, 115 CrossRef CAS PubMed.
- L. Robbel and M. A. Marahiel, J. Biol. Chem., 2010, 285, 27501 CrossRef CAS PubMed.
- N. S. Shaligram and R. S. Singhal, Food Technol. Biotechnol., 2010, 48, 119 CAS.
- M.-S. Yeh, Y.-H. Wei and J.-S. Chang, Biotechnol. Prog., 2005, 21, 1329 CrossRef CAS PubMed.
- H.-H. Shen, R. K. Thomas, C.-Y. Chen, R. C. Darton, S. C. Baker and J. Penfold, Langmuir, 2009, 25, 4211 CrossRef CAS.
- H.-H. Shen, R. K. Thomas and P. Taylor, Langmuir, 2010, 26, 320 CrossRef CAS PubMed.
- H.-H. Shen, R. K. Thomas, J. Penfold and G. Fragneto, Langmuir, 2010, 26, 7334 CrossRef CAS PubMed.
- H.-H. Shen, T.-W. Lin, R. K. Thomas, D. J. F. Taylor and J. Penfold, J. Phys. Chem. B, 2011, 115, 4427 CrossRef CAS PubMed.
- A. Makovitzki, D. Avrahami and Y. Shai, Proc. Natl. Acad. Sci. U. S. A., 2006, 103, 15997 CrossRef CAS PubMed.
- A. Makovitzki, J. Baram and Y. Shai, Biochemistry, 2008, 47, 10630 CrossRef CAS PubMed.
- F. Tiberg and M. Landgren, Langmuir, 1993, 9, 927 CrossRef CAS.
- M. Landgren and B. Joensson, J. Phys. Chem., 1993, 97, 1656 CrossRef CAS.
- F. Tiberg, B. Joensson, J.-A. Tang and B. Lindman, Langmuir, 1994, 10, 2294 CrossRef CAS.
- J. Penfold and R. K. Thomas, J. Phys.: Condens. Matter, 1990, 2, 1369 CrossRef CAS.
- R. Maoz and J. Sagiv, Langmuir, 1987, 3, 1045 CrossRef CAS.
- L. Netzer, R. Iscovici and J. Sagiv, Thin Solid Films, 1983, 99, 235 CrossRef CAS.
- R. Maoz, J. Sagiv, D. Degenhardt, H. Möhwald and P. Quint, Supramol. Sci., 1995, 2, 9 CrossRef CAS.
- J. Gun and J. Sagiv, J. Colloid Interface Sci., 1986, 112, 457 CrossRef CAS.
- M. Pomerantz, A. Segmüller, L. Netzer and J. Sagiv, Thin Solid Films, 1985, 132, 153 CrossRef CAS.
- S. Margel, O. Sivan and Y. Dolitzky, Langmuir, 1991, 7, 2317 CrossRef CAS.
- J. L. Grange, J. Markham and C. Kurkjian, Langmuir, 1993, 9, 1749 CrossRef.
- A. G. Richter, M. K. Durbin, C. J. Yu and P. Dutta, Langmuir, 1998, 14, 5980 CrossRef CAS.
- R. Banga, J. Yarwood, A. M. Morgan, B. Evans and J. Kells, Langmuir, 1995, 11, 4393 CrossRef CAS.
- G. Fragneto, R. Thomas, A. Rennie and J. Penfold, Science, 1995, 267, 657 CrossRef CAS.
- G. Fragneto, J. R. Lu, D. C. McDermott, R. K. Thomas, A. R. Rennie, P. D. Gallagher and S. K. Satija, Langmuir, 1996, 12, 477 CrossRef CAS.
- G. Fragneto, Z. X. Li, R. K. Thomas, A. R. Rennie and J. Penfold, J. Colloid Interface Sci., 1996, 178, 531 CrossRef CAS.
- P. N. Thirtle, Z. X. Li, R. K. Thomas, A. R. Rennie, S. K. Satija and L. P. Sung, Langmuir, 1997, 13, 5451 CrossRef CAS.
- D. Jia, K. Tao, J. Wang, C. Wang, X. Zhao, M. Yaseen, H. Xu, G. Que, J. R. P. Webster and J. R. Lu, Soft Matter, 2011, 7, 1777 RSC.
- D. Jia, K. Tao, J. Wang, C. Wang, X. Zhao, M. Yaseen, H. Xu, G. Que, J. R. P. Webster and J. R. Lu, Langmuir, 2011, 27, 8798 CrossRef CAS PubMed.
- J. R. Lu, T. J. Su and B. J. Howlin, J. Phys. Chem. B, 1999, 103, 5903 CrossRef CAS.
- J. R. Lu, S. Perumal, I. Hopkinson, J. R. P. Webster, J. Penfold, W. Hwang and S. Zhang, J. Am. Chem. Soc., 2004, 126, 8940 CrossRef CAS PubMed.
- J. A. D. Feijter, J. Benjamins and F. A. Veer, Biopolymers, 1978, 17, 1759 CrossRef.
- F. Tiberg, J. Chem. Soc., Faraday Trans., 1996, 92, 531 RSC.
- J. R. Lu, M. Hromadova, R. K. Thomas and J. Penfold, Langmuir, 1993, 9, 2417 CrossRef CAS.
- J. R. Lu, E. M. Lee, R. K. Thomas, J. Penfold and S. L. Flitsch, Langmuir, 1993, 9, 1352 CrossRef CAS.
- J. R. Lu, Z. X. Li, T. J. Su, R. K. Thomas and J. Penfold, Langmuir, 1993, 9, 2408 CrossRef CAS.
- J. R. Lu, T. J. Su, Z. X. Li, R. K. Thomas, E. J. Staples, I. Tucker and J. Penfold, J. Phys. Chem. B, 1997, 101, 10332 CrossRef CAS.
- J. R. Lu, Z. X. Li, R. K. Thomas and J. Penfold, J. Chem. Soc., Faraday Trans., 1996, 92, 403 RSC.
- E. A. Simister, E. M. Lee, R. K. Thomas and J. Penfold, J. Phys. Chem., 1992, 96, 1373 CrossRef CAS.
- J. R. Lu, Z. X. Li, J. Smallwood, R. K. Thomas and J. Penfold, J. Phys. Chem., 1995, 99, 8233 CrossRef CAS.
- J. R. Lu, M. Hromadova, E. A. Simister, R. K. Thomas and J. Penfold, J. Phys. Chem., 1994, 98, 11519 CrossRef CAS.
- J. Penfold, R. K. Thomas and H.-H. Shen, Soft Matter, 2012, 8, 578 RSC.
- M. N. Nasir and F. Besson, J. Colloid Interface Sci., 2012, 387, 187 CrossRef CAS PubMed.
- H.-Z. Gang, J.-F. Liu and B.-Z. Mu, J. Phys. Chem. B, 2011, 115, 12770 CrossRef CAS PubMed.
- A.-Q. She, H.-Z. Gang and B.-Z. Mu, J. Phys. Chem. B, 2012, 116, 12735 CrossRef CAS PubMed.
- H.-Z. Gang, J.-F. Liu and B.-Z. Mu, J. Phys. Chem. B, 2010, 114, 2728 CrossRef CAS PubMed.
- H.-Z. Gang, J.-F. Liu and B.-Z. Mu, J. Phys. Chem. B, 2010, 114, 14947 CrossRef CAS PubMed.
Footnotes |
| † Electronic supplementary information (ESI) available. See DOI: 10.1039/c3sm51271a |
| ‡ JW and DJ made equal contributions. |
| This journal is © The Royal Society of Chemistry 2013 |
