 Open Access Article
Creative Commons Attribution 3.0 Unported Licence
Multiple nucleation events and local dynamics of poly(ε-caprolactone) (PCL) confined to nanoporous alumina†
Yasuhito Suzukia,
Hatice Duranb,
Wajiha Akramc,
Martin Steinhartc,
George Floudas*d and
Hans-Jürgen Butta
aMax-Planck Institute for Polymer Research, 55128 Mainz, Germany
bDept. of Materials Sci. & Nanotechnol. Eng., TOBB University of Economics and Technology, 06560 Ankara, Turkey
cInstitut für Chemie neuer Materialien, Universität Osnabrück, D-49069 Osnabrück, Germany
dDepartment of Physics, University of Ioannina, 451 10 Ioannina, Greece. E-mail: gfloudas@cc.uoi.gr
First published on 24th June 2013
Abstract
The crystallization and local dynamics of poly(ε-caprolactone) (PCL) confined to self-ordered nanoporous alumina (AAO) were studied as a function of pore size, pore surface functionality, molecular weight and cooling/heating rate by differential scanning calorimetry (DSC), wide-angle X-ray diffraction and dielectric spectroscopy. In contrast to the bulk, PCL located inside nanoporous alumina crystallizes via several distinct nucleation mechanisms. All mechanisms display pronounced rate dependence. At low undercoolings, the usual heterogeneous nucleation of bulk PCL was suppressed at the expense of two additional mechanisms attributed to heterogeneous nucleation initiated at the pore walls. At higher undercoolings a broad peak was observed in DSC which we attribute to crystallization initiated by homogeneous nucleation. At high cooling rates, the critical nucleus size is smaller than the smallest diameter of pores. Thus, PCL is able to crystallize within the smallest pores, despite the lower degree of crystallinity. Inevitably, homogeneous nucleation is strongly coupled to the local viscosity and hence to the local segmental dynamics. Dielectric spectroscopy revealed that confinement affected both the rate of segmental motion with a lowering of the glass temperature as well as a broader distribution of relaxation times.
1 Introduction
The way that polymers crystallize in confined space constitutes a fundamental problem in polymer physics with important technological applications.1–17 For example, controlling the degree of crystallinity by means of confinement can result in the rational design of materials with pre-determined mechanical and optical properties. Crystallization requires the presence of homogeneous or heterogeneous nuclei that act as seeds. Most homopolymers crystallize via heterogeneous nucleation. Heterogeneous nucleation is initiated by external surfaces (like dust or bubbles), by additives (such as remaining catalyst, solvent, other chemicals, polymer tacticity and chain polydispersity), external nucleating agents (like graphite, carbon black, titanium oxide) and rough container surfaces, interfaces and possibly interphases. Since these nuclei are already present at the beginning of nucleation, heterogeneous nucleation is athermal and either secondary or tertiary. All these factors can, in principle, catalyze the formation of heterogeneous nuclei and give rise to crystallization at low undercoolings. On the other hand, homogeneous nucleation involves the spontaneous clustering of several segments, the dissolution of small unstable nuclei and the formation and growth of larger stable nuclei above a critical size. In contrast to heterogeneous nucleation, homogeneous nucleation is primary (i.e., 3-dimensional) and thermal (or sporadic).AAO contains arrays of parallel, cylindrical nanopores with uniform geometrical features (pore length and diameter).18–22 Hence it can be employed as a model system for studying the effect of confinement on polymer crystallization. Recent studies of polymer crystallization within self-ordered nanoporous aluminum oxide (AAO) revealed different nucleation mechanisms that depend on the polymer. For example, in isotactic polypropylene16 a progressive transformation from heterogeneous to homogeneous nucleation was found, whereas in poly(ethylene oxide)17 crystallization was dominated by homogeneous nucleation with decreasing pore diameter.
In an effort to elucidate the different nucleation regimes, we employ poly(ε-caprolactone) (PCL) and investigate the effect of confinement on the self-assembly and local polymer dynamics. The investigation is carried out as a function of molecular weight, pore size, pore surface functionality and heating/cooling rate. Several nucleation mechanisms were identified as a function of the degree of undercooling. These mechanisms involve the known heterogeneous/homogeneous processes and, in addition, surface-induced nucleation. At higher undercoolings, where homogeneous nucleation prevails, the critical nucleus size was smaller than the smallest diameter of pores, thus PCL could crystallize even within the smallest pores despite with a lower degree of crystallinity. Since homogeneous nucleation is coupled to the local polymer viscosity at high undercoolings, we investigated, by means of dielectric spectroscopy, the local segmental dynamics associated with the (supercooled) liquid-to-glass temperature. We found that confinement affected both the rate of segmental motion as well as the distribution of relaxation times.
2 Experimental
a Samples and methods of infiltration
Poly(ε-caprolactone) (PCL) samples with different molecular weights (number-averaged molecular weights of 7700 and 36![[thin space (1/6-em)]](https://www.rsc.org/images/entities/char_2009.gif) 000 g mol−1) were purchased from Polymer Source Inc. and used as received. The molecular characteristics are shown in Table 1. AAO (pore diameters of 25, 35, 65, and 200 nm; pore depth 100 μm) was prepared following the procedures reported in the literature.18–20 Infiltration of PCL was performed by placing the polymer on the surface of self-ordered AAO at 373 K for 12 h. Prior to the DSC and DS experiments, excess PCL was removed from the surface of the self-ordered AAO membranes with sharp razor blades and soft polishing paper (Buehler Microcloth).
000 g mol−1) were purchased from Polymer Source Inc. and used as received. The molecular characteristics are shown in Table 1. AAO (pore diameters of 25, 35, 65, and 200 nm; pore depth 100 μm) was prepared following the procedures reported in the literature.18–20 Infiltration of PCL was performed by placing the polymer on the surface of self-ordered AAO at 373 K for 12 h. Prior to the DSC and DS experiments, excess PCL was removed from the surface of the self-ordered AAO membranes with sharp razor blades and soft polishing paper (Buehler Microcloth).
| Sample | Mw (g mol−1) | Mn (g mol−1) | Mw/Mn | T0m (K) |
|---|---|---|---|---|
| PCL-7700 | 8900 | 7700 | 1.16 | 348 |
PCL-36![[thin space (1/6-em)]](https://www.rsc.org/images/entities/char_2009.gif) 000 000 |
42![[thin space (1/6-em)]](https://www.rsc.org/images/entities/char_2009.gif) 800 800 |
36![[thin space (1/6-em)]](https://www.rsc.org/images/entities/char_2009.gif) 000 000 |
1.19 | 358 |
b Surface modification
Pore walls of AAO were activated in 35% aqueous H2O2 (Sigma-Aldrich) solution for 2 h at 45 °C, and dried at 120 °C for 15 minutes. Then, AAO were immersed into 4.2 mM solution of octadecylphosphonic acid (C18H39O3P; ODPA) (Alfa Aesar) in n-heptane–2-propanol (Sigma-Aldrich) (v/v/5![[thin space (1/6-em)]](https://www.rsc.org/images/entities/char_2009.gif) :
:![[thin space (1/6-em)]](https://www.rsc.org/images/entities/char_2009.gif) 1). Subsequently, the substrates were washed with copious amounts of n-heptane–2-propanol (v/v/5
1). Subsequently, the substrates were washed with copious amounts of n-heptane–2-propanol (v/v/5![[thin space (1/6-em)]](https://www.rsc.org/images/entities/char_2009.gif) :
:![[thin space (1/6-em)]](https://www.rsc.org/images/entities/char_2009.gif) 1) and sonicated to remove any physisorbed ODPA. ODPA-modified AAO was washed with ethanol several times and dried overnight under 200 mbar at room temperature.
1) and sonicated to remove any physisorbed ODPA. ODPA-modified AAO was washed with ethanol several times and dried overnight under 200 mbar at room temperature.
c Scanning electron microscopy (SEM)
Scanning electron microscopy (SEM) investigations using a LEO Gemini 1530 SEM, operated at acceleration voltages of 0.75 to 6 kV, revealed complete filling of pores. Fig. 1 shows SEM images of PCL-7700 infiltrated self-ordered AAO with different pore diameters. The figure depicts the surfaces of different AAO with diameters of 200, 65 and 35 nm as well as a cross-section of the 200 nm pores. In the latter, the pore bottoms are completely filled by PCL.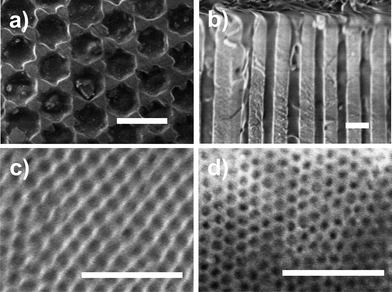 | ||
| Fig. 1 Scanning electron microscopy images of PCL-7700 infiltrated in self-ordered AAO. (a) Surface and (b) cross-section of AAO/PCL with a pore diameter of 200 nm, (c) surface of AAO/PCL with a pore diameter of 65 nm and (d) with a pore diameter of 25 nm. The white scale bars are 500 nm. | ||
d Polarizing optical microscopy (POM)
The real-time crystallization and melting of bulk PCL was followed by polarizing optical microscopy using an Axioskope 40 FL optical microscope. A thin film of the sample (with a spacing of ∼50 μm maintained by Teflon spacers) was placed between glass slides and introduced into a Linkam THMS 600 hotplate. The crystallization kinetics were investigated by first heating the sample to the melt (363 K), followed by fast cooling (∼50 K min−1) to different final temperatures where the system was crystallized isothermally. The analysis of the crystallization kinetics at different crystallization temperatures provided spherulitic growth rates.23,24 Subsequent slow heating (1 K min−1) provided the apparent melting temperatures. The equilibrium melting temperatures were estimated from the procedure described in the literature23,24 and are included in Table 1.e Wide-angle X-ray scattering (WAXS)
The Θ/2Θ scans were taken with a D8 Advance X-ray diffractometer (Bruker). The X-ray tube (KRISTALLOFLEX 780) generator with a Cu anode was operated at a voltage of 40 kV and a current of 30 mA. An aperture (divergence) slit of 0.3 mm, a scattered-radiation (antiscatter) variable slit (V20) together with a monochromator slit of 0.1 mm and a detector slit of 1 mm were employed. A diffracted beam monochromator was inserted between the detector slit and the detector to suppress fluorescence radiation and the unwanted Kβ radiation. The monochromator employed a graphite crystal (2d* = 0.6714 nm, for the 002 reflection). The Kα1 and Kα2 peaks could not be separated and an average wavelength of 0.154184 nm was used. A scintillation counter with a 95% quantum yield for Cu radiation was employed as the detector. Scans in the 2Θ-range from 1 to 40° in steps of 0.01° were obtained following two protocols: (i) at 298 K following slow cooling (∼3 K min−1) from the melt (363 K) and 1 day annealing at ambient temperature and (ii) at 243 K following fast cooling (50 K min−1) from the melt (363 K). The WAXS results are shown in Fig. 2. As we will see below, these procedures emphasize different nucleation regimes. During the Θ–2Θ scans of the PCL infiltrated into AAO, the AAO pore axes were oriented parallel and the AAO surface was oriented perpendicular to the plane of the incident and scattered X-ray beams. In this geometry, only crystals that meet the Bragg condition and that have the corresponding set of lattice planes oriented parallel to the AAO surface can contribute to the scattered intensity. Schulz scans were measured with an X-ray diffractometer PANalytical X'Pert Pro MRD using Cu Kα radiation. The samples were mounted on a Eulerian cradle. The incident beam passed a nickel filter, a polycapillary (length 70 mm) and a cross-slit collimator (slit width and height 500 μm), the diffracted beam, and a parallel plate collimator. The scattered intensity was detected with a PW3011/20 proportional point detector.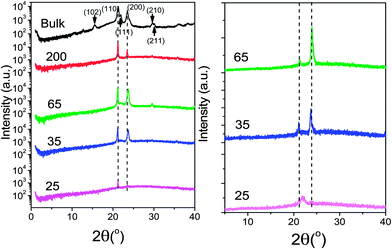 | ||
| Fig. 2 Θ/2Θ X-ray scans for bulk PCL-7700 and for PCL-7700 located inside AAO with pore diameters ranging from 200 to 25 nm. (Left) Measurements are conducted at 298 K following slow cooling from the melt (363 K) and 1 day annealing. (Right) Measurements are conducted at 243 K following fast cooling from 363 K. In both cases, the template surface was oriented perpendicularly to the plane of the incident and scattered X-ray beams. The main diffraction peaks of bulk and confined PCL are indicated with vertical lines. | ||
f Differential scanning calorimetry (DSC)
Thermal analysis was carried out using a Mettler Toledo differential scanning calorimeter (DSC-822). DSC traces of neat PCL were acquired using an empty pan as a reference. The PCL mass in PCL-infiltrated AAO was estimated from the mass difference between PCL-infiltrated AAO and empty AAO. Samples were weighed with a Mettler Toledo AX205 balance. Prior to DSC measurements, the Al substrates, to which the AAO membranes had been connected, were etched away by using a mixture of HCl, CuCl2, and H2O and the samples were further milled to powder. Subsequently, 1.2–3.7 mg of sample material was sealed in aluminum pans (100 μl). DSC traces of PCL-infiltrated AAO were recorded using reference pans containing empty AAO pieces of the same pore diameter. All samples were first cooled at a rate of 10 K min−1 from ambient temperature to 173 K and then heated to 393 K at the same rate under a nitrogen atmosphere. The same cycle was repeated two times. Melting and crystallization points, as well as heats of fusion and crystallization were determined from the second heating and cooling thermographs, respectively. The crystallinity of PCL located inside the pores was evaluated from the heat of fusion (ΔHm) as Xc(%) = (ΔHm/ΔH0m) × 100, where ΔH0m (= 148 J g−1) is the heat of fusion of the perfect crystal.25–27 In a second experiment, the rate dependence of the melting and crystallization temperatures was investigated for PCL-infiltrated AAO with pore diameters of 65 nm and 200 nm. In this experiment, samples were heated to 373 K and DSC cooling/heating curves were obtained with rates of 10, 5, 2 and 1 K min−1. In a third experiment, we followed the crystallization kinetics (due to heterogeneous nucleation) of bulk and confined PCL. In these isothermal crystallization experiments samples were first heated to 393 K and held there for 10 min in order to erase the thermal history, followed by rapid cooling (50 K min−1) to different final crystallization temperatures where they could crystallize. At the end of the crystallization process, samples were heated to 393 K with a rate of 1 K min−1 to obtain the corresponding apparent melting temperatures. From the isothermal crystallization experiments the crystalline mass fraction, W(t), was estimated as
 | (1) |
g Dielectric spectroscopy (DS)
Dielectric measurements were performed at temperatures in the range of 183–348 K, at atmospheric pressure, and for frequencies in the range from 10−2 to 106 Hz using a Novocontrol Alpha frequency analyzer as a function of temperature. For bulk PCLs, the DS measurements were carried out in the usual parallel plate geometry with electrodes of 20 mm in diameter and sample thickness of 50 μm maintained by Teflon spacers. For PCL infiltrated self-ordered AAO samples, a 10 mm electrode was placed on top of the templates whereas the Al at the bottom of the templates served as the second electrode. The measured dielectric spectra were corrected for the geometry by using two capacitors in parallel (composed of ε*PCL and ε*AAO and the measured total impedance was related to the individual values through 1/Z* = 1/Z*PBLG + 1/Z*AAO). This allows the calculation of the real and imaginary parts of the dielectric permittivity as a function of the respective volume fractions.22 The latter were obtained by digitization of the SEM images. In all cases, the complex dielectric permittivity ε* = ε′ − iε′′, where ε′ is the real and ε′′ is the imaginary part, was obtained as a function of frequency ω and temperature T, i.e., ε*(T, ω).29,30 The analysis was made using the empirical equation of Havriliak and Negami31 (actually a summation of two HN functions was employed for the “faster” and “slower” processes):
 | (2) |
 | (3) |
3 Results and discussion
a Phase state
POM images revealed a final spherulitic superstructure under isothermal conditions with a mean spherulite size before impingement of about 50 μm and 20 μm, for PCL-7700 (at 323 K) and PCL-36![[thin space (1/6-em)]](https://www.rsc.org/images/entities/char_2009.gif) 000 (at 324 K), respectively (Table 2). The corresponding equilibrium melting temperatures24 are included in Table 1. More detailed information on the crystalline polymorph that had formed was obtained by WAXS. For bulk PCL-7700 (Fig. 2) (measured at 298 K following slow cooling (∼3 K min−1) from the melt (363 K) and 1 day annealing at 298 K) intense peaks appear at 2Θ angles of 15.5°, 21.3°, 21.9°, 23.6°, 29.7°, 30.1° and 36.1°. These correspond to the (102), (110), (111), (200), (210), (211) and (020) reflections from the orthorhombic unit cell with interplanar spacings dhkl of the (hkl) lattice planes given by
000 (at 324 K), respectively (Table 2). The corresponding equilibrium melting temperatures24 are included in Table 1. More detailed information on the crystalline polymorph that had formed was obtained by WAXS. For bulk PCL-7700 (Fig. 2) (measured at 298 K following slow cooling (∼3 K min−1) from the melt (363 K) and 1 day annealing at 298 K) intense peaks appear at 2Θ angles of 15.5°, 21.3°, 21.9°, 23.6°, 29.7°, 30.1° and 36.1°. These correspond to the (102), (110), (111), (200), (210), (211) and (020) reflections from the orthorhombic unit cell with interplanar spacings dhkl of the (hkl) lattice planes given by
 | (4) |
The unit cell parameters are a = 0.749 nm, b = 0.497 nm and c = 1.729 nm. This unit cell has been discussed as comprising an extended planar chain conformation of the molecule involving two monomer residues related by a two-fold screw axis in the chain direction.32 Furthermore, the space group (P212121) and density (1.146 g cm−3) indicated that the unit cell comprises two chains with opposite orientation, i.e., up and down. Interestingly, an earlier electron diffraction study of solution-grown PCL crystals indicated that the fastest crystal growth occurs normal to the {110} and {200} faces.32 Similarly, a real-time crystallization of PCL from the melt by atomic force microscopy also suggested a mechanism involving {110} growth faces.33 Therefore, in bulk PCL, crystallization proceeds along directions normal to the {110} and {100} faces.
Subsequently, the PCL crystal orientation inside self-ordered AAO was studied either by slow cooling from the melt (3 K min−1) following annealing at 298 K, or by fast cooling to 243 K (at −50 K min−1). As we will see below (with respect to Fig. 3), this thermal treatment emphasizes different nucleation mechanisms (homogeneous vs. heterogeneous). For PCL-7700 inside self-ordered AAO following the former treatment most of the bulk reflections are suppressed with the exception of the (110) and (200) reflections. This suggests preferred orientation of the {110} and {200} faces normal to the AAO pore axes. To further investigate the crystal orientation of PCL in AAO, we measured Schulz scans34 as described previously.35 Schulz scans were measured with fixed Θ and 2Θ angles by tilting the AAO about the Ψ axis by a tilt angle Ψ (Fig. S1, ESI†). The Ψ axis lies in the scattering plane (normal to the AAO pore axes) and was oriented perpendicular to the Θ/2Θ axis. The Schulz scans yielded intensity profiles I(Ψ) representing orientation distributions of sets of lattice planes belonging to the reflection at the selected 2Θ angles relative to the AAO surface. Hence, the obtained I(Ψ) profiles corresponded to azimuthal intensity profiles along the Debye ring belonging to the fixed scattering angle Θ. The Schulz scan for the (110) peak of PCL-7700 inside AAO with a pore diameter of 65 nm crystallized at a cooling rate of −3 K min−1 indicated pronounced alignment of the {110} crystal faces with the AAO surface (corresponding to the preferred orientation of the {110} faces perpendicular to the AAO pore axes). The Hermans orientation parameter36 amounted to ≈0.95, suggesting a nearly uniform orientation.
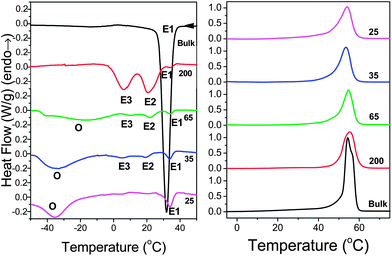 | ||
| Fig. 3 Cooling (left) and subsequent heating (right) thermograms of bulk PCL-7700 and PCL-7700 located inside self-ordered AAO with pore diameters ranging from 200 nm to 25 nm (heating/cooling rate 10 K min−1). The letters E and O denote crystallization peaks originating from heterogeneous and homogeneous nucleation, respectively. | ||
On the other hand, following the latter treatment (fast cooling to 243 K) gives rise to crystal growth along the same directions. However, in the case of 65 nm or 35 nm pores, preferentially the {100} faces appear to be oriented normal to the AAO pore axes (Fig. 2). We mention here that a variety of PCL crystal orientations were found in PCL spatially confined to PCL-b-polystyrene (PS) nanocylinders.7
DSC traces on cooling and subsequent heating were shown to contain important information on the type of nucleation processes. Fig. 3 shows the DSC traces of bulk PCL-7700 and of PCL-7700 located inside self-ordered AAO obtained with a cooling rate of 10 K min−1. Bulk PCL-7700 shows a strong exothermic peak at 32 °C. All traces of PCL-7700 located inside AAO contain a shallow peak at about 34 °C. Depending on the pore size, traces exhibit significant differences. PCL-7700 located inside AAO with a pore diameter of 200 nm exhibits two exothermic peaks at 21 °C and 6 °C. On the other hand, PCL in pores with a diameter of 25 nm exhibits a broad exothermic peak at −35 °C. PCL in 35 nm pores exhibits a similar exothermic peak at −34 °C but has some additional – albeit weak – exothermic processes at 20 °C and 6 °C. PCL in 65 nm pores contains some intermediate features. The DSC traces of PCL-36![[thin space (1/6-em)]](https://www.rsc.org/images/entities/char_2009.gif) 000 inside the same templates revealed similar features and are provided in the ESI (Fig. S2†).
000 inside the same templates revealed similar features and are provided in the ESI (Fig. S2†).
We attribute the multiple peaks of PCL-7700 located inside AAO with a pore diameter of 200 nm at 34 °C, 21 °C and 6 °C to heterogeneous nucleation and indicate them as E1, E2 and E3, respectively. Heterogeneous crystallization is the sole mechanism for PCL located inside self-ordered AAO with 200 nm pores but is a minor crystallization mechanism in the smaller pores (Fig. 3). Heterogeneous nucleation in the large pores can be explained as follows. The spherulite diameter of bulk PCL upon impingement (20–50 μm) allows estimation of the volume per heterogeneous nucleus that is in the range from 10−6 to 10−5 mm3 (Table 2). However, within AAO, PCL is confined to small cylindrical pores with volumes in the range from 3 × 10⁻⁹ mm3 to 5 × 10⁻¹¹ mm3 for pores with diameters of 200 and 25 nm, respectively. Since these pore volumes are 3 to 5 orders of magnitude smaller than the volume per heterogeneous nucleus in bulk PCL, only a small fraction of pores will contain heterogeneous nuclei. This small fraction of nuclei gives rise to the crystallization peak indicated as E1 in the DSC traces. The remaining nucleation peaks, E2 and E3, cannot originate from the same heterogeneous nuclei. Their origin will be discussed below with respect to Fig. 7.
For PCL located inside AAO with pore diameters below 65 nm, the main peaks appear at lower temperatures, i.e., at higher undercooling. We attribute these peaks at −35 °C to homogeneous nucleation. As we discussed, the presence of heterogeneous nuclei within the smaller pores is completely unlikely and PCL in these nano-cylinders can only nucleate by crossing the intrinsic barrier for homogeneous nucleation. The critical nucleus size for homogeneous nucleation, l*, is given by37 l* = 4σeT0m/ΔTΔHmρc, where σe (106 mJ m−2)25–27 is the fold surface free energy, T0m = 348 K the equilibrium melting temperature, ΔT0m = 148 J g−1 the latent heat of fusion25–27 at the equilibrium melting temperature, ΔT = T0m – Tc the undercooling and ρc = 1.187 g cm−3 the crystal density. ΔT is 43 K in bulk PCL-7700 but it increases to 110 K for PCL inside self-ordered AAO with pore sizes of 35 nm and 25 nm. At such undercoolings in the smaller pores, the critical nucleus size for homogeneous PCL nucleation is about 8 nm and is, therefore, smaller than the diameter of the smallest pores. Thus, PCL is able to crystallize even within 25 nm pores.
According to classical nucleation theory,37,38 the nucleation rate at such high undercoolings is influenced by the viscosity term that has a significant contribution in the vicinity of the glass temperature, Tg. Hence, homogeneous nucleation may be coupled to the presence of long-lived spatio-temporal heterogeneities37 associated with the liquid-to-glass “transition”. Such heterogeneities can affect the transport properties of molecules via the decoupling of rotational motion from translational motion and can influence the growth from homogeneous nuclei under high undercoolings. This point requires separate probing of the heterogeneous dynamics in undercooled semicrystalline polymers confined to nanopores before the onset of crystallization. Systems of interest include PCL and PEO located inside nano-channels with diameters below 65 nm where the role of dynamic heterogeneities in the homogeneous nucleation process can be explored.
On heating (Fig. 3) bulk PCL melts at ∼328 K as compared to the equilibrium melting temperature (at 348 K). Such a reduction suggests finite size effects as described by the Gibbs–Thomson equation:
 | (5) |
The heats of fusion, ΔHm, and corresponding degrees of crystallinity, Xc, are plotted in Fig. 4 as a function of inverse pore diameter. The overall degree of crystallinity is reduced upon confinement to about half the bulk value (from 80% to 35%). This is independent of the fact that within the larger (smaller) pores crystallization is initiated via heterogeneous (homogeneous) nucleation. This reflects the lateral restriction on the crystal growth by the pore walls that can lead to structural defects. The corresponding apparent melting and crystallization temperatures for the same PCL inside AAO are plotted in Fig. 5. The figure displays the single – albeit broad – melting temperature and the multiple nucleation processes (heterogeneous E1, E2, E3, and homogeneous O) obtained on cooling with a rate of 10 K min−1.
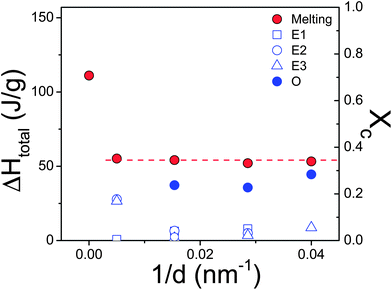 | ||
| Fig. 4 (Left axis) Heat of fusion of PCL-7700 plotted as a function of inverse pore diameter obtained on cooling (blue symbols) and subsequent heating (red circles). (Right axis) Degree of crystallinity as a function of inverse pore diameter (based on ΔH∞ = 148 J g−1). | ||
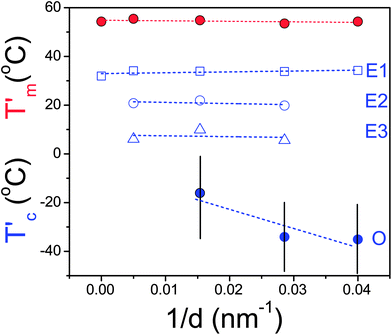 | ||
| Fig. 5 Apparent melting (red symbols) and crystallization (blue symbols) temperatures of PCL-7700 inside self-ordered AAO as a function of inverse pore diameter (obtained at a heating/cooling rate of 10 K min−1). The dashed lines represent linear fits. The vertical lines are not error bars but show the temperature range for the homogeneous nucleation process. | ||
The cooling rate dependence of the transition temperatures is indicated in Fig. 6 for PCL-7700 inside AAO with two pore sizes and displays some unanticipated features. In general, reducing the scan speed results in higher crystallization temperatures both for heterogeneous and homogeneous nucleation in agreement with an earlier study on PEO/AAO.17 Within the 200 nm pores nucleation events are solely heterogeneous and the crystallization temperatures display strong rate dependence. In addition, under the quasi-static conditions corresponding to the lower rates (1 and 2 K min−1) there is a splitting of the peaks suggesting a complex heterogeneous nucleation scenario. On the other hand, within the 35 nm pores, nucleation is predominantly (but not solely) homogeneous. In addition to the minor heterogeneous nucleation processes at low undercoolings (processes E1, E2 and E3) the homogeneous nucleation process becomes very asymmetric and can be decomposed into at least two distinct processes (both indicated as O). The meaning of the dual processes associated with homogeneous nucleation is unclear at present.
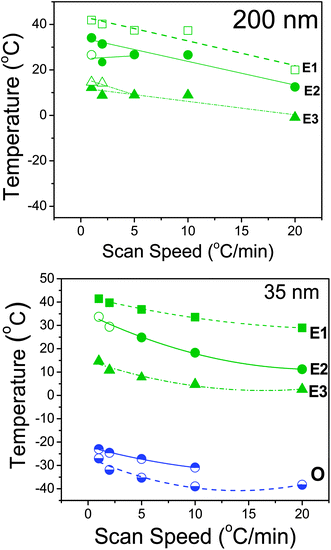 | ||
| Fig. 6 Transition temperatures for PCL-7700 located inside self-ordered AAO with pore diameters of 200 nm (top) and 35 nm (bottom) obtained on cooling with different rates (in °C min−1) as indicated. The letters E and O stand for crystallization initiated by heterogeneous and homogeneous nuclei, respectively. Lines are guides to the eye. | ||
More insight into the origin of the different nucleation processes can be obtained by the surface modification of pore walls with ODPA. The DSC traces for PCL-7700 inside surface-treated AAO are shown in Fig. S3, ESI,† and the results for the apparent melting and crystallization temperatures are summarized in Fig. 7. The main effect of surface modification is the suppression of the E2 and E3 heterogeneous nucleation mechanisms. This suggests that the latter two mechanisms are induced by the AAO surface. On the other hand, a new nucleation process appears at temperatures between E1 and O. This intermediate process could reflect nucleation initiated by the grafted ODPA alkyl chains, but its characterization requires further investigation.
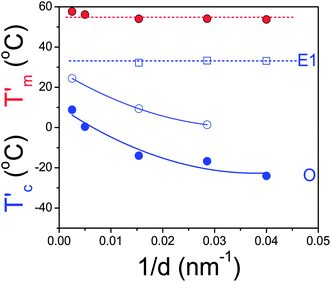 | ||
| Fig. 7 Apparent melting (red symbols) and crystallization (blue symbols) temperatures of PCL-7700 inside surface-treated (with ODPA) self-ordered AAO as a function of inverse pore diameter (obtained at a heating/cooling rate of 10 K min−1). | ||
b Local dynamics
The PCL repeat unit [–(CH2)5COO–] has a dipole moment originating from the ester group (total ester dipole moment 1.72 D as obtained from dilute solutions in dioxane) with components parallel (∼0.64 D) and perpendicular (∼1.6 D) to the backbone, the total ester dipole moment 1.72 D as obtained from dilute solutions in dioxane.39 Thus DS is capable, in principle, of following the local and global chain dynamics by recording dielectric spectra as a function of frequency at different temperatures. Nevertheless, a strong contribution from ionic conductivity and the presence of crystalline/amorphous domains and the associated Maxwell–Wagner–Sillars polarization precludes the investigation of the slower chain dynamics in the bulk state.28 We are thus focusing our attention on the local dynamics below and above the glass temperature (Tg).Typical dielectric loss curves of bulk PCL-7700 are depicted in Fig. 8 at two temperatures corresponding to the segmental (α-process) and local (β-process). The α- and β-processes were fitted according to the HN function (eqn (2)) with respective shape parameters m = 0.22 n = 0.20 and m = 0.43, n = 0.30. The two processes have distinctly different T-dependencies. The α-process conforms to the Vogel–Fulcher–Tammann (VFT) equation:
 | (6) |
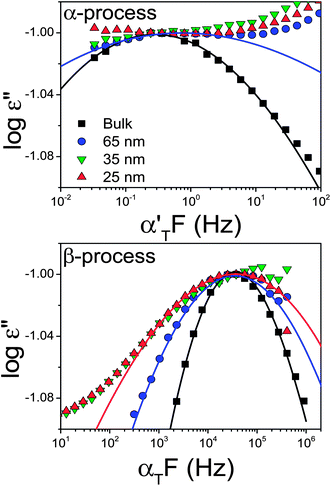 | ||
| Fig. 8 Normalized dielectric loss curves for the α- (top) and β-processes (bottom) for bulk PCL-7700 and PCL-7700 located inside self-ordered AAO with pore diameters ranging from 65 to 25 nm obtained at T = 228 K and T = 183 K, respectively. Spectra have been slightly shifted horizontally with shift factors αT and α′T, respectively to better indicate the broadening of the curves. | ||
The effect of confinement on the dielectric loss spectra of PCL-7700 is also depicted in Fig. 8. Confinement of PCL-7700 within self-ordered AAO has two effects: a broadening of the dynamic processes and a shift of the respective peaks to higher frequencies (faster dynamics). The latter is shown in Fig. 9 where the relaxation times are plotted in the usual Arrhenius representation. The broadening of the processes and the limited frequency range available for the α-process within the smaller pores require the use of a fixed τo = 10−12 s as with the bulk PCL-7700. The estimated glass temperature is then reduced from 206 K in bulk PCL to 201 K within 65 and 35 nm to 190 K within 25 nm pores. Such reductions in the glass temperature are not uncommon in confined systems.2,41
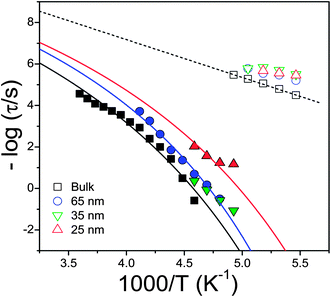 | ||
| Fig. 9 Relaxation times at maximum loss corresponding to bulk PCL-7700 and to PCL-7700 located inside self-ordered AAO with pore diameters ranging from 65 to 25 nm. The α- and β-processes are shown by filled and empty symbols, respectively. Solid and dashed lines are fits to the VFT (α) and Arrhenius processes (β), respectively (the latter is shown only for bulk PCL). For the α-process a fixed τo (= 10−12 s) value was used. | ||
The most dramatic effect of confinement is the broad distribution of relaxation times within the smaller pores. The latter reflects enhanced spatial and possibly temporal heterogeneity as probed by the PCL dipoles with the rates of α- and β-processes.40 This can be understood if we consider that both processes are probing dipoles located in the amorphous PCL segments that are spatially confined by the spherical-like PCL nano-crystals and the pore walls. This confinement creates a heterogeneous spatially varying environment as seen by the ester dipoles. In addition, possible adsorption of chains near the walls can give rise to density modulations with regions of lower and higher density that can enhance the existing heterogeneities. It is surprising that confinement effects exist also for the faster and hence more local β-process. This process shifts to lower temperatures (becomes faster) and the activation energy is reduced from a bulk value of 35 kJ mol−1 to about 25 kJ mol−1 for PCL within the 65 nm pores.
c Crystallization kinetics
The strong heterogeneous nucleation in bulk PCL and in PCL inside AAO templates with a pore size of 200 nm allows an investigation of the crystallization kinetics at rather low undercoolings. Measurements were made under isothermal conditions, following fast cooling from the melt. The DSC traces for bulk PCL-7700 and for PCL-7700 located inside AAO with 200 nm pores are depicted in Fig. 10. The analysis of the traces is based on the Avrami equation42 for the volume fraction of the newly formed phase:| Vc(t) = 1 − exp(−ktn) | (7) |
 | (8) |
![[thin space (1/6-em)]](https://www.rsc.org/images/entities/char_2009.gif) 2/k)1/n and is plotted in Fig. 11. As expected from the low undercooling, the lower the crystallization temperature the faster the kinetics of crystal growth. Confinement slows down the crystallization times and results in a lower Avrami exponent relative to the bulk (from a bulk value in the range n = 3.5–5 to n ∼ 3 under confinement). Such values are in accordance with the heterogeneous nucleation probed at low undercoolings and distinctly different from the first-order kinetics observed in PCL-b-PS7 and PCL-b-poly(4-vinylpyridene)6 copolymers at higher undercoolings associated with homogeneous nucleation.
2/k)1/n and is plotted in Fig. 11. As expected from the low undercooling, the lower the crystallization temperature the faster the kinetics of crystal growth. Confinement slows down the crystallization times and results in a lower Avrami exponent relative to the bulk (from a bulk value in the range n = 3.5–5 to n ∼ 3 under confinement). Such values are in accordance with the heterogeneous nucleation probed at low undercoolings and distinctly different from the first-order kinetics observed in PCL-b-PS7 and PCL-b-poly(4-vinylpyridene)6 copolymers at higher undercoolings associated with homogeneous nucleation.
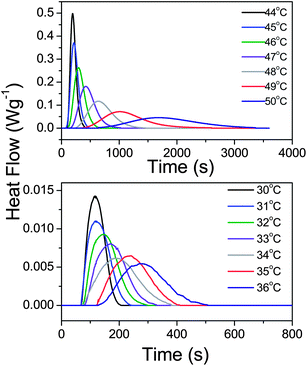 | ||
| Fig. 10 Heat flow during the isothermal crystallization of bulk PCL-7700 (top) and PCL-7700 located inside self-ordered AAO templates with a pore diameter of 200 nm (bottom) at different crystallization temperatures indicated. | ||
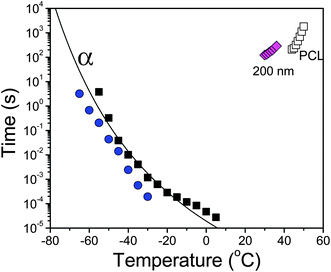 | ||
| Fig. 11 Characteristic crystallization times, t1/2 (open symbols), obtained from the kinetics for bulk PCL-7700 (open squares) and for PCL-7700 located inside self-ordered AAO templates with a size of 200 nm (open rhombi). These kinetic times are compared with the α-process relaxation times of bulk PCL (filled squares) and of PCL inside self-ordered templates with a size of 65 nm (spheres). The line shows the VFT process for bulk PCL. | ||
In the same figure we include the characteristic times of the segmental α-process for bulk PCL-7700 and for PCL within templates with 65 nm pore size. Within this temperature range (i.e. for temperatures in the vicinity of the glass temperature), the kinetics are expected to be dominated by segmental or chain transport (i.e. diffusion-controlled) and hence become slower by decreasing temperature. A recent study with fast differential scanning calorimetry indicated that an even faster time scale and a more local viscosity might be appropriate within the homogeneous nucleation regime.43 Nevertheless, the low heats of fusion and much higher undercooling preclude an investigation of the kinetics due to homogeneous nucleation with our experimental set-up.
4 Conclusion
Like most semicrystalline polymers, bulk PCL crystallizes via heterogeneous nucleation. PCL located inside nanoporous alumina crystallizes via several distinct nucleation mechanisms. At low undercoolings, heterogeneous nucleation is one such mechanism. However, since the volume per heterogeneous nucleus is several orders of magnitude larger than the volume of the AAO pores, the usual bulk heterogeneous nucleation mechanism is largely suppressed and can be considered to be only a minor feature. In addition, the kinetics of heterogeneous nucleation under confinement indicated a slowing-down of the characteristic times relative to the bulk and a lower Avrami exponent. Two additional crystallization mechanisms were found at low undercoolings that are attributed to heterogeneous nuclei but of a different kind. Surface functionalization revealed that these mechanisms are associated with heterogeneous nucleation initiated from the pore walls.At higher undercoolings a broad crystallization mechanism was found that is initiated via homogeneous nucleation. At such undercoolings, the critical nucleus size is smaller than the smallest pore diameter, thus PCL is able to crystallize even within the smallest pores but with a lower degree of crystallinity. In addition, crystallization proceeds normal to the {110} and {200} faces whereas in smaller AAO pores the {100} faces are preferentially oriented normal to the pore axes with a high degree of orientational order.
Inevitably, homogeneous nucleation is strongly coupled to the local viscosity at high undercoolings and possibly to the local segmental dynamics associated with the (supercooled) liquid-to-glass temperature. Confinement affects both the rate of segmental motion (with a lowering of the glass temperature) as well as the distribution of relaxation times (broader distribution). Further experiments on different polymers with slow crystallization kinetics are necessary as they can bring about the larger picture of how, why and when polymers crystallize under confinement.
Acknowledgements
G. F. acknowledges support during his sabbatical leave at the MPI-P. The current work was supported by the Research unit on Dynamics and Thermodynamics of the UoI co-financed by the European Union and the Greek state under NSRF 2007–2013 (Region of Epirus, call 18) and the operational program of the NSRF “Aristeia”. H. D. and M. S. gratefully acknowledge financial support from the German Research Foundation (SPP 1369, BU 1556/31-1, STE 1127/13 and INST 190/134-1). Sample preparation by C. Hess and H. Tobergte as well as SEM investigations by G. Glasser are gratefully acknowledged. W. A. thanks the German Academic Exchange Service for a scholarship.References and notes
- K. Binder, J. Horbach, R. Vink and A. de Virgiliis, Soft Matter, 2008, 4, 1555–1568 RSC.
- M. Alcoutlabi and C. B. McKenna, J. Phys.: Condens. Matter, 2005, 17, R461–R524 CrossRef CAS.
- Y.-L. Loo, R. A. Register and A. J. Ryan, Phys. Rev. Lett., 2000, 84, 4120–4123 CrossRef CAS.
- H.-L. Chen, S.-C. Hsiao, T.-L. Lin, K. Yamauchi, H. Hasegawa and T. Hashimoto, Macromolecules, 2001, 34, 671–674 CrossRef CAS.
- G. Reiter, G. Castelein, J.-U. Sommer, A. Röttele and T. Thurn-Albrecht, Phys. Rev. Lett., 2001, 87, 226101 CrossRef CAS.
- Y.-S. Sun, T.-M. Chung, Y.-J. Li, R.-M. Ho, B.-T. Ko, U.-S. Jeng and B. Lotz, Macromolecules, 2006, 39, 5782–5788 CrossRef CAS.
- S. Nakagawa, K.-I. Kadena, T. Ishizone, S. Nojima, T. Shimitzu, K. Yamaguchi and S. Nakahama, Macromolecules, 2012, 45, 1892–1900 CrossRef CAS.
- M.-C. Lin, H.-L. Chen, W.-B. Su, C.-J. Su, U.-S. Jeng, F.-Y. Tzeng, J.-Y. Wu, J.-C. Tsai and T. Hashimoto, Macromolecules, 2012, 45, 5114–5127 CrossRef CAS.
- M. V. Massa and K. Dalnoki-Veress, Phys. Rev. Lett., 2004, 92, 255509 CrossRef.
- A. Röttele, T. Thurn-Albrecht, J.-U. Sommer and G. Reiter, Macromolecules, 2003, 36, 1257–1260 CrossRef.
- E. Woo, J. Huh, Y. G. Jeong and K. Shin, Phys. Rev. Lett., 2007, 98, 136103 CrossRef.
- K. Shin, E. Woo, Y. G. Jeong, C. Kim, J. Huh and K.-W. Kim, Macromolecules, 2007, 40, 6617–6623 CrossRef CAS.
- H. Wu, W. Wang, Y. Huang and Z. Su, Macromol. Rapid Commun., 2009, 30, 194–198 CrossRef CAS.
- M. Steinhart, S. Senz, R. B. Wehrpohn, U. Gösele and J. H. Wendorff, Macromolecules, 2003, 36, 3646–3651 CrossRef CAS.
- R. M. Michell, A. T. Lorentzo, A. J. Müller, M.-C. Lin, H.-L. Chen, I. Blaszczyk-Lezak, J. Martin and C. Mijangos, Macromolecules, 2012, 45, 1517–1528 CrossRef CAS.
- H. Duran, M. Steinhart, H.-J. Butt and G. Floudas, Nano Lett., 2011, 11, 1671–1675 CrossRef CAS.
- Y. Suzuki, H. Duran, M. Steinhart, H.-J. Butt and G. Floudas, Soft Matter, 2013, 9, 2621–2628 RSC.
- H. Masuda and K. Fukuda, Science, 1995, 268, 1466–1468 CAS.
- H. Masuda, F. Hasegawa and S. Ono, J. Electrochem. Soc., 1997, 144, L127–L130 CrossRef CAS.
- H. Masuda, K. Yada and A. Osaka, Jpn. J. Appl. Phys., 1998, 37, L1340–L1342 CrossRef.
- M. Steinhart, Adv. Polym. Sci., 2008, 220, 123 CAS.
- H. Duran, A. Gitsas, G. Floudas, M. Mondeshki, M. Steinhart and W. Knoll, Macromolecules, 2009, 42, 2881–2885 CrossRef CAS.
- H. Marand, J. Xu and S. Srinivas, Macromolecules, 1998, 31, 8219 CrossRef CAS.
- A. Gitsas and G. Floudas, Macromolecules, 2008, 41, 9423–9429 CrossRef CAS.
- J. E. Mark, Physical Properties of Polymers Handbook, Springer, 2nd edn, 2007, p. 636 Search PubMed.
- I. W. Hamley, J. Phys.: Condens. Matter, 2001, 13, R643–R671 CrossRef CAS.
- E. L. Thomas, D. M. Anderson and C. S. Henkee, Nature, 1988, 334, 598 CrossRef CAS.
- F. Kremer and A. Schönhals, in Broadband Dielectric Spectroscopy, Springer, Berlin, 2002 Search PubMed.
- G. Floudas, M. Paluch, A. Grzybowski and K. L. Ngai, in Molecular Dynamics of Glass-Forming Systems. Effects of Pressure, Springer, 2011 Search PubMed.
- G. Floudas, in Dielectric Spectroscopy, ed. K. Matyjaszewski and M. Möller, Polymer Science: A Comprehensive Reference, Elsevier BV, Amsterdam, 2012, vol. 2.32, pp. 825–845 Search PubMed.
- S. Havriliak and S. Negami, Polymer, 1967, 8, 161 CrossRef CAS.
- H. Bittiger, R. H. Marchessault and W. D. Niegisch, Acta Crystallogr., Sect. B: Struct. Crystallogr. Cryst. Chem., 1970, 26, 1923–1927 CrossRef CAS.
- L. G. M. Beekmans and G. J. Vancso, Polymer, 2000, 41, 8975–8981 CrossRef CAS.
- L. G. Schulz, J. Appl. Phys., 1949, 20, 1030–1032 CrossRef.
- H. Duran, B. Hartmann-Azanza, M. Steinhart, X. Feng, K. Müllen, H.-J. Butt and G. Floudas, ACS Nano, 2012, 6, 9359 CrossRef CAS.
- P. H. Hermans, D. Vermaas and A. Weidinger, Rec. Trav. Chim., 1946, 65, 427–447 CrossRef.
- U. W. Gedde, Polymer Physics, Chapman. & Hall, London and New York, 1995 Search PubMed.
- F. B. Khambatta, F. Warner, T. Russell and R. S. Stein, J. Polym. Sci., Polym. Phys. Ed., 1976, 14, 1391 CrossRef CAS.
- B. M. Baysal and W. H. Stockmayer, Macromolecules, 1994, 27, 7429–7432 CrossRef CAS; A. A. Jones, G. A. Brehm and W. H. Stockmayer, J. Polym. Sci., 1974, 46, 149–159 Search PubMed.
- A. Deres, G. A. Floudas, K. Müllen, M. Van der Auweraer, F. De Schryver, J. Enderlein, H. Uji-i and J. Hofkens, Macromolecules, 2011, 44, 9703 CrossRef CAS.
- M. M. Elmahdy, K. Chrissopoulou, A. Afratis, G. Floudas and S. H. Anastasiadis, Macromolecules, 2006, 39, 5170–5173 CrossRef CAS.
- M. Avrami, J. Chem. Phys., 1939, 7, 1103 CrossRef CAS; J. Chem. Phys., 1940, 8, 212 Search PubMed; J. Chem. Phys., 1941, 9, 177 Search PubMed.
- E. Zhuravlev, J. W. P. Schmelzer, B. Wunderlich and C. Schick, Polymer, 2011, 52, 1983–1997 CrossRef CAS.
Footnote |
| † Electronic supplementary information (ESI) available. See DOI: 10.1039/c3sm50907a |
| This journal is © The Royal Society of Chemistry 2013 |
