 Open Access Article
Creative Commons Attribution 3.0 Unported Licence
Electrostatically directed liposome adsorption, internalization and fusion on hydrogel microparticles
Youssef
Helwa
,
Neeshma
Dave
and
Juewen
Liu
*
Department of Chemistry, Waterloo Institute for Nanotechnology, University of Waterloo, Waterloo, Ontario N2L 3G1, Canada. E-mail: liujw@uwaterloo.ca
First published on 30th May 2013
Abstract
Supported lipid bilayers have found a diverse range of applications in understanding membrane biophysics, biosensor development, drug screening, and drug delivery. While silica has been the most frequently used supporting material, hydrogels might act as a superior alternative not only because of their soft nature allowing better interfacing with transmembrane proteins but also their porous interior for molecular containment. Unlike silica, where neutral and even same charged liposomes can readily fuse, electrostatic attraction is crucial for liposome fusion onto hydrogels. In addition to fusion, we systematically characterized other interactions including liposome adsorption onto and diffusion into hydrogels. The fused membrane forms a continuous bilayer for the most part, which is demonstrated by the observation that the diffusion of DNA is blocked but small dyes could still enter the gel. The kinetics of liposome–gel interaction is characterized using calcein loaded liposomes, where liposome rupture is observed only when the oppositely charged gel is added. With this work, a more complete picture about the interaction between liposomes and hydrogels is obtained.
Introduction
Liposomes can fuse onto many solid surfaces to form supported lipid bilayers (SLBs), which possess better stability than unsupported liposomes while still maintaining bilayer fluidity.1–4 With many surface analysis tools being available, SLBs serve as an excellent model to study reactions within biological membranes. In addition, SLBs are used for drug screening, biosensing, bioelectronics and drug delivery. For example, a nanoparticle core allows for drug delivery,5–10 while a patterned planar surface can be used for drug screening to target transmembrane proteins.11 A microparticle core can be studied by optical microscopy and it supports coherent bilayers without edges that might be present in planar supported bilayers.12–15Silica or glass has been the most commonly used material to prepare SLBs.16 Later it was discovered that the water layer between the silica surface and the lipid head group is just about 1–2 nm and large transmembrane proteins may denature by coming into contact with the silica support.4 To solve this problem, a polymer cushion was used to coat the particle surface to avoid direct protein adsorption by silica.17 In this case, silica was used only as a template; the chemistry of polymer coating governs the lipid interface. Polyelectrolytes are among the most frequently used cushion polymers.17–19
Hydrogels are crosslinked hydrophilic polymers, providing a native cushion to interface with liposomes. Indeed, hydrogel-supported bilayers have been recently reported.20–24 The porous hydrogel structure allows loading of various dyes, ligands, and drugs. In addition, the hydrogel formulation is easily tunable to modulate its charge and hydrophobicity, allowing additional features in terms of cargo loading, releasing, and volume phase transition. Four different methods have been reported so far to prepare hydrogel supported bilayers. First, gel particles were centrifuged on a lipid film coated tube,20,25 but the yield was low for certain gels.21 Second, hydrophobic surface modification was achieved with lipid anchors, which has been a popular method.22,26–31 To form high quality supported bilayers, however, multiple freezing and thaw cycles are required.22 In addition, this process requires the use of organic solvents, making it less biocompatible. Third, SLBs can be formed by crosslinking hydrogels inside liposome templates.23,32,33 In this way, the size of SLBs is determined by the liposome size. Finally, based on electrostatic attraction, SLBs can be prepared by mixing oppositely charged liposomes and hydrogels.25,34 We consider the last method based on electrostatic interaction to be the most easily implemented since it does not require specialized synthesis or equipment and SLBs can be prepared by a simple mixing step.
While the charge requirement for liposome fusion onto hydrogels has been established, there is still no complete picture about other interactions. Several possible outcomes of hydrogel–liposome interactions are described in Fig. 1. For example, whether neutral gels can still adsorb or even internalize liposomes remains unknown. It is unclear whether liposome fusion onto hydrogels occurs spontaneously or requires liposome lateral interaction. In this work, we prepare polyacrylamide hydrogel microparticles and test their interactions with charged liposomes. Systematic studies were performed using epi-fluorescence microscopy, laser scanning confocal microscopy and fluorescence spectroscopy. We found that liposomes can adsorb, diffuse into, and fuse onto the gel surfaces, depending on their charges.
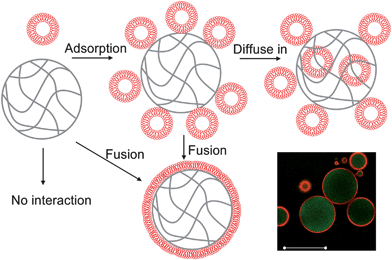 | ||
| Fig. 1 Schematics of possible liposome–hydrogel microparticle interactions. Liposomes can be adsorbed onto the gel surface and may also be internalized by the gel. Fusion may also occur to form SLBs. The confocal fluorescence micrograph on the bottom right corner shows a green fluorescent cationic gel (with adsorbed calcein dye) with a DOPG liposome (rhodamine labeled) layer on the surface. Scale bar = 50 μm. The third possibility is to have no interaction. | ||
Materials and methods
Chemicals
Acrylamide, bis-acrylamide, allylamine, 2-acrylamido-2-methyl-1-propanesulfonic acid (AMPS), Triton X-100, Span 80, cholesterol, chloroform ammonium persulphate (APS), and N,N,N′,N′-tetramethylethylenediamine (TEMED) were purchased from VWR (Mississauga, Ontario, Canada). NaCl, 4-(2-hydroxyethyl)-1-piperazineethanesulfonic acid (HEPES) and its sodium salt, bromophenol blue, were purchased from Mandel Scientific (Guelph, Ontario, Canada). Fluorescein sodium salt and thiazole orange were purchased from Sigma-Aldrich. The 12-mer DNA FAM-labeled DNA (FAM-5′-CACTGACCTGGG) was purchased from Integrated DNA Technologies (Coralville, IA). The phospholipids were purchased from Avanti Polar Lipids (Alabaster, AL). The phospholipids used in this study are listed below: 1,2-dioleoyl-sn-glycero-3-phosphocholine (DOPC), 1,2-dioleoyl-sn-glycero-3-phospho-(1′-rac-glycerol) (sodium salt) (DOPG), 1,2-dioleoyl-3-trimethylammonium-propane (chloride salt) (DOTAP), and 1,2-dioleoyl-sn-glycero-3-phosphoethanolamine-N-(lissamine rhodamine B sulfonyl) (ammonium salt) (Rh-DOPE).Hydrogel microparticle preparation
Polyacrylamide hydrogel microparticles were prepared using an inverse emulsion polymerization method. The aqueous phase (2 mL) contained APS (4 μL, 0.5 mg μL−1), acrylamide (0.18 g) and methylenebisacrylamide (0.02 g). To prepare charged gels, 0.04 g of allylamine or AMPS was included for cationic or anionic gels, respectively. The oil phase consisted of cyclohexane (2 mL) and Span 80 (100 μL) as the surfactant. The aqueous phase was dispersed into the oil phase in a 10 mL glass vial. The solution was stirred at 800 rpm for 5 min in an ice bath to form an inverse emulsion. After purging the emulsion with nitrogen for 2 min, the polymerization was initiated by adding TEMED (4 μL). The polymerization was continued for 4 h under 800 rpm stirring. After that, the stirring was stopped and the emulsion phase separated to allow the removal of the top cyclohexane layer. Each 100 μL of the aqueous phase was dissolved in 1 mL ethanol. After 1 h of soaking in ethanol, the solution was centrifuged for 15 min at 15![[thin space (1/6-em)]](https://www.rsc.org/images/entities/char_2009.gif) 000 rpm and ethanol was removed. The gel beads were dispersed in 1 mL of water followed by another 30 min of soaking and centrifugation. This washing process was repeated 4 times in water to ensure that all the hydrogels were free of other chemicals such as unreacted monomers and initiators. Finally, the gels were dispersed at a concentration of 10 mg mL−1 (considering only the dry mass of the gel).
000 rpm and ethanol was removed. The gel beads were dispersed in 1 mL of water followed by another 30 min of soaking and centrifugation. This washing process was repeated 4 times in water to ensure that all the hydrogels were free of other chemicals such as unreacted monomers and initiators. Finally, the gels were dispersed at a concentration of 10 mg mL−1 (considering only the dry mass of the gel).
Liposome preparation
Liposomes were prepared by the standard extrusion method. Lipids dissolved in chloroform were mixed at designated ratios in a glass scintillation vial with a final mass of 2.5 mg. To track the liposomes, 1% Rh-DOPE lipids were used. The chloroform was evaporated under a gentle flow of N2 followed by storage in a vacuum oven overnight. The dried lipid film was stored at −20 °C prior to use. To hydrate the lipid, 1 mL buffer A (100 mM NaCl, 20 mM HEPES, pH 7.6) or 100 mM calcein was added to the lipid film for at least 3 h. Fully hydrated lipids were then extruded through a membrane with either 50 or 100 nm pore size. The calcein containing liposomes were purified by passing the sample (50 μL) through a Pd-10 column to remove free calcein. The liposome size and ζ-potential were measured using dynamic light scattering (Zetasizer Nano ZS90, Malvern). Measurements were performed by dispersing liposomes at a concentration of 0.25 mg mL−1 in buffer (10 mM NaCl, 3 mM HEPES, pH 7.6). The temperature was set at 25 °C for all measurements. The cryo-TEM micrograph of liposome was acquired as described in a previous publication.35Supported bilayer preparation
Supported bilayers were prepared by mixing 100 μL of hydrogel microparticles with 50 μL of 2.5 mg mL−1 liposomes. The mixture was allowed to mix for 1 h on a rocker with occasional pipette agitation. After centrifugation, the free liposomes were removed and supported bilayers were washed and dispersed in buffer (100 mM NaCl, 20 mM HEPES, pH 7.6).Fluorescence microscopy
The epi-fluorescence micrographs were acquired on a Leica inverted fluorescence microscope with a 40× objective. The confocal fluorescence images were acquired on an inverted Zeiss LSM 510 microscope with a 40× water immersion objective. The hydrogel supported bilayers (2 μL) were spotted on a microscope glass slide and a cover slip was sealed using superglue. Both z-stacking and cross-section data were acquired.Calcein loaded liposomes
For this experiment, 1 μL of the calcein loaded DOPC or DOPG liposomes purified from the Pd-10 column was dispersed in 1 mL of buffer A. The final lipid concentration was estimated to be lower than ∼2 μg mL−1. A volume of 50 μL of this liposome solution was transferred into a 96-well plate and its fluorescence was monitored using a microplate reader (Tecan Infinite F200 Pro) as a function of time. When the fluorescence was stabilized, 5 μL of gel suspensions were mixed with the liposome and the kinetics of fluorescence change was monitored. Finally, 1 μL of 5% Triton was added to rupture the liposomes and the fluorescence after this treatment was also recorded.DNA diffusion
To test the integrity of SLBs, neutral gels were mixed with DOPC or DOPG liposomes overnight in buffer A. After removing excess liposomes, the SLBs were incubated with 2 μM FAM-labeled DNA (5′-FAM-CACTGACCTGGG) or 10 μM fluorescein. After 2 min, the SLBs were centrifuged, washed and imaged by epi-fluorescence microscopy.Results and discussion
SLB preparation and charge interactions
Charged or neutral hydrogel microparticles were prepared using an emulsion polymerization method. The monomers were 10% acrylamide:bisacrylamide dissolved in water for the neutral gel. To prepare the charged gel, cationic allylamine or anionic AMPS monomers were added so that they represented 20% of the total monomer weight. A micrograph of positively charged gels is shown in Fig. 2B. The gel size distribution was characterized by measuring at least 200 particles. As shown in Fig. 2A, all three types of gels have a broad size distribution between 10 and 100 μm, making optical microscopy ideal for their characterization. Charged gels appeared to be larger than the neutral ones since they tend to swell more. Due to their large size, it was difficult to directly measure their ζ-potential. Therefore, we used dye adsorption experiments to confirm their charge (Fig. 2D). After mixing with negatively charged bromophenol blue and washing, the cationic gel showed the most intense blue color, followed by the neutral one. The negatively charged gels were almost colorless, consistent with their respective charge. Similarly, positively charged thiazole orange entered only the negatively charged gels as shown by the dye's fluorescence in Fig. 2E.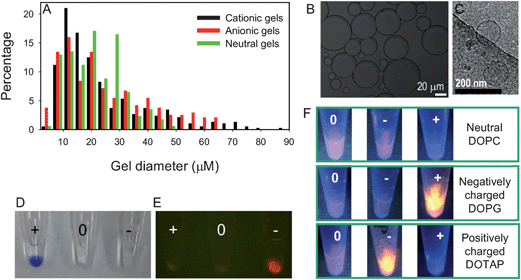 | ||
| Fig. 2 (A) Size distribution of the three types of hydrogel microparticles prepared in this work. The neutral gels barely exceed 50 μm, while the charged gels can reach much larger sizes. (B) An optical micrograph of a cationic gel sample. (C) A cryo-TEM micrograph of the DOPC liposome used in this work. Testing the adsorption of negatively charged bromophenol blue (D) or positively charged thiozole orange (E) by gels with different charges. The picture in (E) was acquired in a dark room under 470 nm excitation. (F) Fluorescence intensity of liposome/gel complexes of various charge combinations. Association of the Rh-DOPE labeled liposome with hydrogels occurred for all the samples and oppositely charged ones showed the highest lipid association. | ||
We next prepared DOPC, DOPG, and DOTAP liposomes, respectively, each containing a 1% Rh-DOPE label. After extrusion, the liposomes had a diameter of ∼100 nm as characterized by dynamic light scattering. A cryo-TEM micrograph of the DOPC liposome shows its unilamellar structure (Fig. 2C). Their surface charges were characterized by ζ-potential measurements (DOPC = −2.2 mV; DOPG = −25 mV; DOTAP = +58 mV in 10 mM NaCl, 3 mM HEPES, pH 7.6). Next the hydrogel particles and liposomes were mixed at all possible charge combinations in buffer (100 mM NaCl, 20 mM HEPES, pH 7.6). After the removal of free liposomes by centrifugation, the hydrogels were dispersed in the same buffer and observed under UV excitation (Fig. 2F). The fluorescence intensity is thus proportional to the amount of lipid associated with the gels. The highest fluorescence intensity was observed in the presence of oppositely charged samples. The same charged samples had the lowest fluorescence and the neutral ones were in between. This is expected based on the electrostatic interaction. It is important to realize that there was still hydrogel–liposome binding even when the charge interaction was repulsive. Given the soft nature of both the liposome and hydrogel, their possible interaction can be summarized in Fig. 1. In addition to fusion to form SLBs, simple liposome adsorption and diffusion into the gels may also occur. To understand the detailed interaction mechanisms, we next employed fluorescence microscopy to study each sample.
Confocal fluorescence microscopy characterization
To acquire more information regarding the liposome–hydrogel interaction, laser scanning confocal microscopy (LSCM) studies were carried out. Each sample was imaged for both the cross-section (the left panels in Fig. 3) and z-stacking (the right panels) to reconstruct the 3D views. Indeed, consistent with the above visual observation, all the samples showed red fluorescence, although the intensity was quite different. Mixing the neutral gel with neutral DOPC (Fig. 3A) produced a relatively homogeneous coating. While most lipid fluorescence was concentrated on the gel surface, some background fluorescence was still observed. Since all the samples have been repeatedly washed, the presence of background fluorescence suggests that adsorbed liposomes could also desorb. Mixing the neutral gel with negatively charged DOPG resulted in liposome internalization as shown in Fig. 3B (left panel). Internalization was an indication of liposome adsorption instead of fusion, since fused bilayers should prevent liposome diffusion into the gel. To the best of our knowledge, this is the first report on liposomes internalization and this might be useful for preparing advanced drug delivery or sensing materials. When a cationic DOTAP liposome was mixed with the neutral gel, we observed patches of fluorescence on the gel surface (Fig. 3C). Since DOTAP had a strong binding affinity towards the negatively charged glass slide used for microscopic imaging, a lot of the signal on the gel was lost due to lipid transfer to glass, which is more evident using epi-fluorescence microscopy (vide infra). Some DOTAP liposomes might also be internalized by the gel but the overall internal fluorescence signal was quite weak.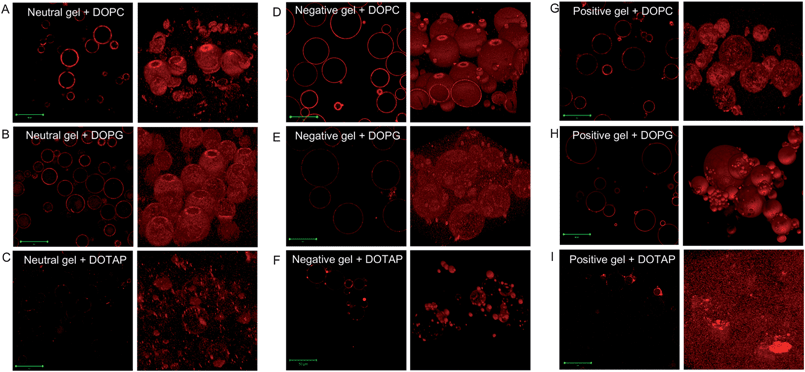 | ||
| Fig. 3 Confocal fluorescence micrographs of the liposome–gel complexes with various charge combinations. The left panels are slices of the cross-sections and the right panels are the re-constructed z-stack images. The scale bars are 50 μm. | ||
Very clean images with little background or internal fluorescence were obtained when the negatively charged gel was mixed with neutral DOPC (Fig. 3D), indicating a high adsorption affinity. As shown in Fig. 2F, this sample contained much less lipid than oppositely charged samples and it is likely that DOPC only adsorbed onto the gel surface instead of fusion. Even when both the gel and liposome were negatively charged, fluorescence signals were still observed on the gel surface (Fig. 3E). The high background fluorescence indicated very weak binding. The adsorption of the same charged liposome and silica nanoparticles has been previously reported. Adsorption occurred with even 50% of negatively charged lipids while fusion to form complete SLBs occurred only for the samples with less than 25% of negatively charged lipids.36 In our system, the negative lipid composition was 99%, showing only weak adsorption. When mixed with cationic DOTAP, the negatively charged gels showed different fluorescence intensities depending on the gel size (Fig. 3F). Smaller gels were smoothly coated but larger ones were much less fluorescent. Again, we attributed this to the transfer of the cationic lipid to the glass surface by the larger gels in contact with the glass. Smaller gels were not in direct contact with glass and thus retained their fluorescence. Note that this sample showed the highest fluorescence shown in Fig. 2F.
The cationic gel appears to bind less DOPC than the anionic gel (e.g. compare Fig. 3D with 3G). DOPC contains a zwitterionic head group but the moiety that was directly in contact with the gel is the cationic part. This might be the reason that DOPC binds more to anionic gels. Very homogeneous images were obtained from mixing the cationic gel with negative DOPG (Fig. 3H); all the gels were coated with the lipid and no background or internal fluorescence was observed. When the cationic gel and DOTAP were mixed, a very poor signal was observed with very high background (Fig. 3I). Most of the lipids were transferred to the glass and others contributed to the background. The confocal experiment confirms the association of liposomes with all the gel samples and the details of such micrographs suggest the various types of interactions. For example, liposome internalization is a strong indication against fusion. The amount of background fluorescence indicates the adsorption affinity.
Epi-fluorescence microscopy characterization
While confocal microscopy provides information about the distribution of fluorescence intensity in a 3-D manner, we found that epi-fluorescence microscopy could offer complementary information. Fig. 4 shows the same samples imaged at two different focus planes. The left panels are focused on the center of the gels; an intense ring structure is observed on each gel while the interior fluorescence appears to be quite weak. Samples with low fluorescence intensity shown in Fig. 2F exhibit non-continuous intensity distribution, suggesting that only a small number of liposomes are adsorbed for these samples and they cannot coat the whole gel surface. We also adjusted the focus to make it close to the surface of the glass slide (right panels). Except for the two oppositely charged combinations (Fig. 4F and H), all the rest show dotted fluorescence distribution. This dotted pattern has several implications. First, liposomes are adsorbed instead of becoming fused. Otherwise we should observe a continuous fluorescence distribution. Second, liposome adsorption to glass is more favorable than that to the gel, which may be because glass has more solid contact area with the lipid.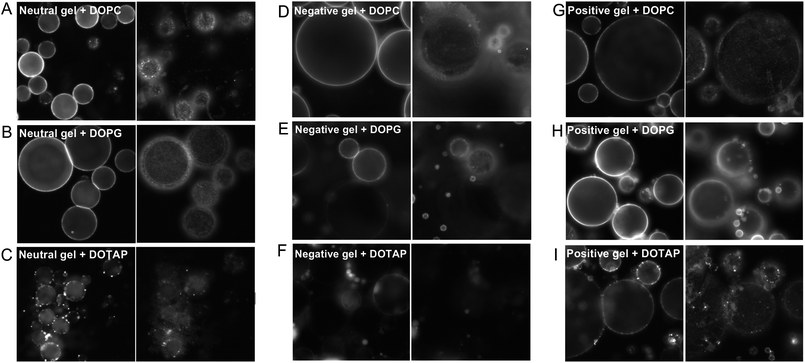 | ||
| Fig. 4 Epi-fluorescence micrographs of the liposome–gel complexes with different charge combinations. The left panels are focused on the middle plane of the gels and the right panels are focused toward the glass surface. | ||
Internalization
From the confocal fluorescence microscopy experiment, we noticed that some liposomes diffused into the internal compartment of the gel particles. The most obvious example was the entering of the neutral gels by negatively charged DOPG. We reason that the driving force for the internalization is diffusion since the liposomes have a higher concentration outside the gel. To enter into the gel, a liposome has to go through the gel pores. Our 10% gel with 10% crosslinker should give an average pore size of just 7–8 nm, while pores larger than 12 nm are unlikely to be present.37 Therefore, the liposomes should be deformed to cross the pores. To further test liposome deformation, we varied the size of liposomes since larger liposomes are likely to diffuse slower if they were rigid in this process. We prepared 50 nm and 100 nm DOPG and DOPC liposomes. As shown in Fig. 5A and B, DOPG liposomes of both sizes showed a similar profile of entering the gels with little size selectivity. Similar observations were made for the DOPC liposomes, although at a lower efficiency (Fig. 5C and D). Therefore, the charge of liposome, instead of size, appeared to be the dominating factor for liposomes entering the gel. The fact that size was irrelevant suggests that the liposomes must be deformed while diffusing within the gel pores. Due to the long sample preparation time required to perform confocal microscopy experiments, we only mixed the liposomes with the gels for 1 h and no shorter incubation time was studied. It cannot be ruled out that some difference between the two-sized liposome might occur with shorter time incubation. Despite this, the conclusion that liposomes should be deformed to enter the gel still holds true. We did not observe internalization of rigid 50 nm DNA-capped gold nanoparticles into hydrogels, which also serves as a support for the importance of liposome deformation to enter the gels.38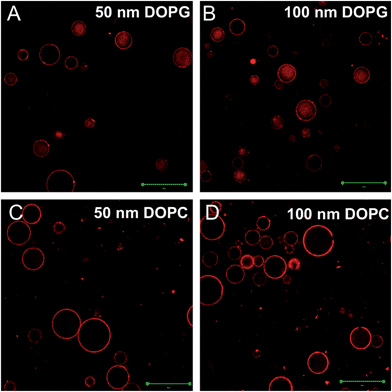 | ||
| Fig. 5 Confocal fluorescence micrographs of 50 nm DOPG (A), 100 nm DOPG (B), 50 nm DOPC (C) and 100 nm DOPC (D) diffusing into neutral gels. Scale bars = 50 μm. | ||
Given that both negative and positive liposomes entered more than the neutral ones (see Fig. 3A–C for comparison), it is unlikely that electrostatic attraction with gel can be the explanation. Based on the above liposome size study and the reasoning of liposome deformation, it appears that liposome deformability is important. It might be that charged liposomes are more easily deformed. A number of studies have been carried out to study the mechanical properties of liposomes,39–42 and it was found that membranes containing unsaturated tails (which is the case for all the lipids used here) are much softer than those with saturated lipids.41 We cannot find quantitative comparisons on the effect of head group charge, but it might be possible that charged liposomes experience more repulsive forces within the bilayer to make them more easily deformed. Further studies are needed to confirm this possibility.
Fusion test
The above fluorescence micrographs suggest that the interactions between liposomes and hydrogels include fusion, adsorption and internalization. However, since optical microscopy cannot resolve individual liposomes or bilayers, explicit conclusions still cannot be made for fusion or adsorption. In addition, the above experiments were performed using an excess amount of lipid and it is known that such a condition may favor fusion due to liposome lateral interactions on the hydrogel surface. It remains unclear whether fusion with hydrogel can occur with a very low liposome concentration. Liposome adsorption kinetics onto other surfaces have been studied using QCM, AFM, and ellipsometry.43,44 To further probe these questions, the following experiments were designed. Calcein was encapsulated within DOPC and DOPG liposomes at a self-quenching concentration of 100 mM. DOTAP liposomes failed to work because calcein caused their aggregation. Free calcein was removed by passing the liposomes through a gel filtration column. These purified liposomes were then used as a probe; where fluorescence increase indicates liposome fusion to release the dye. For simple adsorption, there should be little fluorescence change. In this experiment, the liposome concentration was more than 1000 times diluted compared to the previous Rh-labeled liposomes and therefore, liposome lateral interaction on the gel surface should be minimal.The fluorescence of the liposome samples was monitored for several minutes before hydrogel particles were added. As shown in Fig. 6A, the neutral DOPC liposome showed little fluorescence increase regardless of the type of gel added (gel addition indicated by the black arrow), suggesting that DOPC did not fuse with any of the gel particles. This is consistent with the conclusions made based on microscopic studies. Addition of Triton X-100 resulted in fluorescence increase, confirming that calcein was inside the liposomes. For the negative DOPG liposome, a fluorescence increase was observed only when mixed with the cationic gel (Fig. 6B). Therefore, cationic gel and DOPG fusion was spontaneous and occurred even at very low liposome concentration. The kinetics were initially fast followed by a slow increase. Upon agitation of the sample, a spike in fluorescence was again observed. This was attributed to the slow diffusion of liposomes to the gel surface and this process can be accelerated by mechanical mixing. Silica particles are also negatively charged, but their fusion with neutral and even negative liposomes can still occur.36 However, our data and other reports indicated that electrostatic attraction was required for liposome fusion onto hydrogels. The hydrogel particles are mostly water (e.g. typically greater than 90% water) and therefore most lipids interact only with water, inhibiting fusion unless strong electrostatic attraction is present. In most of our experiments, we chose to use 1 h as the mixing time, which should be sufficient for liposomes to fuse with the oppositely charged gels. For the other charge combinations, it might take more time to reach equilibrium.
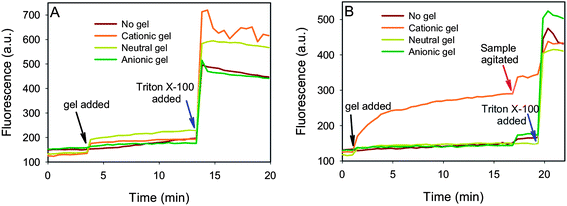 | ||
| Fig. 6 Probing liposome adsorption or fusion mechanism using calcein encapsulated self-quenched neutral DOPC (A) or negatively charged DOPG (B) liposomes. Fluorescence increase indicates liposome rupture and fusion onto the gel surface. Triton X-100 can completely rupture the liposomes. | ||
Bilayer integrity
To test whether the fused liposome formed a continuous bilayer on the gel surface, positively charged gel beads were mixed with DOPC and DOPG, respectively. After removing the excess liposomes, the gel beads were exposed to a FAM-labeled 12-mer DNA. Since the DNA is negatively charged, the uncoated cationic gel should adsorb it to give green fluorescence. The gels mixed with the DOPC liposome were highly green fluorescent as shown in Fig. 7A, suggesting that no complete bilayer formation occurred, although the liposome red fluorescence can be clearly observed (Fig. 7B). This is consistent with the above liposome adsorption mechanism. For the DOPG coated gels, on the other hand, very little green fluorescence was observed (Fig. 7C), suggesting that a negatively charged bilayer was formed on the gel surface to prevent DNA from diffusing into the gel. Defects, however, were still present in such SLBs. If the negatively charged fluorescein dye was used as a probe, the gel beads turned green even for this sample (data not shown). The defect size was likely to be on the order of several nanometers to prevent DNA from entering the gel. Since the major difference between the free fluorescein molecule and the FAM-labeled DNA is size (both are negatively charged), charge repulsion by DOPG might play only a minor role in excluding the DNA from entering the DOPG coated gel.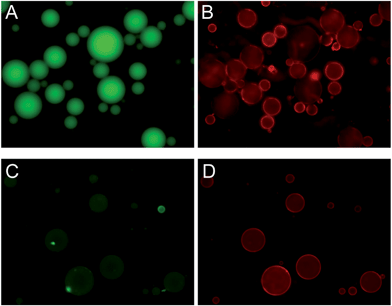 | ||
| Fig. 7 Epi-fluorescence micrographs of Rh-labeled DOPC (A and B) or DOPG (C and D) coated cationic hydrogel microparticles mixed with a FAM-labeled 12-mer DNA. Both the FAM fluorescence (A and C) and lipid fluorescence (B and D) are shown. | ||
Conclusions
In summary we have prepared three types of gels with different charges via a simple emulsion polymerization technique and also prepared three types of liposomes with different charges. By mixing the liposomes with the gels, a total of nine combinations were obtained. We confirmed that liposomes effectively fused onto the gel surface only when they are oppositely charged. For other combinations, liposomes could still adsorb onto the gel surface and even be internalized through diffusion. The formed bilayers are able to exclude DNA from entering. The fact that negatively charged silica surfaces are able to form SLBs with all kinds of charged liposomes (as long as the negative charge density is not too high) indicates a major difference between hydrogel and silica particles. Hydrogel supported bilayers are likely to find applications in fundamental biophysical studies, biosensor development and drug delivery.Acknowledgements
This work is supported by the University of Waterloo, Canada Foundation for Innovation, and the Natural Sciences and Engineering Research Council (NSERC) of Canada. J. L. has received an Early Researcher Award from the Ontario Ministry of Research and Innovation.References
- E. Sackmann, Science, 1996, 271, 43–48 CAS.
- S. G. Boxer, Curr. Opin. Chem. Biol., 2000, 4, 704–709 CrossRef CAS.
- R. P. Richter, R. Berat and A. R. Brisson, Langmuir, 2006, 22, 3497–3505 CrossRef CAS.
- E. T. Castellana and P. S. Cremer, Surf. Sci. Rep., 2006, 61, 429–444 CrossRef CAS.
- J. Liu, A. Stace-Naughton, X. Jiang and C. J. Brinker, J. Am. Chem. Soc., 2009, 131, 1354–1355 CrossRef CAS.
- J. Liu, A. Stace-Naughton and C. J. Brinker, Chem. Commun., 2009, 5100–5102 RSC.
- J. Liu, X. Jiang, C. Ashley and C. J. Brinker, J. Am. Chem. Soc., 2009, 131, 7567–7569 CrossRef CAS.
- C. E. Ashley, E. C. Carnes, G. K. Phillips, D. Padilla, P. N. Durfee, P. A. Brown, T. N. Hanna, J. Liu, B. Phillips, M. B. Carter, N. J. Carroll, X. Jiang, D. R. Dunphy, C. L. Willman, D. N. Petsev, D. G. Evans, A. N. Parikh, B. Chackerian, W. Wharton, D. S. Peabody and C. J. Brinker, Nat. Mater., 2011, 10, 389–397 CrossRef CAS.
- J. Li, Y.-C. Chen, Y.-C. Tseng, S. Mozumdar and L. Huang, J. Controlled Release, 2010, 142, 416–421 CrossRef CAS.
- R. Mukthavaram, W. Wrasidlo, D. Hall, S. Kesari and M. Makale, Bioconjugate Chem., 2011, 22, 1638–1644 CrossRef CAS.
- J. T. Groves, N. Ulman and S. G. Boxer, Science, 1997, 275, 651–653 CrossRef CAS.
- A. Bershteyn, J. Chaparro, R. Yau, M. Kim, E. Reinherz, L. Ferreira-Moita and D. J. Irvine, Soft Matter, 2008, 4, 1787–1791 RSC.
- E. L. Kendall, E. Mills, J. Liu, X. Jiang, C. J. Brinker and A. N. Parikh, Soft Matter, 2010, 6, 2628–2632 RSC.
- G. Gopalakrishnan, I. Rouiller, D. R. Colman and R. B. Lennox, Langmuir, 2009, 25, 5455–5458 CrossRef CAS.
- T. Buranda, J. Huang, G. V. Ramarao, L. K. Ista, R. S. Larson, T. L. Ward, L. A. Sklar and G. P. Lopez, Langmuir, 2003, 19, 1654–1663 CrossRef CAS.
- K. C. Weng, J. J. R. Stalgren, D. J. Duval, S. H. Risbud and C. W. Frank, Langmuir, 2004, 20, 7232–7239 CrossRef CAS.
- J. Y. Wong, J. Majewski, M. Seitz, C. K. Park, J. N. Israelachvili and G. S. Smith, Biophys. J., 1999, 77, 1445–1457 CrossRef CAS.
- C. Ma, M. P. Srinivasan, A. J. Waring, R. I. Lehrer, M. L. Longo and P. Stroeve, Colloids Surf., B, 2003, 28, 319–329 CrossRef CAS.
- R. Kugler and W. Knoll, Bioelectrochemistry, 2002, 56, 175–178 CrossRef CAS.
- P. F. Kiser, G. Wilson and D. Needham, J. Controlled Release, 2000, 68, 9–22 CrossRef CAS.
- B. G. De Geest, B. G. Stubbe, A. M. Jonas, T. Van Thienen, W. L. J. Hinrichs, J. Demeester and S. C. De Smedt, Biomacromolecules, 2006, 7, 373–379 CrossRef.
- Q. Saleem, B. Liu, C. C. Gradinaru and P. M. Macdonald, Biomacromolecules, 2011, 12, 2364–2374 CrossRef CAS.
- A. Jesorka, M. Markstrom, M. Karlsson and O. Orwar, J. Phys. Chem. B, 2005, 109, 14759–14763 CrossRef CAS.
- A. Takagi, H. Hokonohara and T. Kawai, Anal. Bioanal. Chem., 2009, 395, 2405–2409 CrossRef CAS.
- P. F. Kiser, G. Wilson and D. Needham, Nature, 1998, 394, 459–462 CrossRef CAS.
- M. Major, E. Prieur, J. F. Tocanne, D. Betbeder and A. M. Sautereau, Biochim. Biophys. Acta, Biomembr., 1997, 1327, 32–40 CrossRef CAS.
- T. Jin, P. Pennefather and P. I. Lee, FEBS Lett., 1996, 397, 70–74 CrossRef CAS.
- M. L. Kraft and J. S. Moore, J. Am. Chem. Soc., 2001, 123, 12921–12922 CrossRef CAS.
- C. C. Ng, Y.-L. Cheng and P. S. Pennefather, Macromolecules, 2001, 34, 5759–5765 CrossRef CAS.
- N. MacKinnon, G. r. Guerin, B. Liu, C. C. Gradinaru, J. L. Rubinstein and P. M. Macdonald, Langmuir, 2009, 26, 1081–1089 CrossRef.
- S. Kazakov, M. Kaholek, I. Teraoka and K. Levon, Macromolecules, 2002, 35, 1911–1920 CrossRef CAS.
- A. Campbell, P. Taylor, O. J. Cayre and V. N. Paunov, Chem. Commun., 2004, 2378–2379 RSC.
- J. P. Schillemans, F. M. Flesch, W. E. Hennink and C. F. van Nostrum, Macromolecules, 2006, 39, 5885–5890 CrossRef CAS.
- W. Wu, D. E. Vanderwall, S. M. Lui, X.-J. Tang, C. J. Turner, J. W. Kozarich and J. Stubbe, J. Am. Chem. Soc., 1996, 118, 1268–1280 CrossRef CAS.
- N. Dave and J. Liu, ACS Nano, 2011, 5, 1304–1312 CrossRef CAS.
- S. p. Mornet, O. Lambert, E. Duguet and A. Brisson, Nano Lett., 2004, 5, 281–285 CrossRef.
- J. Wang, A. D. Gonzalez and V. M. Ugaz, Adv. Mater., 2008, 20, 4482–4489 CrossRef CAS.
- A. Baeissa, N. Moghimi and J. Liu, RSC Adv., 2012, 2, 2981–2987 RSC.
- G. F. White, K. I. Racher, A. Lipski, F. R. Hallett and J. M. Wood, Biochim. Biophys. Acta, Biomembr., 2000, 1468, 175–186 CrossRef CAS.
- H. Brochu and P. Vermette, Langmuir, 2008, 24, 2009–2014 CrossRef CAS.
- E. Evans and W. Rawicz, Phys. Rev. Lett., 1990, 64, 2094 CrossRef CAS.
- K. Allen Rodowicz, H. Francisco and B. Layton, Chem. Phys. Lipids, 2010, 163, 787–793 CrossRef CAS.
- C. A. Keller and B. Kasemo, Biophys. J., 1998, 75, 1397–1402 CrossRef CAS.
- R. P. Richter and A. R. Brisson, Biophys. J., 2005, 88, 3422–3433 CrossRef CAS.
| This journal is © The Royal Society of Chemistry 2013 |
