 Open Access Article
Steady state rheological behaviour of multi-component magnetic suspensions†
Laura
Rodríguez-Arco
a,
Modesto T.
López-López
*a,
Pavel
Kuzhir
b and
Juan D. G.
Durán
a
aDepartamento de Física Aplicada, Facultad de Ciencias, Universidad de Granada, Avda. Fuentenueva s/n, 18071 Granada, Spain. E-mail: modesto@ugr.es; Fax: +34 958 243214; Tel: +34 958 240018
bCNRS, U.M.R. 7336, Laboratoire de Physique de la Matière Condensée, Université de Nice, Parc Valrose, 06108 Nice, France. E-mail: kuzhir@unice.fr; Fax: +33 492076536; Tel: +33 492076313
First published on 14th May 2013
Abstract
In this paper, we study the rheological behaviour (in the absence of a magnetic field and upon its application) of multi-component magnetic suspensions that consist of a mixture of magnetic (iron) and non-magnetic (PMMA) particles dispersed in a liquid carrier. These suspensions exhibit considerably higher viscosity and yield stress in the absence of a magnetic field than single-component suspensions of the same solid fraction, as a consequence of the adsorption of the iron particles on the PMMA ones. The adsorbed layer of iron particles on the PMMA ones is observed through optical microscopy of dilute samples and confirmed by attenuated total reflectance. Microscopic observations also show that the resulting non-magnetic-core–magnetic-shell composites move upon magnetic field application and aggregate into particle structures aligned with the applied field. These structures, which consist of both types of particles, give rise to high values of the static and dynamic yield stresses upon field application. Actually, both quantities are much higher than those of a suspension with the same volume fraction of magnetic particles, and increase when the amount of non-magnetic ones increases. These trends are adequately predicted by a theoretical model that considers that the main contribution to the yield stress is the change of the suspension magnetic permeability when particle chains are deformed by the shear.
1 Introduction
Multi-component fluid systems have attracted much attention in the last few decades, especially in the search for new tailor-made smart materials, whose properties can be controlled by changing the nature of either the different phases dispersed in the continuous matrix, or of the continuous matrix. The combination of different materials turns out to be very interesting because each of them provides a specific feature to the whole blend. This is the case, for example, for multi-component mixtures of surfactants, whose interfacial properties are different from those of a solution involving a single one.1 Furthermore, the mixture of different materials may lead to the enhancement of the properties of the whole blend with respect to those of the single components. An example of this synergic effect is the increase of both the yield stress and the current density for bidisperse electrorheological fluids that consist of large particles and a small fraction of fine particles dispersed in a liquid carrier.2 Similarly, magnetic microparticles have been dispersed in a ferrofluid. In this case, the stability against aggregation and redispersion was better than that of a suspension constituted only by the magnetic microparticles.3 Nevertheless, the inclusion of different phases is interesting not only because of the improvement of the technologically related properties, but also from a fundamental point of view. As an example, the existence of magnetic field-induced repulsion (instead of attraction) between magnetic microparticles dispersed in a ferrofluid was recently reported, even though their magnetic moments were in line.4 This surprising phenomenon is due to the phase condensation of the ferrofluid carrier near the micron-sized particles, and as a result, the interactions between the microparticles could be controlled just by changing the concentration of the nanoparticles in the ferrofluid.5The control of the interaction between the dispersed particles in suspensions is very important in fields such as self-assembly, which has actually taken advantage of multi-component systems too. For example, Lee et al.6 have theoretically proved that the inclusion of bidisperse systems of spheres in block copolymers allows control of both the morphology of the polymer matrix and the spatial organization of the spheres. Something similar has been found by Cho et al. who prepared colloidal aggregates of nano- and micron-sized particles in water-in-oil emulsion droplets.7 However, self-assembled structures can be obtained, not only by the use of different particle sizes, but also by the combination of particles of different nature. In this sense, the work recently published in Nature8 which reports the formation of symmetric magnetic superstructures due to the interactions between diamagnetic and paramagnetic particles dispersed in a ferrofluid is of particular interest.
The broad range of commercially available diamagnetic (non-magnetic) particles has resulted in other attempts to include them in the formulation of magnetic suspensions.9 For example, inverse ferrofluids consist of micron-sized non-magnetic particles dispersed in a ferrofluid.10–12 Similarly, López-López et al. prepared suspensions that consisted of iron microparticles stabilized by the addition of organoclay particles. They found that these suspensions developed, at low magnetic fields (up to H ≈ 10 kA m−1), higher yield stresses than suspensions of just magnetic (iron) microparticles (also known as magnetorheological (MR) fluids). The explanation given by the authors to this behaviour was a combined effect of the field-induced iron chains and a gel formed by the clay particles. The formation of such a gel gave rise to high yield stresses in the absence of a magnetic field too.13 Other authors14–16 have pointed out that the addition of non-magnetic particles to conventional MR fluids led to an enhancement of their field-induced yield stress.
In the present paper, we rigorously study the steady state rheological behaviour of a particular kind of multi-component fluid system both in the absence of a magnetic field and upon its application. More specifically, the studied systems consist of two different particle populations which differ in both their magnetic behaviour and size. As a matter of fact, the dispersed phase is composed of magnetic and non-magnetic microparticles with particle diameters of about 2.3 μm and 10 μm, respectively. The non-magnetic particle volume fraction for the prepared suspensions is varied from 10 to 30 vol%, while the magnetic particle one is kept constant and equal to 10 vol%. The rheological behaviour of samples constituted just by magnetic or non-magnetic particles (i.e. single-component suspensions) is studied for comparison too. As will be shown, in the absence of the field, the multi-component suspensions show higher values of viscosity and yield stress than the single-component ones. This makes it evident that there must be some kind of interaction between both populations of particles, and for this reason, microscopic observations and attenuated total reflectance measurements were performed. The particle structures formed upon field application were also observed by microscopy in order to better understand the rheological behaviour in the presence of external magnetic fields. In the end, a theoretical model for the static yield stress is applied to these suspensions. In order to estimate the theoretical static yield stress, finite element method (FEM) simulations of the suspension magnetic permeability were also required.
2 Experimental
2.1 Materials
Iron and poly(methylmethacrylate) (PMMA) powders were purchased from BASF (HS quality) and Microbeads (Spheromers CA10), respectively. The first one consists of polydisperse spherical particles with a median particle size of d50 = 2.3 μm (particle diameter ranges from 0.5 to 3 μm) and an iron content of 97% (density = 7.5 g cm−3). Its physicochemical properties are reported elsewhere.17 PMMA powder is composed of particles with an average diameter of 9.9 ± 0.4 μm and a purity of 99.5% (density = 1.2 g cm−3). Mineral oil (Sigma-Aldrich) was used as the liquid carrier for all the suspensions; its viscosity at 25 °C is (0.028 ± 0.001) Pa s.2.2 Suspension preparation
First of all, several suspensions of PMMA microparticles were prepared. For this purpose, the desired amounts of the solid powder were dispersed in the liquid carrier and the suspension was stirred both manually and mechanically in order to homogenize it. The volume fraction of PMMA ranged from 20 to 40 vol%. In a similar way, multi-component suspensions constituted by both iron and PMMA microparticles dispersed in mineral oil were prepared. Iron–PMMA volume fractions in mineral oil were as follows: 10/10, 10/20 and 10/30. These samples will be labelled from now on as S1(10![[thin space (1/6-em)]](https://www.rsc.org/images/entities/char_2009.gif) :
:![[thin space (1/6-em)]](https://www.rsc.org/images/entities/char_2009.gif) 10), S2(10
10), S2(10![[thin space (1/6-em)]](https://www.rsc.org/images/entities/char_2009.gif) :
:![[thin space (1/6-em)]](https://www.rsc.org/images/entities/char_2009.gif) 20) and S3(10
20) and S3(10![[thin space (1/6-em)]](https://www.rsc.org/images/entities/char_2009.gif) :
:![[thin space (1/6-em)]](https://www.rsc.org/images/entities/char_2009.gif) 30), respectively. Note that the resulting multi-component suspensions were similar to the PMMA suspensions in which 10 vol% of the PMMA particles (with respect to the total volume) were substituted by the same amount of iron particles – i.e. the solid concentration of the multi-component suspensions ranged from 20 to 40 vol%, as it did in the above-mentioned PMMA suspensions. In addition, suspensions composed of just iron microparticles (10 and 14 vol%) were also prepared for comparison (samples S0(10
30), respectively. Note that the resulting multi-component suspensions were similar to the PMMA suspensions in which 10 vol% of the PMMA particles (with respect to the total volume) were substituted by the same amount of iron particles – i.e. the solid concentration of the multi-component suspensions ranged from 20 to 40 vol%, as it did in the above-mentioned PMMA suspensions. In addition, suspensions composed of just iron microparticles (10 and 14 vol%) were also prepared for comparison (samples S0(10![[thin space (1/6-em)]](https://www.rsc.org/images/entities/char_2009.gif) :
:![[thin space (1/6-em)]](https://www.rsc.org/images/entities/char_2009.gif) 0) and S0b(14
0) and S0b(14![[thin space (1/6-em)]](https://www.rsc.org/images/entities/char_2009.gif) :
:![[thin space (1/6-em)]](https://www.rsc.org/images/entities/char_2009.gif) 0)).
0)).
3 Experimental results
3.1 Steady state rheological measurements in the absence of a magnetic field
The rheological behaviour of the samples in the absence of a magnetic field was firstly studied with the aim of gaining information on the zero-field state of the samples. The rheological characterization (at 25 °C) was performed with a Haake MARS III (Thermo Fisher Scientific, USA) rheometer. The measurement system geometry was a 3.5 cm diameter parallel plate set. The gap between the two plates was kept at 400 μm and the plate surface was rough in order to avoid wall slip. The reported quantities are those at the outer radial edge of the plate. All the samples were well redispersed by hand and by a vortex mixer prior to being placed in the measuring system. Before carrying out each measurement, we subjected the samples to the following protocol: (i) pre-shear: 30 s of 150 s−1 shear rate application; (ii) waiting time: sample at rest for 2 minutes. The reproducibility of the results was checked by performing several repetitions of the measurements; the obtained relative dispersion was always lower than 5%.In order to estimate the yield stress (i.e. the stress above which the suspension flows), we performed steady shear measurements. The so-called dynamic yield stress (related to the complete breakage of the existing structures in the suspension) can be obtained by a linear interpolation of the rheogram (i.e. shear stress, σ, plotted as a function of shear rate, ![[small gamma, Greek, dot above]](https://www.rsc.org/images/entities/i_char_e0a2.gif) ) to zero shear rate. This linear fit is usually performed at relatively high shear rates.18 For this reason, all the samples were first subjected to a linear shear rate ramp (controlled rate, CR, measurements) from 20 to 300 s−1. In these measurements, a particular value of the shear rate was imposed for at least 3 seconds and at most for 30 seconds. Within this time range, if the quotient (Δσ/σ)/Δt was smaller than 0.001 s−1, the measurement at the given shear rate was stopped. In this formula, Δσ is the difference between the highest and the lowest shear stresses at the applied shear rate, and Δt the time during which the shear rate was maintained. In all cases, the average value of the shear stress was the one represented in the rheograms.
) to zero shear rate. This linear fit is usually performed at relatively high shear rates.18 For this reason, all the samples were first subjected to a linear shear rate ramp (controlled rate, CR, measurements) from 20 to 300 s−1. In these measurements, a particular value of the shear rate was imposed for at least 3 seconds and at most for 30 seconds. Within this time range, if the quotient (Δσ/σ)/Δt was smaller than 0.001 s−1, the measurement at the given shear rate was stopped. In this formula, Δσ is the difference between the highest and the lowest shear stresses at the applied shear rate, and Δt the time during which the shear rate was maintained. In all cases, the average value of the shear stress was the one represented in the rheograms.
The static yield stress (which corresponds to the breakage of the structures in their weakest point and therefore to the onset of the flow) is usually quantified by extrapolating the value of the shear stress in the low shear rate pseudoplateau (around 0.1 s−1) to the zero shear rate in double logarithmic scale rheograms.18 For this reason, two kinds of measurements were performed to estimate it. First of all, the samples were subjected to a logarithmic stress ramp which allowed us to delimit the range of stresses in which the static yield stress could be found. Afterwards, we applied a linear stress ramp within the previously delimited range (controlled stress, CS, measurements). The measurement duration was set in a similar way to that described previously for CR measurements, but this time the quotient (Δ![[small gamma, Greek, dot above]](https://www.rsc.org/images/entities/i_char_e0a2.gif) /
/![[small gamma, Greek, dot above]](https://www.rsc.org/images/entities/i_char_e0a2.gif) )/Δt was employed.
)/Δt was employed.
All these measurements were performed first for the PMMA suspensions and then for the multi-component suspensions. Fig. 1 shows the rheograms obtained in the CR (a) and CS (b) modes for all these samples.
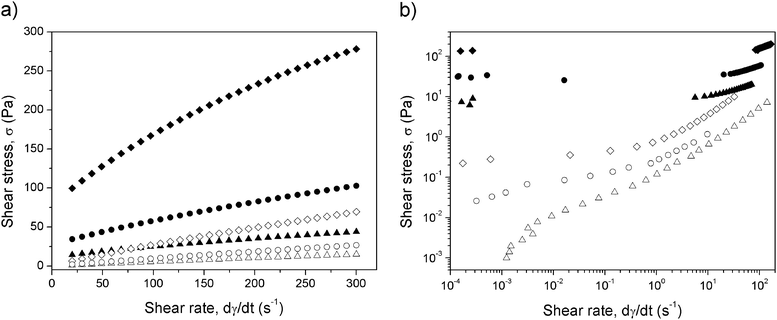 | ||
| Fig. 1 CR (a) and CS (b) rheograms for PMMA suspensions (open symbols) and for multi-component suspensions (full symbols). The different symbols correspond to different total volume fractions: △/▲: 20 vol%; ○/●: 30 vol%; ◇/◆: 40 vol%. Note that in the multi-component suspensions, the volume fraction of iron is 10%. | ||
Concerning PMMA suspensions, as observed in Fig. 1, their dynamic yield stress (intercept of the curves) is almost negligible and their viscosity (slope) is approximately independent of the shear rate. Note that the slope of the curves increases with the particle volume fraction. This reflects an increase of viscosity due to a higher particle content that makes hydrodynamic interactions more important.18 However, a more detailed inspection reveals that the values of the dynamic yield stress of PMMA suspensions are not so negligible, especially for the most concentrated suspension (40 vol% of PMMA) – see Table 1. The non-Newtonian behaviour of the PMMA suspensions is likely related to the existence of some particle interaction different from the hydrodynamic one, which leads to a tendency to aggregate at rest. The existence of particle interactions other than the hydrodynamic one may be checked by comparison of the experimental viscosity of the samples with the theoretical predictions of the Krieger–Dougherty equation:18,19
 | (1) |
![[small gamma, Greek, dot above]](https://www.rsc.org/images/entities/i_char_e0a2.gif) > 200 s−1) are presented in Table 1 for the PMMA suspensions.
> 200 s−1) are presented in Table 1 for the PMMA suspensions.
| Particle volume fraction | Experimental plastic viscosity (Pa s) | Krieger–Dougherty viscosity (Pa s) | Deviation of viscosity from Krieger–Dougherty prediction (%) | Static yield stress (Pa) | Dynamic yield stress (Pa) |
|---|---|---|---|---|---|
| 20% PMMA | 0.05 ± 0.05 | 0.051 | 10 | 0.034 ± 0.009 | 1.17 ± 0.03 |
| 30% PMMA | 0.08 ± 0.05 | 0.078 | 5 | 0.124 ± 0.021 | 2.11 ± 0.08 |
| 40% PMMA | 0.20 ± 0.05 | 0.140 | 47 | 0.39 ± 0.07 | 8.12 ± 0.08 |
| 10% iron | 0.05 ± 0.05 | 0.037 | 23 | 5.59 ± 0.20 | 11.88 ± 0.24 |
| 14% iron | 0.06 ± 0.05 | 0.042 | 32 | 7.9 ± 0.9 | 16.09 ± 0.04 |
| 10% iron, 10% PMMA | 0.09 ± 0.05 | 0.051 | 70 | 9.0 ± 0.4 | 17.95 ± 0.13 |
| 10% iron, 20% PMMA | 0.21 ± 0.05 | 0.078 | 166 | 33.8 ± 1.0 | 40.8 ± 0.3 |
| 10% iron, 30% PMMA | 0.46 ± 0.05 | 0.140 | 228 | 137.9 ± 2.4 | 141.7 ± 1.6 |
From data in this table, it is interesting to note that the deviation from the Krieger–Dougherty equation is quite low for the PMMA suspensions with 20 and 30 vol% solid concentration, while it becomes important for the case of 40 vol%. These results suggest that the non-hydrodynamic interaction must be short-ranged since at high volume fractions the interparticle distance becomes shorter. Given the non-polar nature of the suspending liquid (mineral oil), we expect this interaction to be of van der Waals type.
The most noticeable result evidenced by the data shown in Table 1, however, is the increase of both the viscosity and the yield stress when a fraction of PMMA particles is substituted by iron ones. This effect is not due to an increase of the total volume fraction, since it is the same for every two pairs of suspensions. In fact, it is quite surprising since, according to Barnes et al.,20 when particles of two different sizes are mixed, the viscosity of the resulting mixture is usually lower than for suspensions with the same volume fraction of monosized particles, as a consequence of the fact that small particles pack into the interstices between the large ones.20 However, in our particular case, the effect is exactly the opposite: the viscosity increases in the case of the multi-component suspensions. In addition, it is observed that the transition to the flow regime (characterized by non-negligible shear rate values) for the multi-component suspensions takes place in a much more abrupt way (intermediate plateau, see Fig. 1b), as is the case for flocculated suspensions. Therefore, these results seem to indicate that there must be rather strong interactions between the dispersed particles in the multi-component suspensions.
Similar results (increase of yield stress and viscosity) were reported for suspensions constituted by a mixture of organoclay and iron particles in kerosene.13 The formation of a clay network (gel) that entrapped the iron particles was the reason given in ref. 13 for the high values of the yield stress in the case of organoclay/iron suspensions. However, the possibility of gel formation can be rejected in the case of PMMA particles, as evidenced by the fact that the static yield stress is almost negligible for single-component suspensions of PMMA particles. In order to further investigate particle interactions in the absence of the applied field and their effects, the rheological behaviour at zero-field of a suspension of 10 vol% of iron particles (sample S0(10![[thin space (1/6-em)]](https://www.rsc.org/images/entities/char_2009.gif) :
:![[thin space (1/6-em)]](https://www.rsc.org/images/entities/char_2009.gif) 0)) is also studied. The values of viscosity and yield stress calculated from the rheograms (not shown here for brevity) are presented in Table 1. First of all, it is clear from these data that both the dynamic and static yield stresses of sample S0(10
0)) is also studied. The values of viscosity and yield stress calculated from the rheograms (not shown here for brevity) are presented in Table 1. First of all, it is clear from these data that both the dynamic and static yield stresses of sample S0(10![[thin space (1/6-em)]](https://www.rsc.org/images/entities/char_2009.gif) :
:![[thin space (1/6-em)]](https://www.rsc.org/images/entities/char_2009.gif) 0) are not negligible. This result suggests that the suspension may be quite flocculated. This is not surprising, given that the magnetic interaction between iron microparticles is relatively important, even in the absence of external magnetic fields, due to their remnant magnetization (note that due to their micrometric size, these particles are multi-domain from the magnetic viewpoint). In addition to magnetic attraction, van der Waals interaction between the dispersed particles must be fairly important too.
0) are not negligible. This result suggests that the suspension may be quite flocculated. This is not surprising, given that the magnetic interaction between iron microparticles is relatively important, even in the absence of external magnetic fields, due to their remnant magnetization (note that due to their micrometric size, these particles are multi-domain from the magnetic viewpoint). In addition to magnetic attraction, van der Waals interaction between the dispersed particles must be fairly important too.
Note that although the yield stress for sample S0(10![[thin space (1/6-em)]](https://www.rsc.org/images/entities/char_2009.gif) :
:![[thin space (1/6-em)]](https://www.rsc.org/images/entities/char_2009.gif) 0) is quite high despite its low volume fraction, the deviation of its viscosity from the prediction of the Krieger–Dougherty equation is not so high. This can be explained because the experimental viscosity is calculated by a linear fit of the high shear rate points of the rheogram (
0) is quite high despite its low volume fraction, the deviation of its viscosity from the prediction of the Krieger–Dougherty equation is not so high. This can be explained because the experimental viscosity is calculated by a linear fit of the high shear rate points of the rheogram (![[small gamma, Greek, dot above]](https://www.rsc.org/images/entities/i_char_e0a2.gif) > 200 s−1). For these values of the shear rate, the forces of attraction between iron particles due to their remnant magnetization and van der Waals interaction are negligible as compared with the hydrodynamic interactions.
> 200 s−1). For these values of the shear rate, the forces of attraction between iron particles due to their remnant magnetization and van der Waals interaction are negligible as compared with the hydrodynamic interactions.
Let us note at this point that the rheological parameters (i.e. yield stress, viscosity) of sample S0(10![[thin space (1/6-em)]](https://www.rsc.org/images/entities/char_2009.gif) :
:![[thin space (1/6-em)]](https://www.rsc.org/images/entities/char_2009.gif) 0) are always lower than those of the multi-component magnetic suspensions. However, there is something that has not been taken into account, namely the relative available space for the movement of the magnetic particles, which is higher in sample S0(10
0) are always lower than those of the multi-component magnetic suspensions. However, there is something that has not been taken into account, namely the relative available space for the movement of the magnetic particles, which is higher in sample S0(10![[thin space (1/6-em)]](https://www.rsc.org/images/entities/char_2009.gif) :
:![[thin space (1/6-em)]](https://www.rsc.org/images/entities/char_2009.gif) 0) than in the case of the multi-component suspensions. For this reason, and to discard that it is not the lack of available physical space that causes the increase of the yield stress and viscosity in multi-component suspensions, we prepared a suspension of 14 vol% of iron microparticles. In this suspension, the available space for the magnetic particles is the same as in sample S3(10
0) than in the case of the multi-component suspensions. For this reason, and to discard that it is not the lack of available physical space that causes the increase of the yield stress and viscosity in multi-component suspensions, we prepared a suspension of 14 vol% of iron microparticles. In this suspension, the available space for the magnetic particles is the same as in sample S3(10![[thin space (1/6-em)]](https://www.rsc.org/images/entities/char_2009.gif) :
:![[thin space (1/6-em)]](https://www.rsc.org/images/entities/char_2009.gif) 30). Despite this, and as observed in Table 1, the rheological parameters of the 14 vol% sample are closer to sample S0(10
30). Despite this, and as observed in Table 1, the rheological parameters of the 14 vol% sample are closer to sample S0(10![[thin space (1/6-em)]](https://www.rsc.org/images/entities/char_2009.gif) :
:![[thin space (1/6-em)]](https://www.rsc.org/images/entities/char_2009.gif) 0) than to sample S3(10
0) than to sample S3(10![[thin space (1/6-em)]](https://www.rsc.org/images/entities/char_2009.gif) :
:![[thin space (1/6-em)]](https://www.rsc.org/images/entities/char_2009.gif) 30). Therefore, the high values of the yield stress and the viscosity at zero-field in the multi-component magnetic suspensions are not related exclusively to the non-magnetic particles or to the magnetic ones, but to the combination of both of them. Therefore, there must be some interaction between the two populations of particles, and the purpose of the next section is to find out its nature.
30). Therefore, the high values of the yield stress and the viscosity at zero-field in the multi-component magnetic suspensions are not related exclusively to the non-magnetic particles or to the magnetic ones, but to the combination of both of them. Therefore, there must be some interaction between the two populations of particles, and the purpose of the next section is to find out its nature.
3.2 Microscopy in the absence of the magnetic field and attenuated total reflectance (ATR) observations
With the aim of investigating whether the two populations of particles in the multi-component suspensions indeed interact, microscopic observations of the dispersed particles in dilutions of the original suspensions were obtained by using a Haake MARS III Rheoscope Module (Thermo Fisher Scientific, USA). It was necessary to dilute the concentrated samples (by pouring aliquots of them into appropriate amounts of mineral oil) in order to let the light pass through the sample. Fig. 2 shows a photograph of a 1![[thin space (1/6-em)]](https://www.rsc.org/images/entities/char_2009.gif) :
:![[thin space (1/6-em)]](https://www.rsc.org/images/entities/char_2009.gif) 5 dilution of sample S1(10
5 dilution of sample S1(10![[thin space (1/6-em)]](https://www.rsc.org/images/entities/char_2009.gif) :
:![[thin space (1/6-em)]](https://www.rsc.org/images/entities/char_2009.gif) 10). Similar results were obtained for other dilution ratios and/or original samples.
10). Similar results were obtained for other dilution ratios and/or original samples.
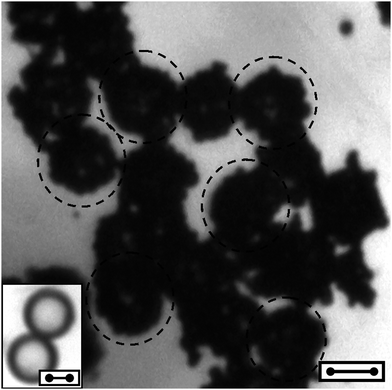 | ||
Fig. 2 Microscopic image of a dilute iron–PMMA sample (bar length: 10 microns). The dilution ratio is 1![[thin space (1/6-em)]](https://www.rsc.org/images/entities/char_2009.gif) : :![[thin space (1/6-em)]](https://www.rsc.org/images/entities/char_2009.gif) 5 as compared to the original suspension S1(10 5 as compared to the original suspension S1(10![[thin space (1/6-em)]](https://www.rsc.org/images/entities/char_2009.gif) : :![[thin space (1/6-em)]](https://www.rsc.org/images/entities/char_2009.gif) 10). Note that there are several PMMA particles almost completely coated by iron ones (some of them have been highlighted by dashed circumferences). Inset: microscopic image of two bare PMMA particles for comparison (bar length: 5 microns). 10). Note that there are several PMMA particles almost completely coated by iron ones (some of them have been highlighted by dashed circumferences). Inset: microscopic image of two bare PMMA particles for comparison (bar length: 5 microns). | ||
It is seen that in the absence of the magnetic field, PMMA particles (some of which are highlighted by a dashed line in Fig. 2) are almost completely coated by a shell of iron ones. This makes it evident that there are interactions between both populations of particles. These interactions lead to some kind of non-magnetic-core–magnetic-shell composites (as seen in Fig. 2), which are likely responsible for the increase of both the viscosity and the yield stress in the absence of the field. The affinity between PMMA and iron is not surprising, since PMMA has been previously used to stabilize colloidal iron particles.21–25 For example, Guo et al.22 described the preparation of ferromagnetic composites consisting of an iron core and a PMMA shell.
With the purpose of gaining further information on the interaction between the magnetic and the non-magnetic particles, we performed attenuated total reflectance (ATR) observations with an infrared spectrometer JASCO 6200 (Japan). The spectrum of sample S3(10![[thin space (1/6-em)]](https://www.rsc.org/images/entities/char_2009.gif) :
:![[thin space (1/6-em)]](https://www.rsc.org/images/entities/char_2009.gif) 30) and the one of a sample with the same volume fraction (30%) of PMMA are shown in Fig. 3 as an example.
30) and the one of a sample with the same volume fraction (30%) of PMMA are shown in Fig. 3 as an example.
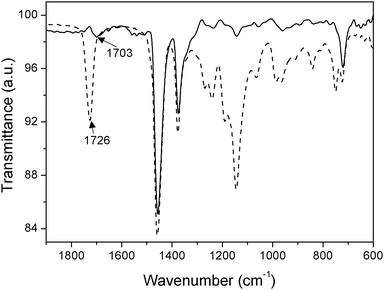 | ||
Fig. 3 ATR spectra of a sample consisting of 30 vol% of PMMA dispersed in mineral oil (dashed line) and of sample S3(10![[thin space (1/6-em)]](https://www.rsc.org/images/entities/char_2009.gif) : :![[thin space (1/6-em)]](https://www.rsc.org/images/entities/char_2009.gif) 30) (solid line). 30) (solid line). | ||
The peaks at around 1452, 1375 and 720 cm−1 in Fig. 3 correspond to mineral oil. The peaks at 1145 and 1191 cm−1 are related to C–H deformations, and the ones at 1241 and 1271 cm−1 to C–C–O stretch coupled with C–O stretch.22 Other characteristic absorption vibration peaks of PMMA appear at 838, 984 and 1052 cm−1. The characteristic stretching band of the carbonyl group (C![[double bond, length as m-dash]](https://www.rsc.org/images/entities/char_e001.gif) O) of PMMA appears at 1726 cm−1 for the 30 vol% PMMA suspension. However, in the case of sample S3(10
O) of PMMA appears at 1726 cm−1 for the 30 vol% PMMA suspension. However, in the case of sample S3(10![[thin space (1/6-em)]](https://www.rsc.org/images/entities/char_2009.gif) :
:![[thin space (1/6-em)]](https://www.rsc.org/images/entities/char_2009.gif) 30), it is displaced to a lower wavenumber (1703 cm−1). Such a change is due to the interaction between the surface of PMMA and the iron particles. More specifically, it has been reported that when the carbonyl group of carboxylic acids and derivatives is complexed by dative coordination, its characteristic stretching band is shifted to lower frequencies (i.e. lower wavenumbers).22,24,26–29 For example, a shift of the carbonyl stretching band from 1732 cm−1 (pure PMMA) to 1706 cm−1 (PMMA–stabilized iron nanoparticles) was taken as a proof of the existence of chemical bonding between PMMA and iron nanoparticles in a recent work by Guo et al.22 The formation of coordination compounds between organic ligands and the surface sites of iron (or iron oxides) has also been widely studied.30
30), it is displaced to a lower wavenumber (1703 cm−1). Such a change is due to the interaction between the surface of PMMA and the iron particles. More specifically, it has been reported that when the carbonyl group of carboxylic acids and derivatives is complexed by dative coordination, its characteristic stretching band is shifted to lower frequencies (i.e. lower wavenumbers).22,24,26–29 For example, a shift of the carbonyl stretching band from 1732 cm−1 (pure PMMA) to 1706 cm−1 (PMMA–stabilized iron nanoparticles) was taken as a proof of the existence of chemical bonding between PMMA and iron nanoparticles in a recent work by Guo et al.22 The formation of coordination compounds between organic ligands and the surface sites of iron (or iron oxides) has also been widely studied.30
3.3 Steady state rheological measurements upon magnetic field application
In this section, the rheological behaviour of the samples in the presence of external magnetic fields is studied. These measurements were performed similarly to those of Section 3.1, but this time, a homogeneous magnetic field was applied in the vertical direction (that is, perpendicular to the rheometer plates) by means of a coil. The field was applied from the beginning of the waiting time. Fig. 4 shows the rheograms obtained in the CR (a and c) and CS (b and d) modes at different values of the internal magnetic field, H, for samples S0(10![[thin space (1/6-em)]](https://www.rsc.org/images/entities/char_2009.gif) :
:![[thin space (1/6-em)]](https://www.rsc.org/images/entities/char_2009.gif) 0) and S2(10
0) and S2(10![[thin space (1/6-em)]](https://www.rsc.org/images/entities/char_2009.gif) :
:![[thin space (1/6-em)]](https://www.rsc.org/images/entities/char_2009.gif) 20) as an example. Note that the internal magnetic field was calculated as H0/μr, where H0 is the applied magnetic field and μr the relative magnetic permeability of the sample. H0 was experimentally determined with the help of a gaussmeter, whereas the values of μr for each applied magnetic field were obtained by a Squid Quantum Design MPMS XL magnetometer.
20) as an example. Note that the internal magnetic field was calculated as H0/μr, where H0 is the applied magnetic field and μr the relative magnetic permeability of the sample. H0 was experimentally determined with the help of a gaussmeter, whereas the values of μr for each applied magnetic field were obtained by a Squid Quantum Design MPMS XL magnetometer.
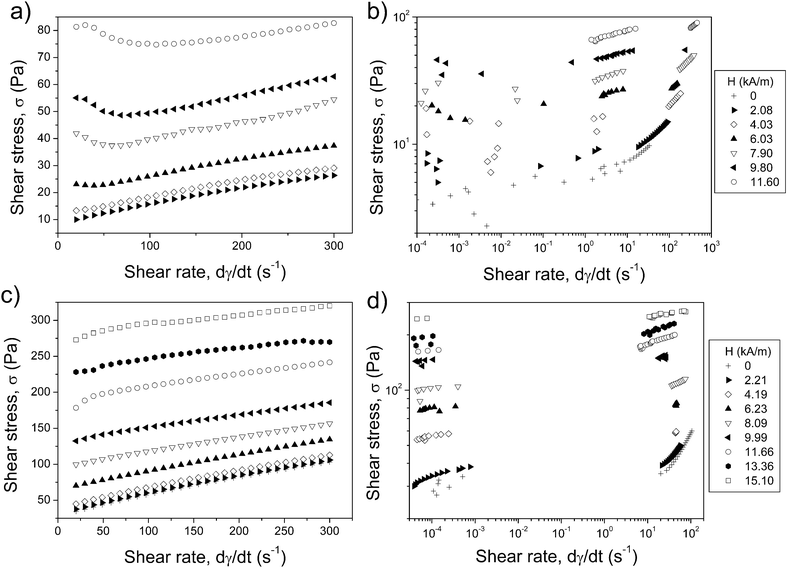 | ||
Fig. 4 CR (a and c) and CS (b and d) rheograms for samples S0(10![[thin space (1/6-em)]](https://www.rsc.org/images/entities/char_2009.gif) : :![[thin space (1/6-em)]](https://www.rsc.org/images/entities/char_2009.gif) 0) (a and b) and S2(10 0) (a and b) and S2(10![[thin space (1/6-em)]](https://www.rsc.org/images/entities/char_2009.gif) : :![[thin space (1/6-em)]](https://www.rsc.org/images/entities/char_2009.gif) 20) (c and d). The different curves correspond to different values of the internal magnetic field. 20) (c and d). The different curves correspond to different values of the internal magnetic field. | ||
With reference to the results in Fig. 4, it is seen that there is a clear MR effect for both samples, that is, an increase of the shear stress when the magnetic field strength is increased for a particular shear rate. Therefore, our multi-component suspensions respond to the magnetic field in a similar way to single-component (iron) MR suspensions. However, the MR effect is much stronger for sample S2(10![[thin space (1/6-em)]](https://www.rsc.org/images/entities/char_2009.gif) :
:![[thin space (1/6-em)]](https://www.rsc.org/images/entities/char_2009.gif) 20) than for sample S0(10
20) than for sample S0(10![[thin space (1/6-em)]](https://www.rsc.org/images/entities/char_2009.gif) :
:![[thin space (1/6-em)]](https://www.rsc.org/images/entities/char_2009.gif) 0), as evidenced by the fact that the shear stress at similar internal magnetic fields is higher for the former, despite the same amount of magnetic particles contained in both suspensions. This is in good agreement with the results presented in ref. 14–16. From Fig. 4, it is also interesting to highlight the yielding behaviour of these suspensions, characterized by the appearance of a yield stress. Such behaviour is especially noticeable in the CS rheograms (Fig. 4b and d), for which an abrupt transition from negligible shear rate values to the flow regime appears. Note that this abrupt transition is not observed in the CR measurements, since in this case, the shear rate is imposed stepwise by the rheometer. In order to gain more information on the MR response of the samples, both the dynamic and static yield stresses were obtained from curves like those shown in Fig. 4. In Fig. 5, the increments of both quantities with respect to their values in the absence of applied field are plotted against the internal magnetic field for all the samples.
0), as evidenced by the fact that the shear stress at similar internal magnetic fields is higher for the former, despite the same amount of magnetic particles contained in both suspensions. This is in good agreement with the results presented in ref. 14–16. From Fig. 4, it is also interesting to highlight the yielding behaviour of these suspensions, characterized by the appearance of a yield stress. Such behaviour is especially noticeable in the CS rheograms (Fig. 4b and d), for which an abrupt transition from negligible shear rate values to the flow regime appears. Note that this abrupt transition is not observed in the CR measurements, since in this case, the shear rate is imposed stepwise by the rheometer. In order to gain more information on the MR response of the samples, both the dynamic and static yield stresses were obtained from curves like those shown in Fig. 4. In Fig. 5, the increments of both quantities with respect to their values in the absence of applied field are plotted against the internal magnetic field for all the samples.
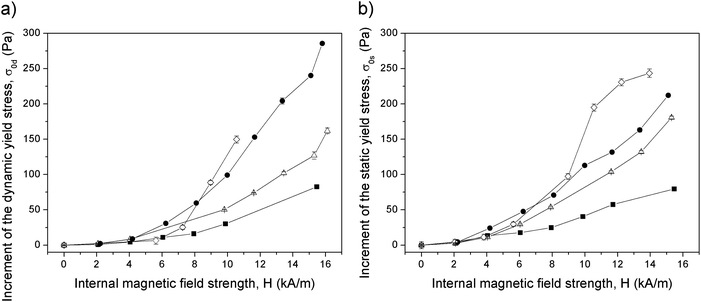 | ||
Fig. 5 Magnetic field dependence of the dynamic (a) and static (b) yield stress increments for all the samples. ■: S0(10![[thin space (1/6-em)]](https://www.rsc.org/images/entities/char_2009.gif) : :![[thin space (1/6-em)]](https://www.rsc.org/images/entities/char_2009.gif) 0); △: S1(10 0); △: S1(10![[thin space (1/6-em)]](https://www.rsc.org/images/entities/char_2009.gif) : :![[thin space (1/6-em)]](https://www.rsc.org/images/entities/char_2009.gif) 10); ●: S2(10 10); ●: S2(10![[thin space (1/6-em)]](https://www.rsc.org/images/entities/char_2009.gif) : :![[thin space (1/6-em)]](https://www.rsc.org/images/entities/char_2009.gif) 20); ◇: S3(10 20); ◇: S3(10![[thin space (1/6-em)]](https://www.rsc.org/images/entities/char_2009.gif) : :![[thin space (1/6-em)]](https://www.rsc.org/images/entities/char_2009.gif) 30). Solid lines represent guides for the eye. 30). Solid lines represent guides for the eye. | ||
As observed in Fig. 5, both the static and dynamic yield stress increments increase with the magnetic field for all the samples, as is usually the case with MR fluids. Moreover, the static yield stress is, in general, lower than the dynamic yield stress. Since the static and dynamic yield stresses are related, respectively, to the stresses needed to start the flow and to break all the structures in the suspension, it is logical that the first one is slightly lower than the latter.
Nevertheless, what seems more interesting is that the sample with the lowest values of the yield stress is the one without PMMA particles. In fact, both the dynamic and the static yield stresses increase with the concentration of non-magnetic particles, with the exception of sample S3(10![[thin space (1/6-em)]](https://www.rsc.org/images/entities/char_2009.gif) :
:![[thin space (1/6-em)]](https://www.rsc.org/images/entities/char_2009.gif) 30), which exhibits quite an irregular behaviour, since at low internal fields its yield stress is lower than the one of sample S2(10
30), which exhibits quite an irregular behaviour, since at low internal fields its yield stress is lower than the one of sample S2(10![[thin space (1/6-em)]](https://www.rsc.org/images/entities/char_2009.gif) :
:![[thin space (1/6-em)]](https://www.rsc.org/images/entities/char_2009.gif) 20), while this behaviour reverses at higher internal magnetic fields.
20), while this behaviour reverses at higher internal magnetic fields.
3.4 Microscopy under the magnetic field
Microscopic observations of dilutions of the multi-component suspensions under the magnetic field were performed in order to examine the field-induced particle chaining. The observations were carried out by placing a Haake MARS III Rheoscope Module between two Helmholtz coils that were used for the application of a magnetic field parallel to the surfaces that confined the sample. Note that the magnetic field was homogeneous near the middle of the common axis of the coils, where the samples were placed for observation (variation of the magnetic induction of less than 1%). The magnetic field was raised stepwise until the maximum field applied by the coils, 9.8 kA m−1, was reached. The original samples were diluted as described in Section 3.2.The sets of photographs shown in Fig. 6 are characteristic of the observed particle behaviour in the dilute multi-component suspensions upon field application – see also Video 1 of ESI.† Let us first focus on the photographs of Fig. 6a–d, which correspond to a time sequence of the same region. In the absence of the magnetic field (Fig. 6a), PMMA particles appear coated by a thick shell of iron particles, in agreement with the results in Section 3.2. As seen in Fig. 6b–d, when the magnetic field is switched on, the iron–PMMA composites begin to move and show a tendency to form aggregates orientated in the field direction. This is due to the adsorbed shell of iron particles, which reacts to the application of the magnetic field. The result is the formation of field-induced particle structures constituted by non-magnetic-core–magnetic-shell composites. Fig. 6e–h show the approximation of two of those composites upon field application.
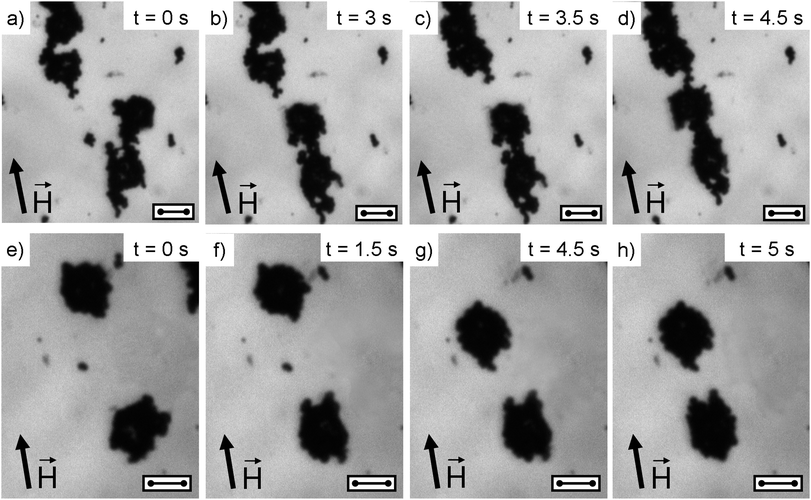 | ||
Fig. 6 Sets of photographs for dilute iron–PMMA samples. The dilution ratio as compared to the original suspension S1(10![[thin space (1/6-em)]](https://www.rsc.org/images/entities/char_2009.gif) : :![[thin space (1/6-em)]](https://www.rsc.org/images/entities/char_2009.gif) 10) is 1 10) is 1![[thin space (1/6-em)]](https://www.rsc.org/images/entities/char_2009.gif) : :![[thin space (1/6-em)]](https://www.rsc.org/images/entities/char_2009.gif) 25. (a–d) and (e–h) present observations of different aliquots. (a) and (e) were taken prior to the application of the magnetic field, while the rest of them correspond to different moments (indicated in seconds in the photographs) after turning on a magnetic field of 9.8 kA m−1 strength. The arrows indicate the direction of the applied magnetic field. 25. (a–d) and (e–h) present observations of different aliquots. (a) and (e) were taken prior to the application of the magnetic field, while the rest of them correspond to different moments (indicated in seconds in the photographs) after turning on a magnetic field of 9.8 kA m−1 strength. The arrows indicate the direction of the applied magnetic field. | ||
In view of these results, it seems that the enhancement of the MR response of the multi-component suspensions could be related to the non-magnetic-core–magnetic-shell nature of the iron–PMMA composites. From classic magnetism, it is known that hollow magnetisable spheres have a higher magnetic moment than the solid, continuous ones with the same amount of magnetic material. Based on the analytical solution of the magnetostatic problem,31,32 it is easy to show that, in the limit of high magnetic permeability, μr ≫ 1, the magnetic moment of an isolated hollow sphere, mh, is approximately equal to that of a full sphere, mf, divided by the volume fraction ϕmag, of the magnetic material in the hollow sphere: mh = mf/ϕmag. This indicates that thinner shells contribute to a stronger magnetic response of the suspension. Therefore, we expect a similar relationship for the magnetic susceptibility of a suspension of non-magnetic-core–magnetic-shell particles. In our case, the thickness of the iron shell around the PMMA particles should progressively decrease with increasing concentrations of PMMA particles at a constant volume fraction of the iron ones. This qualitatively explains the increase of the magnetic (and therefore MR) response of the suspension with the volume fraction of non-magnetic particles. However, this analysis is only valid for non-structured, isotropic and very dilute suspensions. Numerical simulations by finite element methods (FEM) are required for a more precise comparison of the strongly structured concentrated suspensions. This is the purpose of the next section.
4 Theory
In this section, the static yield stress of the suspensions and its increase when PMMA and iron particles are dispersed together are estimated by the use of a theoretical model first developed to study the static yield stress of concentrated suspensions of multi-domain magnetic particles confined between two parallel surfaces.33 In this model, the magnetically induced particle clusters are considered to be body-centred tetragonal (BCT) structures, with a central particle chain surrounded by four peripheral ones shifted vertically by a particle radius (see Fig. 7). These structures have proved to be the most favourable from the energetic viewpoint.34 Besides, they have been previously observed by laser diffraction in electrorheological fluids – the electric counterparts of magnetorheological suspensions.35 At zero strain, the neighboring particles of a chain are in contact, but when sheared, the structure is stretched along its major axis and the particles of the central chain are separated from each other (at a distance given by an affine deformation). In addition, the particles belonging to the peripheral chains are pulled inside the cluster so that they keep contact with the central chain, as depicted in Fig. 7. Note that this structure is expected to be mechanically stable on the experimental time scale, especially when compared to the single chain structures used in some traditional models (for more details, see discussion in ref. 33).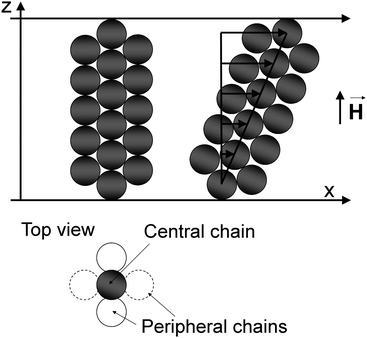 | ||
| Fig. 7 BCT structures considered in the model for the static yield stress presented in ref. 33. Left: structure at rest; right: structure upon shear; down: top view of the structure. | ||
The structures are supposed to be always stuck to both the upper and the lower plates of the rheometer, since highly rough surfaces were employed in order to avoid wall slip. When the upper plate is displaced by a distance Δx, a strain of magnitude γ = Δx/h is applied to the structure (h is the gap between the plates). The structure is homogeneously deformed until its failure. The deformation of the BCT structures of Fig. 7 occurs in two ways: (i) they are tilted when they are pulled by the upper plate. As a consequence, a restoring magnetic torque that tends to align them back to the external magnetic field appears; (ii) the BCT-chains are stretched and extended along their major axis, and their constituent particles are separated from each other, giving rise to interparticle gaps and restoring forces along the main axis of the structure (see Fig. 7). Under homogeneous deformation, the main axes of magnetization of the suspension coincide with the axes of the BCT structure, and therefore, when a reference frame linked to the structure is considered, the magnetic permeability tensor is diagonal, and only has two dissimilar components: μ‖ and μ⊥. These two components correspond to the major and minor axes of the structure and are referred to as longitudinal and transversal magnetic permeability, respectively.
In the limit of particles with high magnetic permeability, the theoretical static yield stress can be calculated by the following equation according to ref. 33:
 | (2) |
 | (3) |
 , where a is the particle radius. At the same time, the particles of the peripheral chains are approached in such a way that there is no fracture of the structures. Since for stress calculations we only need the diagonal components of the magnetic permeability tensor, μ‖ and μ⊥, we can consider only two directions of the magnetic field: longitudinal (Fig. 8a) and transverse (Fig. 8c) with respect to the main axis of the BCT cluster. The applied boundary conditions are specified in the caption of Fig. 8.
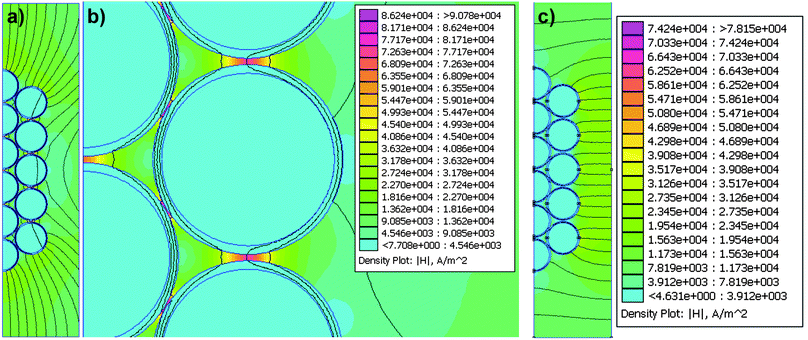 | ||
Fig. 8 Magnetic field intensity distribution in the unit cells for FEMM simulation of sample S3(10![[thin space (1/6-em)]](https://www.rsc.org/images/entities/char_2009.gif) : :![[thin space (1/6-em)]](https://www.rsc.org/images/entities/char_2009.gif) 30). Two directions of the magnetic field are considered for the estimation of the magnetic permeability tensor components: longitudinal (a) and transverse (c). (b) is a magnification of (a) where the enhancement of the field in the interparticle gaps is clearly observed. Boundary conditions are as follows: (a) left boundary Ψ = 0 (plane of symmetry); right boundary (1/μ0)∂Ψ/∂n = H = 10 kA m−1 (mean field in the suspension); upper and lower boundaries ∂Ψ/∂n = 0 (the magnetic field is longitudinal far from the clusters); (c) left and right boundaries ∂Ψ/∂n = 0 (the magnetic field is perpendicular due to symmetry reasons); upper and lower boundaries (1/μ0)∂Ψ/∂n = H = ±10 kA m−1. 30). Two directions of the magnetic field are considered for the estimation of the magnetic permeability tensor components: longitudinal (a) and transverse (c). (b) is a magnification of (a) where the enhancement of the field in the interparticle gaps is clearly observed. Boundary conditions are as follows: (a) left boundary Ψ = 0 (plane of symmetry); right boundary (1/μ0)∂Ψ/∂n = H = 10 kA m−1 (mean field in the suspension); upper and lower boundaries ∂Ψ/∂n = 0 (the magnetic field is longitudinal far from the clusters); (c) left and right boundaries ∂Ψ/∂n = 0 (the magnetic field is perpendicular due to symmetry reasons); upper and lower boundaries (1/μ0)∂Ψ/∂n = H = ±10 kA m−1. | ||
The simulations were performed for two different magnetically induced structures: (i) of just iron particles (sample S0(10![[thin space (1/6-em)]](https://www.rsc.org/images/entities/char_2009.gif) :
:![[thin space (1/6-em)]](https://www.rsc.org/images/entities/char_2009.gif) 0)) and (ii) of PMMA particles coated by a uniform layer of iron (samples S1(10
0)) and (ii) of PMMA particles coated by a uniform layer of iron (samples S1(10![[thin space (1/6-em)]](https://www.rsc.org/images/entities/char_2009.gif) :
:![[thin space (1/6-em)]](https://www.rsc.org/images/entities/char_2009.gif) 10), S2(10
10), S2(10![[thin space (1/6-em)]](https://www.rsc.org/images/entities/char_2009.gif) :
:![[thin space (1/6-em)]](https://www.rsc.org/images/entities/char_2009.gif) 20) and S3(10
20) and S3(10![[thin space (1/6-em)]](https://www.rsc.org/images/entities/char_2009.gif) :
:![[thin space (1/6-em)]](https://www.rsc.org/images/entities/char_2009.gif) 30)). The dimensions of the cells were adjusted so that the volume fractions of the different materials in the cells are the same as in the real suspensions. Note that the consideration of a uniform layer of iron around a non-magnetic particle is not completely realistic, since it has been previously observed that the magnetic coating is not totally uniform. Such simplification may give rise to quantitative differences between the experimental data and the theoretical results. However, as we will see, it gives a quite reasonable approach that allows predicting the observed trends, which justifies this approximation.
30)). The dimensions of the cells were adjusted so that the volume fractions of the different materials in the cells are the same as in the real suspensions. Note that the consideration of a uniform layer of iron around a non-magnetic particle is not completely realistic, since it has been previously observed that the magnetic coating is not totally uniform. Such simplification may give rise to quantitative differences between the experimental data and the theoretical results. However, as we will see, it gives a quite reasonable approach that allows predicting the observed trends, which justifies this approximation.
Fig. 8 shows the magnetic field intensity distribution for the BCT structures in sample S3(10![[thin space (1/6-em)]](https://www.rsc.org/images/entities/char_2009.gif) :
:![[thin space (1/6-em)]](https://www.rsc.org/images/entities/char_2009.gif) 30), as an example, for the two directions of the magnetic field: longitudinal (Fig. 8a) and transverse (Fig. 8c). Fig. 8b is a magnification of Fig. 8a. As observed, the magnetic field intensity is strongly enhanced in the gaps between the core–shell PMMA–iron composites. This result reveals the importance of the interparticle gaps as the main source of the stress in concentrated suspensions of magnetic particles upon magnetic field application.
30), as an example, for the two directions of the magnetic field: longitudinal (Fig. 8a) and transverse (Fig. 8c). Fig. 8b is a magnification of Fig. 8a. As observed, the magnetic field intensity is strongly enhanced in the gaps between the core–shell PMMA–iron composites. This result reveals the importance of the interparticle gaps as the main source of the stress in concentrated suspensions of magnetic particles upon magnetic field application.
Fig. 9 shows the strain dependence of the longitudinal and transverse magnetic permeabilities, obtained by eqn (3), for samples S0(10![[thin space (1/6-em)]](https://www.rsc.org/images/entities/char_2009.gif) :
:![[thin space (1/6-em)]](https://www.rsc.org/images/entities/char_2009.gif) 0) and S3(10
0) and S3(10![[thin space (1/6-em)]](https://www.rsc.org/images/entities/char_2009.gif) :
:![[thin space (1/6-em)]](https://www.rsc.org/images/entities/char_2009.gif) 30) at an internal magnetic field of 10 kA m−1, as an example. It is seen that μ⊥ is almost independent of the strain. This is because μ⊥ depends mainly on the distance between particles of two opposite peripheral chains in the BCT structures. When the structures are sheared, the particles of these chains approach, but the distance between them scarcely changes with respect to its initial value. The tendency for μ‖ is completely different, with an important decrease for increasing values of the strain. This is due to the appearance and enlargement of gaps between particles of the same chain, when the structures are deformed. However, the most noticeable result of Fig. 9 is the increase of both components, μ‖ and μ⊥, when PMMA particles are added to the suspension.
30) at an internal magnetic field of 10 kA m−1, as an example. It is seen that μ⊥ is almost independent of the strain. This is because μ⊥ depends mainly on the distance between particles of two opposite peripheral chains in the BCT structures. When the structures are sheared, the particles of these chains approach, but the distance between them scarcely changes with respect to its initial value. The tendency for μ‖ is completely different, with an important decrease for increasing values of the strain. This is due to the appearance and enlargement of gaps between particles of the same chain, when the structures are deformed. However, the most noticeable result of Fig. 9 is the increase of both components, μ‖ and μ⊥, when PMMA particles are added to the suspension.
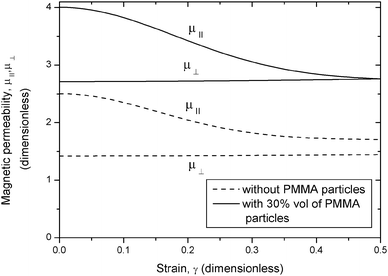 | ||
Fig. 9 Dependence on the strain of the longitudinal (μ‖) and transverse (μ⊥) magnetic permeabilities at an internal magnetic field of 10 kA m−1 for samples S0(10![[thin space (1/6-em)]](https://www.rsc.org/images/entities/char_2009.gif) : :![[thin space (1/6-em)]](https://www.rsc.org/images/entities/char_2009.gif) 0) (dashed line) and S3(10 0) (dashed line) and S3(10![[thin space (1/6-em)]](https://www.rsc.org/images/entities/char_2009.gif) : :![[thin space (1/6-em)]](https://www.rsc.org/images/entities/char_2009.gif) 30) (solid line). 30) (solid line). | ||
The shear stress calculated by using eqn (2) at an internal magnetic field of 10 kA m−1 is shown in Fig. 10 for samples S0(10![[thin space (1/6-em)]](https://www.rsc.org/images/entities/char_2009.gif) :
:![[thin space (1/6-em)]](https://www.rsc.org/images/entities/char_2009.gif) 0) and S3(10
0) and S3(10![[thin space (1/6-em)]](https://www.rsc.org/images/entities/char_2009.gif) :
:![[thin space (1/6-em)]](https://www.rsc.org/images/entities/char_2009.gif) 30) as an example. It is seen that the shear stress remains higher in the case of sample S3(10
30) as an example. It is seen that the shear stress remains higher in the case of sample S3(10![[thin space (1/6-em)]](https://www.rsc.org/images/entities/char_2009.gif) :
:![[thin space (1/6-em)]](https://www.rsc.org/images/entities/char_2009.gif) 30) for the entire range of strain values.
30) for the entire range of strain values.
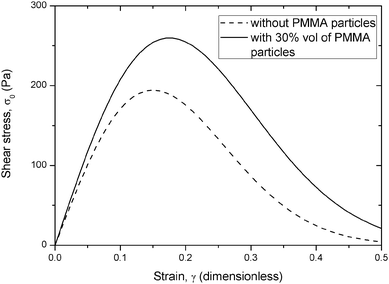 | ||
Fig. 10 Calculated shear stress as a function of the strain at an internal magnetic field of 10 kA m−1 for samples S0(10![[thin space (1/6-em)]](https://www.rsc.org/images/entities/char_2009.gif) : :![[thin space (1/6-em)]](https://www.rsc.org/images/entities/char_2009.gif) 0) (dashed line) and S3(10 0) (dashed line) and S3(10![[thin space (1/6-em)]](https://www.rsc.org/images/entities/char_2009.gif) : :![[thin space (1/6-em)]](https://www.rsc.org/images/entities/char_2009.gif) 30) (solid line). 30) (solid line). | ||
As mentioned in Section 3.1, the static yield stress can be experimentally estimated by extrapolating the value of the stress in the low shear rate pseudoplateau of double logarithmic scale rheograms. Alternatively, it can be calculated as the maximum value of the shear stress in shear stress vs. strain curves like those shown in Fig. 10. Above the critical value of the shear strain (i.e. the one for which the maximum appears), particle structures break and give rise to a decrease of the shear stress. In Fig. 11, the so-obtained static yield stress is plotted against the internal magnetic field together with the experimental results for samples S0(10![[thin space (1/6-em)]](https://www.rsc.org/images/entities/char_2009.gif) :
:![[thin space (1/6-em)]](https://www.rsc.org/images/entities/char_2009.gif) 0) and S3(10
0) and S3(10![[thin space (1/6-em)]](https://www.rsc.org/images/entities/char_2009.gif) :
:![[thin space (1/6-em)]](https://www.rsc.org/images/entities/char_2009.gif) 30). As seen in this figure, the theoretical model correctly predicts the increase of the static yield stress of sample S3(10
30). As seen in this figure, the theoretical model correctly predicts the increase of the static yield stress of sample S3(10![[thin space (1/6-em)]](https://www.rsc.org/images/entities/char_2009.gif) :
:![[thin space (1/6-em)]](https://www.rsc.org/images/entities/char_2009.gif) 30) with respect to sample S1(10
30) with respect to sample S1(10![[thin space (1/6-em)]](https://www.rsc.org/images/entities/char_2009.gif) :
:![[thin space (1/6-em)]](https://www.rsc.org/images/entities/char_2009.gif) 0). However, it overestimates the static yield stress in both cases. This deviation from the experimental data can be attributed to the simplifications made in our model (e.g. homogeneous iron shell), and to the fact that the real particle structures in the suspensions may be slightly different from those considered in our model (see ref. 37 for discussion on field-induced particle structures in MR fluids). However, the model correctly predicts the experimentally observed trends. It is important to remark that it is the increase of the magnetic permeability of suspensions of non-magnetic-core–magnetic-shell composites with respect to suspensions of solid (pure) magnetic particles, which qualitatively explains the increase of the yield stress of the multi-component magnetic suspensions.
0). However, it overestimates the static yield stress in both cases. This deviation from the experimental data can be attributed to the simplifications made in our model (e.g. homogeneous iron shell), and to the fact that the real particle structures in the suspensions may be slightly different from those considered in our model (see ref. 37 for discussion on field-induced particle structures in MR fluids). However, the model correctly predicts the experimentally observed trends. It is important to remark that it is the increase of the magnetic permeability of suspensions of non-magnetic-core–magnetic-shell composites with respect to suspensions of solid (pure) magnetic particles, which qualitatively explains the increase of the yield stress of the multi-component magnetic suspensions.
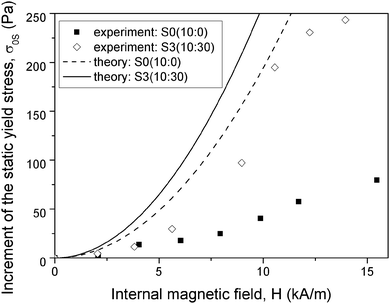 | ||
Fig. 11 Theoretical values (lines) and experimental increment (symbols) of the static yield stress. Dashed line and ■ symbols correspond to sample S0(10![[thin space (1/6-em)]](https://www.rsc.org/images/entities/char_2009.gif) : :![[thin space (1/6-em)]](https://www.rsc.org/images/entities/char_2009.gif) 0) and solid line and ◇ symbols to sample S3(10 0) and solid line and ◇ symbols to sample S3(10![[thin space (1/6-em)]](https://www.rsc.org/images/entities/char_2009.gif) : :![[thin space (1/6-em)]](https://www.rsc.org/images/entities/char_2009.gif) 30). 30). | ||
5 Conclusions
In this work, the steady state rheological behaviour of multi-component magnetic suspensions in the absence of a magnetic field and upon its application has been studied. These suspensions consist of two particle populations: a magnetic one, consisting of iron particles with a median diameter of 2.3 μm, and non-magnetic PMMA particles of about 10 μm in diameter. The iron–PMMA volume fractions in the suspensions have been set to 10![[thin space (1/6-em)]](https://www.rsc.org/images/entities/char_2009.gif) :
:![[thin space (1/6-em)]](https://www.rsc.org/images/entities/char_2009.gif) 0, 10
0, 10![[thin space (1/6-em)]](https://www.rsc.org/images/entities/char_2009.gif) :
:![[thin space (1/6-em)]](https://www.rsc.org/images/entities/char_2009.gif) 10, 10
10, 10![[thin space (1/6-em)]](https://www.rsc.org/images/entities/char_2009.gif) :
:![[thin space (1/6-em)]](https://www.rsc.org/images/entities/char_2009.gif) 20 and 10
20 and 10![[thin space (1/6-em)]](https://www.rsc.org/images/entities/char_2009.gif) :
:![[thin space (1/6-em)]](https://www.rsc.org/images/entities/char_2009.gif) 30. In addition, the behaviour of single-component suspensions consisting of just PMMA (20, 30 and 40 vol%) and iron (10 and 14 vol%) has been also studied. It has been observed that at zero-field the multi-component suspensions develop higher values of the viscosity and the yield stress than the corresponding single-component ones in spite of having the same total volume fraction. Such an increase has been proved not to be due to interactions between particles of the same population, but to the interaction between iron and PMMA particles. More specifically, it has been explained by the appearance of core–shell composites, which arise from the adsorption (i.e. coordination compound formation) of iron particles on PMMA ones.
30. In addition, the behaviour of single-component suspensions consisting of just PMMA (20, 30 and 40 vol%) and iron (10 and 14 vol%) has been also studied. It has been observed that at zero-field the multi-component suspensions develop higher values of the viscosity and the yield stress than the corresponding single-component ones in spite of having the same total volume fraction. Such an increase has been proved not to be due to interactions between particles of the same population, but to the interaction between iron and PMMA particles. More specifically, it has been explained by the appearance of core–shell composites, which arise from the adsorption (i.e. coordination compound formation) of iron particles on PMMA ones.
The existence of such an adsorbed iron-on-PMMA layer has been confirmed by optical microscopy, both in the absence of a magnetic field and upon its application as well as by ATR. Furthermore, upon magnetic field application, the resulting non-magnetic-core–magnetic-shell composites move and present a tendency to aggregate into structures aligned in the direction of the applied field. It has been shown that these magnetic field-induced structures, which involve both particle populations, give rise to an increase in the suspension viscosity and dynamic and static yield stresses upon magnetic field application, with respect to the single-component suspension with the same volume fraction of iron (sample S0(10![[thin space (1/6-em)]](https://www.rsc.org/images/entities/char_2009.gif) :
:![[thin space (1/6-em)]](https://www.rsc.org/images/entities/char_2009.gif) 0)). In fact, it has also been observed that both yield stresses increase when the PMMA volume fraction increases. As a result, it can be said that the incorporation of non-magnetic particles into a suspension of magnetic ones, gives rise to an enhanced MR effect.
0)). In fact, it has also been observed that both yield stresses increase when the PMMA volume fraction increases. As a result, it can be said that the incorporation of non-magnetic particles into a suspension of magnetic ones, gives rise to an enhanced MR effect.
Finally, a theoretical model has been applied in order to explain the origin of this enhancement of the MR effect. According to this model, the main contribution to the yield stress is the change of the suspension magnetic permeability when the magnetic field-induced structures are stretched by the shear. By means of finite element method simulations, it has been shown that the magnetic permeability of multi-component suspensions is higher than that of single-component suspensions having the same amount of magnetic particles. Consequently, this increase of the magnetic permeability is the ultimate reason for the experimentally observed enhancement of the MR effect when non-magnetic particles are coated by a layer of magnetic material.
Acknowledgements
This work was supported by Projects P08-FQM-3993, P09-FQM-4787 (Junta de Andalucía, Spain) and FIS2009-07321 (MICINN, Spain). In addition, L. Rodríguez-Arco and M.T. López-López acknowledge financial support by Secretaría de Estado de Educación, Formación Profesional y Universidades (MECD, Spain) through its FPU program and the University of Granada (Spain), respectively.Notes and references
- V. B. Fainerman, E. V. Aksenenko, J. T. Petkov and R. Miller, Soft Matter, 2010, 6, 4694–4700 RSC.
- J. Jun, S. Uhm, S. Cho and K. Suh, Langmuir, 2004, 20, 2429–2434 CrossRef CAS.
- M. T. López-López, J. de Vicente, G. Bossis, F. González-Caballero and J. D. G. Durán, J. Mater. Res., 2005, 20, 874–881 CrossRef.
- M. T. López-López, A. Zubarev and G. Bossis, Soft Matter, 2010, 6, 4346–4349 RSC.
- M. T. López-López, P. Kuzhir, S. Lacis, G. Bossis, F. González-Caballero and J. D. G. Durán, J. Phys.: Condens. Matter, 2006, 18, S2803–S2813 CrossRef.
- J. Y. Lee, R. B. Thompson, D. Jasnow and A. C. Balazs, Faraday Discuss., 2003, 123, 121–131 RSC.
- Y. Cho, G. Yi, J. Lim, S. Kim, V. N. Manoharan, D. J. Pine and S. Yang, J. Am. Chem. Soc., 2005, 127, 15968–15975 CrossRef CAS.
- R. M. Erb, H. S. Son, B. Samanta, V. M. Rotello and B. B. Yellen, Nature, 2009, 457, 999–1002 CrossRef CAS.
- J. de Vicente, D. J. Klingenberg and R. Hidalgo-Alvarez, Soft Matter, 2011, 7, 3701–3710 RSC.
- B. J. de Gans, C. Blom, A. P. Philipse and J. Mellema, Phys. Rev. E: Stat. Phys., Plasmas, Fluids, Relat. Interdiscip. Top., 1999, 60, 4518–4527 CrossRef CAS.
- Y. Gao, Y. C. Jian, L. F. Zhang and J. P. Huang, J. Phys. Chem. C, 2007, 111, 10785–10791 CAS.
- J. Ramos, J. de Vicente and R. Hidalgo-Álvarez, Langmuir, 2010, 26, 9334–9341 CrossRef CAS.
- M. T. López-López, A. Gómez-Ramírez, J. D. G. Durán and F. González-Caballero, Langmuir, 2008, 24, 7076–7084 CrossRef.
- J. C. Ulicny, K. S. Snavely, M. A. Golden and D. J. Klingenberg, Appl. Phys. Lett., 2010, 96, 231903 CrossRef.
- M. L. Levin, D. E. Polesskii and I. V. Prokhorov, J. Eng. Phys. Thermophys., 1997, 70, 769–772 CrossRef CAS.
- D. J. Klingenberg and J. C. Ulicny, Proceedings of the 13th International Conference on Electrorheological Fluids and Magnetorheological Suspensions, Ankara, 2012 Search PubMed.
- K. H. Gudmundsson, F. Jonsdottir, F. Thorsteinsson and O. Gutfleisch, J. Intell. Mater. Syst. Struct., 2011, 22, 539–549 CrossRef.
- R. G. Larson, in The Structure and Rheology of Complex Fluids, ed. K. E. Gubins, Oxford University Press, New York, 1999, p. 353 Search PubMed.
- I. M. Krieger and T. J. Dougherty, Trans. Soc. Rheol., 1959, 3, 137–152 CrossRef CAS.
- H. A. Barnes, J. F. Hutton and K. Walters, in An Introduction to Rheology, Elsevier, Amsterdam, 1993, p. 122 Search PubMed.
- M. S. Cho, S. T. Lim, I. B. Jang, H. J. Choi and M. S. John, IEEE Trans. Magn., 2004, 40, 3036–3038 CrossRef CAS.
- Z. Guo, L. L. Henry, V. Palshin and E. J. Pdlaha, J. Mater. Chem., 2006, 16, 1772–1777 RSC.
- B. J. Park, M. S. Kim and H. J. Choi, Mater. Lett., 2009, 63, 2178–2180 CrossRef CAS.
- W. Wang, M. Zhou, Z. Jin and T. Li, J. Hazard. Mater., 2010, 173, 724–730 CrossRef CAS.
- S. W. Ko, J. Y. Lim, B. J. Park, M. S. Yang and H. J. Choi, J. Appl. Phys., 2009, 105, 07E703 CrossRef.
- K. Nakamoto, in Infrared and Raman Spectra of Inorganic and Coordination Compounds, J. Wiley & Sons, New York, 1986 Search PubMed.
- M. M. Figueira, B. Volesky and H. J. Mathieu, Environ. Sci. Technol., 1999, 33, 1840–1846 CrossRef CAS.
- Y. Sahoo, H. Pizem, T. Fried, D. Golodnitsky, L. Burstein, C. N. Sukenik and G. Markovich, Langmuir, 2001, 17, 7907–7911 CrossRef CAS.
- R. A. Salkar, P. Jeevanandam, G. Kataby, S. T. Aruna, Y. Kolypin, O. Palchik and A. Gedanken, J. Phys. Chem. B, 2000, 104, 893–897 CrossRef CAS.
- I. Bauer and H.-J. Knölker, in Iron Catalysis in Organic Chemistry, Wiley-VCH Verlag GmbH & Co. KGaA, Weinheim, 2008 Search PubMed.
- L. D. Landau and E. M. Lifshitz in Electrodynamics of Continuous Media, Pergamon, New York, 1984 Search PubMed.
- K. W. Yu and K. P. Yuen, J. Phys.: Condens. Matter, 1996, 8, 11327–11336 CrossRef CAS.
- M. T. López-López, P. Kuzhir, J. Caballero-Hernández, L. Rodríguez-Arco, J. D. G. Durán and G. Bossis, J. Rheol., 2012, 56, 1209–1224 CrossRef.
- R. Tao and J. M. Sun, Phys. Rev. Lett., 1991, 67, 398–401 CrossRef.
- T. J. Chen, R. N. Zitterand and R. Tao, Phys. Rev. Lett., 1992, 68, 2555–2558 CrossRef CAS.
- D. C. Meeker, Finite Element Method Magnetics, Version 4.2, 15 July 2009 Mathematica Build, http://www.femm.info Search PubMed.
- G. Bossis, O. Volkova, S. Lacis and A. Meunier, in Magnetorheology: Fluids, Structures and Rheology, ed. S. Odenbach, Springer-Verlag, Berlin, 2002, pp. 202–230 Search PubMed.
Footnote |
| † Electronic supplementary information (ESI) available: Video 1. See DOI: 10.1039/c3sm50609f |
| This journal is © The Royal Society of Chemistry 2013 |
