 Open Access Article
 This Open Access Article is licensed under a Creative Commons Attribution-Non Commercial 3.0 Unported Licence
Exploring the kinetics of switchable polymer surfaces with dynamic tensiometry†
Justin A.
Kleingartner‡
a,
Hyomin
Lee‡
a,
Michael F.
Rubner
*b,
Gareth H.
McKinley
*c and
Robert E.
Cohen
*a
aDepartment of Chemical Engineering, Massachusetts Institute of Technology, Cambridge, Massachusetts 02139, USA. E-mail: recohen@mit.edu; Tel: +1 617 253 3777
bDepartment of Material Science and Engineering, Massachusetts Institute of Technology, Cambridge, Massachusetts 02139, USA. E-mail: rubner@mit.edu; Tel: +1 617 253 0094
cDepartment of Mechanical Engineering, Massachusetts Institute of Technology, Cambridge, Massachusetts 02139, USA. E-mail: gareth@mit.edu; Tel: +1 617 258 0754
First published on 20th May 2013
Abstract
Switchable polymer multilayer coatings consisting of poly(vinyl alcohol) (PVA) and poly(acrylic acid) (PAA) were prepared via Layer-by-Layer (LbL) assembly and post-functionalized with poly(ethylene glycol methyl ether) (PEG). This resulted in a soft polar coating that reversibly and repeatedly rearranges from hydrophobic to hydrophilic (or vice versa) when contacted with water (or air). Goniometry is used to quantify the forward surface rearrangement in the form of transient measurements of the water contact angle. By examining the time evolution of the water contact angle at various temperatures, the apparent activation energy for the forward surface rearrangement (Ea,f) can be determined. Further insight can be gained into the kinetics of this surface reconstruction process by utilizing dynamic tensiometry to measure the evolution in the contact angle of a liquid meniscus at several rates and temperatures as it advances or recedes over the multilayer films. A simple first-order thermally-activated rate process is shown to describe the forward and reverse surface reconstruction and enables the shape of the measured tensiometric force curves during repeated immersion and emersion to be predicted quantitatively. Using this model we show that the character of this switchable surface coating can appear to be hydrophobic or hydrophilic depending on a single dimensionless parameter which incorporates the characteristic time-scale for temperature-dependent surface rearrangement, the speed of immersion and the capillary length of the liquid meniscus.
Introduction
Switchable polymer surfaces have the ability to rearrange on a molecular level in response to changes in their surrounding environments. A number of research groups have developed surfaces that can switch their surface wetting in response to environmental stimuli.1–15 Many experimental tools have been employed to investigate surface reconstruction phenomenon, including electron spectroscopy for chemical analysis (ESCA) or X-ray photoelectron spectroscopy (XPS),3,14,16,17 sum-frequency generation microscopy (SFM),5 surface acidity titration,14 and contact angle goniometry.1–14 Although each technique has specific advantages depending on the intended probing depth and sensitivity, contact angle measurements generally offer a very simple, convenient method of characterizing solid–liquid interfaces that are undergoing surface reconstruction. Contact angle measurements probe the top molecular layer of a surface (typically less than 1 nm deep),18 making them appropriate for elucidating the details of surface phenomena, which are primarily governed by local molecular motions and short-range interactions. Advancing and receding contact angles of a probe liquid are used to provide an upper and lower bound on the thermodynamic equilibrium contact angle.19 In the measurement of an advancing water contact angle (θadv), the advancing three-phase contact line of the expanding liquid drop always sees the solid–air interface where primarily low surface energy moieties are present; whereas, the receding three-phase contact line of a contracting liquid drop moves across a solid–liquid interface that has been enriched with higher surface energy moieties due to local molecular reorientation that provides preferential interactions with the wetting liquids.20 This procedure provides measurements of two distinct interfacial states that bracket the equilibrium behavior of the three phase system.Previous work has primarily focused on measuring contact angle hysteresis (CAH = θadv − θrec) to quantify surface reconstruction phenomena.7,20 Although large contact angle hysteresis has been associated with significant surface reconstruction,7,8 surface roughness21 and chemical heterogeneity22,23 also result in hysteresis even in the absence of surface reconstruction. A more insightful characterization of surface reconstruction can be accomplished through quantitative investigation into the kinetics of surface rearrangement. Recently, time dependent measurements of contact angles on various reconfigurable surfaces have been used to probe the rate of the surface rearrangement of biopolymer coatings,2 poly(methyl methacrylate) (PMMA),5 and siloxane-based polymeric surfaces.4
Morra et al. have previously used dynamic tensiometry to investigate rearranging hydrogel surfaces.13 In the present work, we show that rate and temperature dependent tensiometry measurements provide a powerful framework for completely characterizing the forward (hydrophobic to hydrophilic) and reverse (hydrophilic to hydrophobic) reconstruction phenomena, as well as the temperature dependencies of these thermally-activated kinetic processes. In a dynamic tensiometer, force and relative position data are collected while a container of probe liquid is raised and lowered at a constant velocity such that the liquid contact line advances (or recedes) across the solid surface at a programmed speed. In the quasi-static limit, when viscous forces are negligible, the net force acting on the sample results from a combination of interfacial and buoyant forces and is given by F = Pγlvcos θ − ρlgAx, where P is the total perimeter of the solid–liquid–air contact line, γlv is the probe liquid surface tension, ρl is the liquid density, g is the gravitational acceleration, A is the cross-sectional area of the immersed solid, and x is the immersed depth of the solid.24,25 This force balance can be conveniently nondimensionalized, scaling the resultant tensiometric force by Pγlv (the maximum possible interfacial force in the vertical direction) and the immersed depth by  (the maximum height associated with capillary rise of a liquid meniscus on the solid in the limit of perfect wetting θ → 0), where
  .26 This scaling allows for a more insightful analysis of the shape of tensiometric force traces and results in the compact expression
![[F with combining circumflex]](https://www.rsc.org/images/entities/i_char_0046_0302.gif) = cos θ − B = cos θ − B![[x with combining circumflex]](https://www.rsc.org/images/entities/i_char_0078_0302.gif) | (1) |
= F/Pγlv is the scaled force,  is the scaled immersion depth, and
  is a dimensionless group quantifying the buoyant force acting on the immersed solid. By measuring the transient force F(t) in the system as the liquid contact line advances or recedes across the surface (at a specified rate ẋ = ±V) dynamic changes in the advancing or receding contact angle (denoted as θ(t)) can be calculated.
In the search for a mechanically robust antifrost, and antifogging coating, we have recently developed a new multilayer system.27 This system exhibited two interesting characteristics: One is zwitter-wettable behavior whereby the multilayer film exhibits a facile, rapid absorption of water into a film from the gas phase while simultaneously exhibiting very high contact angles for drops of liquid water placed on the surface of the same film, and the other is transient water contact angle behavior. The former feature has been discussed in detail previously.27 In the present study, we investigate the time-dependent wetting behavior of these coatings, which results from the transient surface rearrangement of hydrophilic functional groups towards the surface in response to exposure to a liquid water environment.
Experimental
Materials
Poly(vinyl alcohol) (PVA, Mw = 131 kDa, PDI = 1.50, 87–89% hydrolyzed, Sigma-Aldrich), poly(acrylic acid) (PAA, Mw = 225 kDa, 20% aqueous solution, Sigma-Aldrich), glutaraldehyde solution (Grade II, 25% in H2O, Sigma-Aldrich), 2-butanone (MEK, 99+% A.C.S. reagent, Sigma-Aldrich), diiodomethane (Sigma-Aldrich), hexadecane (Sigma-Aldrich), poly(glycidyl methacrylate) (PGMA, Mw = 25 kDa, 10% solution in MEK, Polysciences), and poly(ethylene glycol methyl ether) (PEG, Mw = 5 kDa, Sigma-Aldrich) were used as received. Standard soda-lime glass microscope slides and phosphate buffered saline (PBS) were obtained from VWR. Deionized water (DI, 18.2 MΩ cm, MilliQ) was used in all aqueous polymer solutions and rinsing procedures.Fabrication of PEG-functionalized PVA/PAA multilayer film
The glass substrates were first degreased by sonication in a 4% (v/v) solution of Micro-90 (International Products Co.) for 15 min, subsequently sonicated twice in DI water for 15 min, and then dried with compressed air. They were treated with oxygen plasma (PDC-32G, Harrick Scientific Products, Inc.) for 2 min at 150 mTorr and then PGMA anchoring chemistry28 was applied using previously described protocols29 to covalently bond the first layer of PVA to the substrate. Hydrogen bonded PVA/PAA films were produced via Layer-by-Layer (LbL) assembly using a Stratosequence VI spin dipper (Nanostrata Inc.) controlled using StratoSmart v6.2 software. The LbL assembly process employed dipping times of 10 min for each polymer solution, followed by three rinses of 2, 1, and 1 min. The concentration of the PVA and PAA solutions was 1 mg mL−1 and the pH of these solutions and the rinse water were adjusted to pH 2.0 with 0.1 M HCl. The as-assembled PVA/PAA multilayer films (consisting of 30 bilayers) were then thermally cross-linked at 140 °C for 5 min in vacuum to impart pH-stability,29 and these stabilized films were subsequently immersed in 10 mg mL−1 PEG solution (pH 2.0) for 20 min. The PEG-functionalized PVA/PAA multilayer films were prepared by soaking in 0.13% (w/w) glutaraldehyde in PBS at 30 °C for 10 min, rinsing with DI water, and drying with compressed air.Film characterization
Transient goniometric water contact angle measurements were performed using a ramé-hart model 590 goniometer after vertically dispensing sessile droplets of deionized water (γlv = 72.8 mN m−1) on various coatings. Advancing water contact angles were measured as deionized water was supplied via a syringe. Transient water contact angle measurement commenced immediately after the water drop was advanced to a volume of approximately 10 μL. Measurements were taken over three or more different locations on each LbL film, and the reported uncertainties are standard deviations associated with the measurement of these contact angle values. The reversibility of surface rearrangement was demonstrated by immersing the initially dry sample into deionized water for 10 min, and then measuring advancing water contact angles on the hydrated film (immediately after the sample was removed from the water) as well as in a dry state (after drying in ambient lab conditions, 22 ± 1 °C and 40 ± 10% RH, for 15 min). The temperature-dependence of the transient water contact angles was quantified using an environmental chamber (ramé-hart, P/N 100-07) with water circulation. Water drops were placed on the surface after the sample had been pre-equilibrated in the environmental chamber at the specified test temperature for at least 10 min. Contact angle measurements with other probe fluids (specifically the nonpolar liquids diiodomethane and hexadecane) were performed in the same manner. Tensiometric force measurements were made using a DCAT 11 (DataPhysics Instruments) tensiometer. The samples were probed at velocities ranging from 0.01 ≤ V ≤ 1 mm s−1 and temperatures ranging from 10–40 °C with a sampling frequency of 50 Hz and total immersion depths of x ≤ 25 mm.Results and discussion
Thin multilayer coatings consisting of PVA and PAA were produced via LbL assembly at low pH conditions (pH = 2.0), stabilized for use at higher pH by post-assembly thermal or chemical treatments, and then further functionalized with poly(ethylene glycol methyl ether) (PEG) using glutaraldehyde chemistry.29 A graphic representation of this process is shown in Fig. 1. This procedure results in a dry coating that rearranges on a molecular scale with time when contacted with liquid water.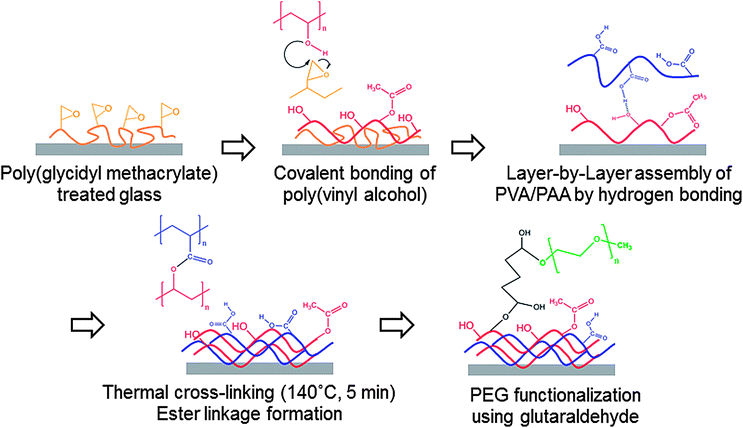 | ||
| Fig. 1 Procedure for the fabrication of PEG-functionalized PVA/PAA multilayer film on glass substrate. | ||
The dynamics of this molecular-scale, surface rearrangement were first investigated through the measurement of changes in the surface wetting properties of the coatings. Goniometric measurements of the time-dependent contact angle with water were conducted for PEG-functionalized PVA/PAA multilayer films and fluorosilane-treated glass slides as shown in Fig. 2a. The surfaces of all of these coatings exhibited initial advancing water contact angles greater than 100°. In the case of the fluorosilane-treated glass (initial advancing contact angle of 112 ± 1°), the water contact angle decreased by less than 10° over the period of 20 min, which can be attributed to evaporation of fluid from the static drop over the elapsed time of the experiment. For the PEG-functionalized PVA/PAA multilayer film, the initial water contact angle (θi = 117 ± 1°) decreased monotonically dropping to approximately 40° after 20 min. After the initial stage of rapid decay, the water contact angle decreased linearly with time in a similar fashion to the fluorosilane-treated glass slide. The linear decrease in contact angle at long times is expected as a result of evaporation and has been reported by others.2,5
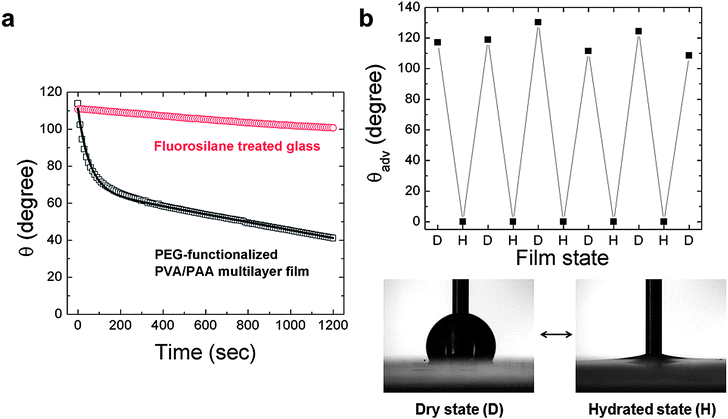 | ||
| Fig. 2 (a) Time dependence of water contact angles θ for the PEG-functionalized PVA/PAA multilayer film and fluorosilane-treated glass at room temperature (22 ± 1 °C). Open boxes, and circles represent individual data points averaged every 10 s while the bold line represents the model fit; (b) changes in advancing water contact angles θadv by alternating between dry and hydrated conditions for PEG-functionalized PVA/PAA multilayer film. | ||
The PEG-functionalized PVA/PAA multilayer films possess two particularly striking features: they have an unusually high initial water contact angle for a coating that is produced entirely from water-soluble polymers, as well as a very strong transient water contact angle behavior (exhibiting a large decay in contact angle upon exposure to a liquid water drop). The former feature has been discussed in detail previously27 and results from the combined effects of an initial surface enrichment of hydrophobic acetate moieties and the softness of the multilayer film. The latter feature can be rationalized in the context of surface reconstruction, specifically the time-dependent spatial orientation of hydrophobic and hydrophilic functional groups at the liquid water–solid polymer interface.1,2,4–6,11 To test the latter hypothesis, contact angle measurements were performed on the same samples using two nonpolar liquids, diiodomethane (DM) and hexadecane (HD), with surface tension values of γDMlv = 50.8 mN m−1 and γHDlv = 27.5 mN m−1, respectively. These results are shown in the ESI (Fig. S1†). Both liquids exhibited low contact angle hysteresis (CAH ≈ 15°) on the LbL films and only a weak linear time dependence in their contact angles, which can again be attributed to evaporation. There was no evidence of the strong exponential transient response in the contact angle measured with liquid droplets of DM or HD. This suggests that the hydrophilic groups buried just beneath the surface of the initially-dry films are not driven to the solid–liquid interface when nonpolar liquids are used to probe the surface.
The reversibility of the surface reconstruction, shown in Fig. 2b, was investigated by measuring the initial advancing water contact angle while alternating the environment between hydrated and dry states. The PEG-functionalized PVA/PAA multilayer film, which exhibits an initially hydrophobic contact angle, was repeatedly placed in hydrated conditions (submerged in water) and then dried in ambient lab conditions (22 ± 1 °C, 40 ± 10% RH) for 15 min.10 In the hydrated state the film exhibited an advancing water contact angle near zero, which is likely due to a thin residual layer of adsorbed water covering the surface. As the surface is gradually dried under ambient conditions, the initial advancing water contact angle increased from 0° to more than 100° indicating that the surface of the multilayer film reconfigures as water molecules are removed to enrich the concentration of lower energy hydrophobic acetate moieties to the hydrophobic state. After five cycles the film still displayed complete reversibility (Fig. 2b).
The initial rapid response of the surface reconfiguration can be characterized by an exponential of the form ∼exp(−t/τf) where τf is a material-dependent time constant. Furthermore, if this surface reconstruction is viewed as a thermally-activated process, the characteristic time scale (τf) of the mechanism should depend on temperature according to an Arrhenius or similar formalism. This aspect of the film behavior was explored goniometrically by performing time dependent measurements of the water contact angle at T = 10, 20, 30, and 40 °C. The results of these experiments are shown in Fig. 3a. The initial exponential decay of the water contact angle clearly proceeds more rapidly at higher temperatures. The forward surface rearrangement occurs within the first half of the experiment and the subsequent linear decrease in the measured contact angle was used to estimate the evaporation rate. The time constant for the forward surface rearrangement (τf) was then determined after removing the effects of evaporation. The surface rearrangement was modeled as a first-order process:
 | (2) |
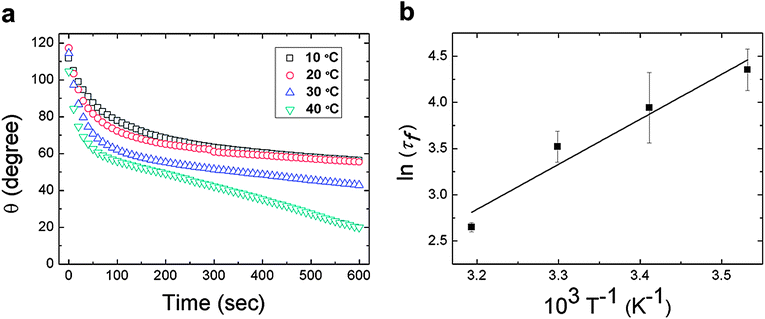 | ||
| Fig. 3 (a) Time dependence of the water contact angle θ for the PEG-functionalized PVA/PAA multilayer film at T = 10, 20, 30, 40 °C. The individual data points represent the average value of three separate measurements over 10 s intervals; (b) a plot of ln τfversus T−1 where τf is obtained from fits of the transient data in (a) after correcting for evaporation. | ||
Table 1 shows clearly that the time constant characterizing surface reconstruction in the PEG-functionalized PVA/PAA multilayer films decreases with increasing temperature, while θphob and θphil remain nearly constant. The temperature dependence of the surface rearrangement rate was assumed to follow an Arrhenius form:
| τf−1 = Afexp(−Ea,f/RT) | (3) |
| Temperature (°C) | θ phob (deg) | θ phil (deg) | τ f (s) |
|---|---|---|---|
| 10 | 110 ± 3 | 69 ± 13 | 79 ± 19 |
| 20 | 111 ± 8 | 67 ± 8 | 54 ± 18 |
| 30 | 110 ± 7 | 60 ± 14 | 34 ± 5 |
| 40 | 105 ± 16 | 66 ± 12 | 14 ± 1 |
Modeling the kinetics of surface rearrangement in dynamic tensiometry
Dynamic tensiometry allows for a more complete characterization of the wetting behavior of switchable surfaces, including the investigation of both the forward and reverse rearrangement. The first immersion into water of the PEG-functionalized PVA/PAA surface in a dynamic tensiometer probes the forward surface rearrangement through the measurement of an apparent velocity-dependence in the advancing contact angle of the air-equilibrated surface, as shown schematically in Fig. 4a. During emersion (i.e., as the sample is removed from the liquid) the receding contact angle of water on the reconfigured surface is measured. As the sample is re-exposed to air the surface rearranges back towards the original dry state. Upon the second and all subsequent immersions, the rate of this reverse rearrangement will be probed, because the contact line is now moving over locations on the surface that are in various degrees of rearrangement back to the original state.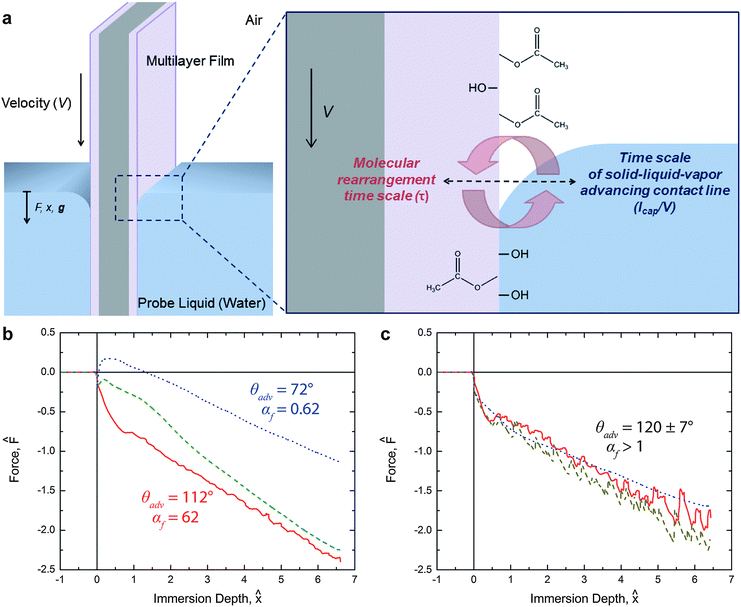 | ||
Fig. 4 (a) Schematic of the PEG-functionalized PVA/PAA multilayer film undergoing surface reconstruction during the first tensiometric immersion in water. Hydrophobic moieties are represented by acetate groups and hydrophilic groups, such as PEG and carboxylic acid groups, are represented by hydroxyl groups; (b) force trace for the first immersion of the PEG-functionalized PVA/PAA multilayer film into water at 30 °C occurring at three different rates. Solid red ( ), dashed green ( ), dashed green ( ), and dotted blue ( ), and dotted blue ( ) lines correspond to instrument speeds of 1.0 mm s−1, 0.1 mm s−1, and 0.01 mm s−1, respectively; (c) force trace for first immersion of the same surface into water at 10 °C. Colored lines correspond to the same rates as in (b). The values of αf are 186, 18.6, and 1.86 for the three instrument speeds of 1.0 mm s−1, 0.1 mm s−1, and 0.01 mm s−1, respectively. ) lines correspond to instrument speeds of 1.0 mm s−1, 0.1 mm s−1, and 0.01 mm s−1, respectively; (c) force trace for first immersion of the same surface into water at 10 °C. Colored lines correspond to the same rates as in (b). The values of αf are 186, 18.6, and 1.86 for the three instrument speeds of 1.0 mm s−1, 0.1 mm s−1, and 0.01 mm s−1, respectively. | ||
The extent of surface rearrangement in the PEG-functionalized PVA/PAA multilayer film is manifest in the advancing water contact angle of the surface. In a goniometric system the time evolution of the advancing water contact angle on the surface is observed; in the case of tensiometry, a single velocity-dependent advancing water contact angle is observed where the deflection of the liquid meniscus (i.e., the contact angle) reaches a steady state configuration as the three-phase contact line advances across the surface. If the selected rate of immersion, V, is much faster than the rearrangement kinetics, then the high advancing water contact angle associated with the initial hydrophobic state is expected to dominate the tensiometric measurements. Conversely, very slow immersion will produce tensiometric data that approach the asymptotic hydrophilic behavior that was observed in goniometric experiments at long times.
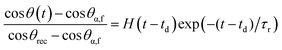
To quantify the qualitative descriptions of “slow” and “fast,” first observed by Morra et al.,13 we compare the time scale associated with molecular rearrangement τf with the characteristic time scale at which the liquid meniscus advances across the surface during the immersion process τc = ![[small script l]](https://www.rsc.org/images/entities/i_char_e146.gif) cap/V, where cap is the capillary length of the liquid. The resulting dimensionless ratio of time scales for the forward rearrangement is given by
cap/V, where cap is the capillary length of the liquid. The resulting dimensionless ratio of time scales for the forward rearrangement is given by
 | (4) |
In the limit αf ≪ 1 we expect surface rearrangement to be fast so that the advancing contact angle is small and the surface appears hydrophilic. If αf ≫ 1 the meniscus advances very rapidly compared to the rearrangement rate and the surface will appear hydrophobic. Eqn (2) models the advancing contact angle of the reconfiguring surface as a function of elapsed rearrangement time. If we evaluate this equation after a characteristic elapsed time of tc = cap/V we obtain the following expression:
 | (5) |
A transition from a high contact angle regime (θ ≈ θphob) to a rearrangement-dominated, low contact angle regime (θ ≈ θphil) is expected as the magnitude of the dimensionless group αf passes through unity.
Similarly, the reverse rearrangement can also be modeled as a first-order thermally-activated rate process with the additional consideration of the evaporation of bulk water from the surface of the previously immersed and swollen multilayer film. For simplicity, we assume that the reverse rearrangement does not begin until the excess water evaporates from the surface of the film (i.e., after a delay time td). Therefore, the following first-order model with time delay is used to describe the reverse surface rearrangement:
 | (6) |
Effects of rate and temperature
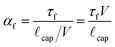
As mentioned above, probing the surface of the PEG-functionalized PVA/PAA multilayer film over increasingly greater velocities at a given temperature should result in higher measured advancing water contact angles during the first immersion of the sample, because the material near the meniscus will have had less time to rearrange relative to the time scalecap/V of contact line advancement. This behavior, increasing θadv with increasing αf, was observed clearly in our experiments, shown in Fig. 4b. The contact angle is extracted from the force measurements by fitting eqn (1) to the data. As a result, cos θ is directly related to the value of the measured force F0 when the fit over the linear portion of the data is extrapolated to x = 0. Positive values of F0 correspond to wetting contact angles (θ < 90°) and negative values to nonwetting contact angles (θ > 90°). αf was determined by fitting all of the measured force data with eqn (1) using eqn (3), (5), and (6) to determine the time-varying value of the contact angle.
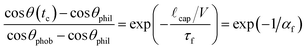
In addition to varying the rate of immersion/emersion, V/cap, the temperature of the fluid was also varied in the tensiometry experiments to further characterize the kinetics of the surface rearrangement phenomena. Experiments were carried out at four temperatures (40 °C, 30 °C, 20 °C, and 10 °C) and three speeds (1.0 mm s−1, 0.1 mm s−1, and 0.01 mm s−1). The force traces for the first immersion at 10 °C at the three experimental speeds are shown in Fig. 4c. Unlike the results seen in the 30 °C data of Fig. 4b, at 10 °C the results of the three experiments nearly coincide and the advancing contact angle of 120 ± 7° that is extracted from the data is close to the initial hydrophobic state value of 111 ± 4° obtained via goniometry. Thus at 10 °C the rate of the forward rearrangement is significantly slower than the rate of contact line advancement (i.e., αf > 1), even at the lowest experimental velocity of 10−2 mm s−1.
The full set of rate- and temperature-dependent immersion and emersion tensiometry data is shown in Fig. 5. As expected, upon immersing at the highest speed (right most column of plots in Fig. 5) the initial advancement into water yields a high initial contact angle (F0 < 0) throughout the first immersion. After exposure to water, the contact line recedes with a low receding contact angle (F0 > 0) over the rearranged surface. Subsequent immersion/emersion cycles show only the low contact angle, rearrangement-dominated regime, because the surface does not have time to revert back to the hydrophobic state at the high immersion/emersion speed (i.e., the analogous dimensionless parameter for the reverse surface rearrangement is αr ≫ 1). Experiments carried out at a speed that is an order of magnitude lower (middle column of plots in Fig. 5) show that the initial advancement of the meniscus still proceeds with a high advancing contact angle and after exposure to water the contact line recedes with a low receding contact angle. However, upon a second advancement into water, the advancing contact angle exhibits transient behavior as the surface rearranges back to its initial hydrophobic state. At this instrument speed the sample is exposed to air for a sufficient period of time that the reverse surface rearrangement (from the hydrophilic to the hydrophobic state) occurs within the time scale of the experiment (i.e., αr ∼ 1). This behavior is repeated in subsequent cycles, which highlights the complete reversibility of this surface switching phenomena. Finally, immersing at the slowest speed (V = 0.01 mm s−1), the advancing force traces indicate that the surface is hydrophilic (F0 > 0) for temperatures T ≥ 20 °C. The rate of surface reconfiguration is fast (αf < 1) compared to the translation rate of the meniscus. Subsequent immersions again show recovery towards θ → θα,f introduced in eqn (6) since the surface has sufficient time out of the water to undergo the reverse rearrangement.
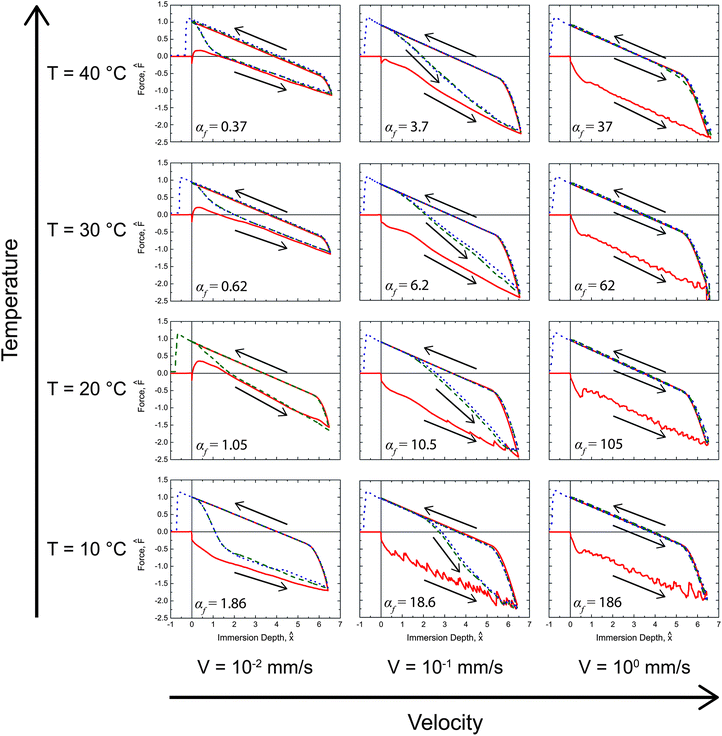 | ||
Fig. 5 Dynamic tensiometry measurements for switchable PEG-functionalized PVA/PAA multilayer films probed with water. Three rates and four water temperatures were examined. Solid red ( ), dashed green ( ), dashed green ( ), and dotted blue ( ), and dotted blue ( ) lines correspond to first, second, and third tensiometric cycles, respectively. The values of the dimensionless parameter αf (defined in eqn (4)) are given for each condition with the (temperature-dependent) values of τf evaluated from the Arrhenius fit described in the text below. The delay time for drying τd mentioned in the text is evident for the re-immersion traces at the lower temperatures and two lower speeds. ) lines correspond to first, second, and third tensiometric cycles, respectively. The values of the dimensionless parameter αf (defined in eqn (4)) are given for each condition with the (temperature-dependent) values of τf evaluated from the Arrhenius fit described in the text below. The delay time for drying τd mentioned in the text is evident for the re-immersion traces at the lower temperatures and two lower speeds. | ||
The effect of temperature on the surface rearrangement can be clearly seen in the lowest immersion/emersion speed (0.01 mm s−1) data taken at 10 °C and 20 °C. At 20 °C the surface appears hydrophilic even during the first immersion with a low contact angle and positive force intercept, F0; however, at 10 °C the surface rearrangement has slowed enough (τ10 °Cf > τ20 °Cf) that the initial immersion now occurs faster than the time scale of rearrangement (i.e., αf > 1) and the surface appears hydrophobic with a high advancing contact angle. Likewise, the effect of temperature on the reverse rearrangement (from the hydrophilic to the hydrophobic regime) can be observed in the intermediate rate (0.1 mm s−1) results. The recovery to the hydrophobic state (observed during the second immersion) occurs more rapidly at 40 °C than at 10 °C. The higher temperature increases the rate of surface rearrangement and allows for faster restoration of the hydrophobic state.
Model and kinetic parameters for surface rearrangement
The measured force data was fitted with eqn (1) using eqn (3), (5), and (6) to calculate the time-varying value of the contact angle θ(t). When the tensiometer changes directions there is a small transition region where the contact line pins as the contact angle moves from the advancing value to the receding value or vice versa. The contact angle in this region was modelled by solving the Young–Laplace equation for our system’s geometry.25,26 The resulting model for the tensiometric force data contains eight parameters, for which the fitted values are summarized with their goniometric equivalents in Table 2.| Variable | Units | Goniometry | Tensiometry |
|---|---|---|---|
| a Values are averaged from the contact angles obtained for different temperatures (Table 1). b t d, log10Ar, and Ea,r are not available because goniometry can only probe the forward surface rearrangement. | |||
| θ phob | degrees | 109a | 125 |
| θ phil | degrees | 66a | 53 |
| log10Af | — | 5.5 | 4.7 |
| E a,f | kJ mol−1 | 40.5 | 40.1 |
| θ rec | degrees | 16 | 25 |
| t d | seconds | —b | 151 |
| log10Ar | — | —b | 1.2 |
| E a,r | kJ mol−1 | —b | 18.5 |
Table 2 shows that good agreement between the Arrhenius parameters can be obtained from the two experimental methods (goniometry and tensiometry) for the forward surface rearrangement. The activation energy of this process arises from the segmental motion of hydrophobic and hydrophilic moieties at the interface between the PEG-functionalized PVA/PAA multilayer film and liquid water.
The value for the advancing water contact angle in the hydrophobic regime (θphob) obtained from tensiometry is slightly higher than the value obtained from goniometry, which is due to the inherent experimental difficulties in obtaining this value with a goniometer. The surface immediately begins to rearrange when contacted with water and as a result several seconds elapse between placing the drop, the decay of all internal motion, and starting the contact angle measurement in a goniometric system. Tensiometry avoids this issue by immersing the sample into a reservoir of the probe liquid at a slow fixed speed and the tensile force on the surface is measured in real time. The advancing water contact angle is then obtained from regression of eqn (1) to the linear portion of the immersion force traces.
The force traces produced from the dynamic model with the fitted parameters from Table 2 are shown with the corresponding experimental data in Fig. 6 and 7 for selected temperatures and rates. The complete set of model results plotted in a form analogous to Fig. 5 can be found in the ESI (Fig. S4†) with their corresponding αf values.
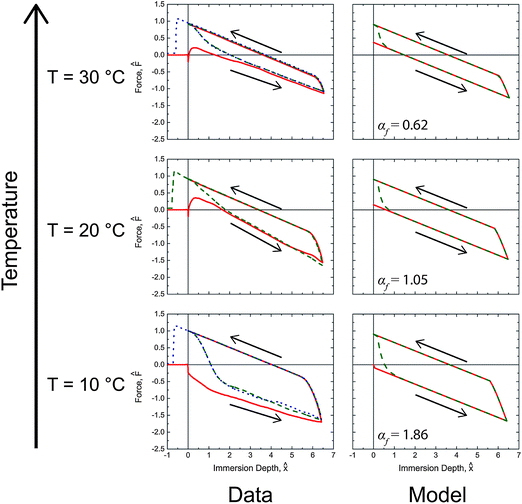 | ||
Fig. 6 Comparison of the predicted values and measurements for the tensiometric force of PEG-functionalized PVA/PAA multilayer films probed with water at 0.01 mm s−1 during immersion and emersion. Solid red ( ), dashed green ( ), dashed green ( ), and dotted blue ( ), and dotted blue ( ) lines correspond to first, second, and third tensiometric cycles, respectively. The values of αf for each condition are shown in the figure. ) lines correspond to first, second, and third tensiometric cycles, respectively. The values of αf for each condition are shown in the figure. | ||
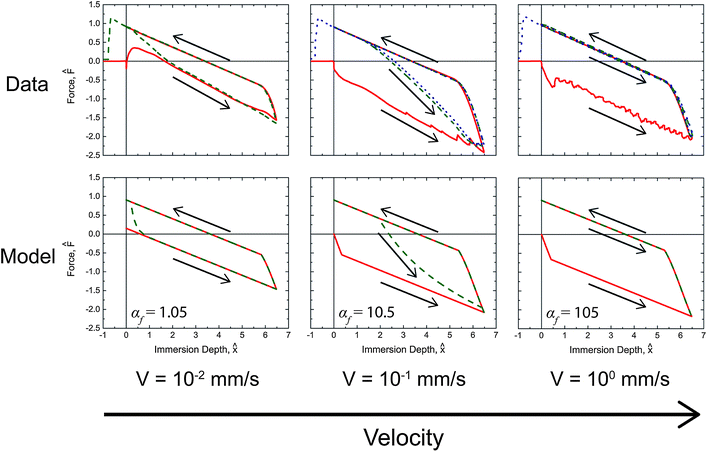 | ||
Fig. 7 Comparison of the predicted values and measurements for the tensiometric force of PEG-functionalized PVA/PAA multilayer films probed with water at 20 °C. Solid red ( ), dashed green ( ), dashed green ( ), and dotted blue ( ), and dotted blue ( ) lines correspond to first, second, and third tensiometric cycles, respectively. The values of αf for each condition are shown in the figure. ) lines correspond to first, second, and third tensiometric cycles, respectively. The values of αf for each condition are shown in the figure. | ||
In general, good agreement is observed between the model and the data. In Fig. 6 the initial advancing contact angle is in agreement with the data, and the fitted activation energy of 40.1 kJ mol−1 captures the temperature dependence of the rearrangement process. The effect of immersion speed is clearly illustrated by Fig. 7. At low wetting speeds (αf ≲ O(1)) the surface rearranges as it is exposed to water and the surface appears hydrophilic (i.e., F0 > 0). However, at high immersion speeds (αf ≫ 1) the surface appears strongly hydrophobic. The onset and duration of the reverse rearrangement is also well predicted by the model for both varying rate and temperature; however, the shape of the force trace during the reverse rearrangement associated with the second and third immersion cycles does not fully agree with the experimental data. The small deviations are most likely a result of some surface rearrangement taking place as the excess water dries from the exposed sample surface, which the model does not account for. The parameter values for the model characterizing the reverse rearrangement are also expected to be less accurate than the corresponding forward rearrangement parameters, because the air temperature and humidity (i.e., the ambient environment in which the reverse rearrangement occurred) was not rigorously controlled. As a result, the surface temperature of the multilayer film during the reverse rearrangement is not necessarily the same as the temperature of the probe liquid. IR thermal imaging of the films during the tensiometer experiment (Fig. S5 in the ESI†), show that at low temperatures (10 °C) the multilayer film is at the liquid temperature during the reverse rearrangement; however, at higher temperatures (40 °C) the multilayer film rapidly cools as a result of evaporation of the water during rearrangement with most of the process occurring at ambient temperatures (∼22 °C).
Conclusions
PEG-functionalized PVA/PAA multilayer films exhibit a transient and reversible contact angle behavior as a result of thermally-activated surface reconstruction. Contact angle goniometry was used to measure and analyze the time evolution of water contact angles over a range of temperatures and a temperature-dependent characteristic time constant (τf) for the forward surface reconstruction (from hydrophobic to hydrophilic) was subsequently extracted. Furthermore, an Arrhenius relationship was used to determine the activation energy (Ea,f = 40.5 kJ mol−1) of the surface reconstruction process from the goniometric data. Utilizing dynamic tensiometry the kinetics of the surface rearrangement could be probed in more detail by immersing (and subsequently withdrawing) glass substrates coated with the multilayer film into (and out of) a reservoir of water at various speeds ranging from 0.01 mm s−1 to 1 mm s−1 and over a range of temperatures from 10 °C to 40 °C. Modeling the forward and reverse surface reconstruction with a first-order rate equation, the activation energies for both of these processes can be determined. The value obtained for the forward surface rearrangement (Ea,f = 40.1 kJ mol−1) agrees well with the goniometric results. The dynamics of this reversible surface switching process could be understood in terms of a single dimensionless grouping αf = τfV/cap that represents a ratio of the time scale for molecular rearrangement (τf) to a characteristic tensiometric time scale for the advancement of the solid–liquid–air interface (cap/V). The experimental measurements and first order model both show that the wettability characteristics of this switchable surface transition from strongly hydrophobic (with a high advancing contact angle at high speeds or low temperatures) to strongly hydrophilic (dominated by surface rearrangements and low contact angles at low speeds or high temperatures) as this dimensionless group is reduced below αf ∼ O(1). This dimensionless group thus plays the same role in dynamic tensiometry as the Deborah number in rheological problems32,33 and characterizes the interplay between the rate of the surface rearrangement process and the observation period. It will be interesting to see how well this idea can be used to understand, quantify and compare the dynamical responses of the wide range of other switchable and reconfigurable surfaces that are currently being developed.
Acknowledgements
We gratefully acknowledge financial support from the Air Force Research Laboratory, Propulsion Directorate, the Air Force Office of Scientific Research, the Army Research Office through contract W911NF-07-D-0004, and the MRSEC program of the National Science Foundation under Award DMR-0819762. H. L. also acknowledges support from the Samsung Scholarship program.References
- A. Vaidya and M. K. Chaudhury, J. Colloid Interface Sci., 2002, 249, 235–245 CrossRef CAS.
- S. Farris, L. Introzzi, P. Biagioni, T. Holz, A. Schiraldi and L. Piergiovanni, Langmuir, 2011, 27, 7563–7574 CrossRef CAS.
- S. R. Holmes-Farley, R. H. Reamey, R. Nuzzo, T. J. McCarthy and G. M. Whitesides, Langmuir, 1987, 3, 799–815 CrossRef CAS.
- J. A. Crowe-Willoughby and J. Genzer, Adv. Funct. Mater., 2009, 19, 460–469 CrossRef CAS.
- A. Horinouchi, H. Atarashi, Y. Fujii and K. Tanaka, Macromolecules, 2012, 45, 4638–4642 CrossRef CAS.
- E. Ruckenstein and S. V. Gourisankar, J. Colloid Interface Sci., 1986, 109, 557–566 CrossRef CAS.
- F. J. Holly and M. F. Refojo, J. Biomed. Mater. Res., 1975, 9, 315–326 CrossRef CAS.
- X. Wang, Z. Chen and Z. Shen, Sci. China, Ser. B: Chem., 2005, 48, 553–559 CrossRef CAS.
- K. Haraguchi, H.-J. Li and N. Okumura, Macromolecules, 2007, 40, 2299–2302 CrossRef CAS.
- K. Haraguchi, H.-J. Li and L. Song, J. Colloid Interface Sci., 2008, 326, 41–50 CrossRef CAS.
- Y. Wang, Q. Dong, Y. Wang, H. Wang, G. Li and R. Bai, Macromol. Rapid Commun., 2010, 31, 1816–1821 CrossRef CAS.
- J. K. Pike, T. Ho and K. J. Wynne, Chem. Mater., 1996, 8, 856–860 CrossRef CAS.
- M. Morra, E. Occhiello and F. Garbassi, J. Colloid Interface Sci., 1992, 149, 84–91 CrossRef CAS.
- M. Morra, E. Occhiello, R. Marola, F. Garbassi, P. Humphrey and D. Johnson, J. Colloid Interface Sci., 1990, 137, 11–24 CrossRef CAS.
- H. S. Van Damme, A. H. Hogt and J. Feijen, J. Colloid Interface Sci., 1986, 114, 167–172 CrossRef CAS.
- B. D. Ratner, P. K. Weathersby, A. S. Hoffman, M. A. Kelly and L. H. Scharpen, J. Appl. Polym. Sci., 1978, 22, 643–664 CrossRef CAS.
- L. Lavielle and J. Schultz, J. Colloid Interface Sci., 1985, 106, 438–445 CrossRef CAS.
- S. R. Holmes-Farley and G. M. Whitesides, Langmuir, 1987, 3, 62–76 CrossRef CAS.
- A. Marmur, Soft Matter, 2006, 2, 12–17 RSC.
- H. Yasuda, A. K. Sharma and T. Yasuda, J. Polym. Sci., Polym. Phys. Ed., 1981, 19, 1285–1291 CrossRef CAS.
- R. H. Dettre and R. E. Johnson, in Contact Angle, Wettability, and Adhesion, American Chemical Society, 1964, vol. 43, pp. 136–144 Search PubMed.
- R. E. Johnson and R. H. Dettre, J. Phys. Chem., 1964, 68, 1744–1750 CrossRef CAS.
- A. W. Neumann and R. J. Good, J. Colloid Interface Sci., 1972, 38, 341–358 CrossRef CAS.
- F. Y. Lewandowski and D. Dupuis, J. Non-Newtonian Fluid Mech., 1994, 52, 233–248 CrossRef CAS.
- J. Chappuis and J. M. Georges, J. Chim. Phys. Phys.-Chim. Biol., 1974, 71, 567–575 CAS.
- P. G. De Gennes, F. Brochard-Wyart and D. Quéré, Capillarity and wetting phenomena: drops, bubbles, pearls, waves, Springer, 2003 Search PubMed.
- H. Lee, M. L. Alcaraz, M. F. Rubner and R. E. Cohen, ACS Nano, 2013, 7, 2172–2185 CrossRef CAS.
- B. Zdyrko, K. Swaminatha Iyer and I. Luzinov, Polymer, 2006, 47, 272–279 CrossRef CAS.
- H. Lee, R. Mensire, R. E. Cohen and M. F. Rubner, Macromolecules, 2012, 45, 347–355 CrossRef CAS.
- P. J. Flory, Principles of polymer chemistry, Cornell University Press, Ithaca, 1953 Search PubMed.
- A. De La Rosa, L. Heux and J. Y. Cavaillé, Polymer, 2001, 42, 5371–5379 CrossRef CAS.
- M. Reiner, Phys. Today, 1964, 17, 62 CrossRef.
- R. F. Probstein, Physicochemical hydrodynamics: an introduction, Wiley, New York, 2nd edn, 1994 Search PubMed.
Footnotes |
| † Electronic supplementary information (ESI) available. See DOI: 10.1039/c3sm50596k |
| ‡ These authors contributed equally. |
| This journal is © The Royal Society of Chemistry 2013 |