 Open Access Article
Inhomogeneities and local chain stretching in partially swollen networks
Walter
Chassé
*a,
Sandra
Schlögl
b,
Gisbert
Riess
c and
Kay
Saalwächter
*a
aInstitut für Physik – NMR, Martin-Luther-Universität Halle-Wittenberg, Betty-Heimann-Str. 7, D-06120 Halle, Germany. E-mail: walter.chasse@physik.uni-halle.de; kay.saalwaechter@physik.uni-halle.de
bPolymer Competence Center Leoben GmbH, Roseggerstrasse 12, Leoben 8700, Austria
cInstitute of Chemistry of Polymeric Materials, University of Leoben, Otto Glöckel-Strasse 2, Leoben 8700, Austria
First published on 10th April 2013
Abstract
According to classic single-chain theories of rubber elasticity such as the affine or phantom models, the length N and the state of stretching R/R0 of network chains are directly reflected in the magnitude of segmental orientation correlations, as quantified by a dynamic order parameter S ∝ R2/N (this relation holds for chains in the bulk and θ solvent). S can be determined by suitable NMR techniques, and is a viable molecular probe of the network structure, as it is directly proportional to the elasticity modulus. Furthermore, previous studies (see Saalwächter et al., Soft Matter, 2013, XX, XXX, in this issue for a review) have convincingly demonstrated the validity of the phantom model for the prediction of S in equilibrium-swollen networks. We here investigate changes in the degree of local chain stretching reflected in S as a function of the degree of (partial) swelling Q = V/V0 in different networks prepared in bulk and in states of increasing dilution. Previous work has already revealed a non-monotonic dependence of S on Q, indicating strongly subaffine local deformation in the early stages of swelling. The width of the distribution in S is also accessible, and increases significantly during the early stage of swelling, indicating the well documented presence of swelling heterogeneities. We find that beyond this early stage, the network chains deform affinely. A back-extrapolation of the affine deformation range to zero swelling allows for conclusions on the actual crosslink density of the networks corrected for the effect of topological or packing constraints, which we refer to as the “phantom reference state” of a bulk network. Deviations of the network elasticity from this state constitute non-classical contributions, possible origins of which are discussed.
1 Introduction
An important property of flexible polymer chains is their elasticity, which is based on the interplay of the coupling of their conformation with external stress and thermal motions. Various molecular theories of rubber elasticity have been developed in order to describe their elastic response to deformation, i.e., uniaxial stretching and isotropic swelling, with respect to the molecular structure of the network.1,2 The most prominent are the affine3,4 and the phantom models.5,6As opposed to the affine model assuming fixed junctions, the phantom model allows for fluctuations of crosslinks around their average position, constrained only by connectivity but not by next-neighbor packing. Thus, the fluctuations strongly depend on the crosslink functionality. A variety of mechanical studies demonstrate that the elastic properties of real polymer networks are between these two limiting extremes.7,8 The interpenetration of individual network strands whose Gaussian chain conformation is not affected by crosslinking9 causes topologically neighboring crosslinks to be more remote than spatial neighbors,10 and topological constraints such as next-neighbor packing or entanglements should affect the spatial range of crosslink fluctuations. In real networks the magnitude of the latter is thus smaller than that predicted by the phantom model and the topological interactions contribute directly to the modulus.11,12 The concept of restricted crosslink fluctuations is supported by the results of mechanical studies7,13 and the experimentally determined range of crosslink fluctuations, which is smaller than theoretical predictions.14
In swelling experiments the solvent uptake leads to an isotropic dilation of the network. The classical network models mentioned above assume an affine deformation of the individual network strands (note that the phantom model also predicts an affine deformation of the average crosslink positions). However, the results of simulations and experimental studies raise doubts on this assumption.15–20 The overall swelling process is found to be sub-affine especially at low degrees of swelling, meaning that on a microscopic scale the network does not deform as the whole sample. Particularly the change of the radius of gyration of network strands upon swelling was found to be significantly smaller than that expected from affine deformation.21,22 These observations were explained in terms of a desinterspersion process,19,23,24 which can be interpreted as a topological unfolding.25 During the progressive swelling, solvent molecules replace monomer units of network chains separating the individual network strands and thus the mutual interpenetration. Thereby it is assumed that the network can swell up to a certain degree without change of the chain conformation, i.e., the crosslink separation (end-to-end distance) and the radius of gyration.23,26 Only at higher swelling degrees the swelling process is dominated by local chain stretching.24
The desinterspersion process is highly dependent on the network structure and thus on the preparation conditions. Network inhomogeneities created during the crosslink reaction are frozen-in by the permanent chemical interconnection of the polymer chains and cannot be released. This leads to large-scale network heterogeneities in swollen networks27 which are observed as frozen-in concentration fluctuations.28,29
In the present work, we investigate the progressive swelling of PDMS networks prepared by random crosslinking and end-linking in solution as well as radiation crosslinking in bulk, and of natural (NR) and isoprene (IR) rubber samples by 1H double-quantum (DQ) NMR30 and equilibrium swelling experiments. The NMR experiments are performed at well-defined swelling degrees and evaluated in terms of residual dipolar coupling constant distributions, which directly reflect the magnitude and distribution of segmental orientation correlations, as quantified by a segmental average dynamic order parameter S. This quantity is directly related to the state of stretching of the network chains, and its distribution over the ensemble of segments (monomers) reports on the sample heterogeneity.
The results are discussed in terms of a two-stage swelling process first observed by Cohen-Addad,18,19 who however used a less quantitative NMR technique. Our own previous work on swollen networks20 was concerned with the NMR detection of swelling heterogeneities, but our results were also subject to systematic errors related to a non-optimal data analysis. Relying on improved procedures,31 we are now in a position to study quantitatively the state of chain stretching and its distribution over the sample, in particular considering the role of network defects, i.e., elastically inactive chains that do not carry load. Previous applications of the improved method lead us to conclude on the validity of the phantom model for equilibrium-swollen networks,32 and on subtle but important effects of the swelling thermodynamics via excluded-volume (solvent quality) effects on the NMR observables,33,34 which will also be discussed in the present context.
We demonstrate that above a swelling threshold Q′, all investigated samples independent of the rather different network structure feature a universal dependence of the local chain stretching on the degree of swelling, which in fact corresponds to affine deformation. The initial, sub-affine stage is characterized by a significant increase of width of the segmental order parameter distribution, and is studied depending on the preparation conditions. We show that the desinterspersion of the network chains upon swelling must be accompanied by the release of entanglement or packing constraints, which in the bulk state also affect a large part of the network defects, rendering them elastically active on rather long timescales unless the network is swollen. Order parameters measured in bulk samples are corrected for packing/topological contributions by a back-extrapolation from the affine deformation range to an unswollen reference state, establishing what we refer to as the “phantom reference network.” The so-obtained results are compared to results of equilibrium swelling experiments and the observations are discussed in the context of the possible non-classical contributions to network elasticity.
2 Experimental section
2.1 Network preparation
We compare different poly(dimethylsiloxane) (PDMS) networks made by end-linking or random crosslinking of accordingly functionalized precursor polymers or by radiation crosslinking of linear PDMS, as well as elastomers based upon natural and synthetic poly(isoprene) rubber.Commercially available randomly vinyl-functionalized (r) and di-vinyl end-functionalized (e) PDMS precursor polymers and appropriate two- and four-functional crosslinker molecules, respectively, were used as-received from ABCR Company for the preparation of PDMS networks. The reaction is performed in the presence of a Pt-based catalyst. The precursor polymers were characterized by gel permeation chromatography (GPC) and liquid-state NMR in order to determine the molecular weight, the polydispersity (PD) and the stoichiometry of the crosslink reaction, respectively. The rPDMS samples were crosslinked in the presence of 20 wt% toluene using different amounts of the two-functional crosslinker to realize different crosslink densities.32 The end-functionalized PDMS precursor polymers, ePDMS-21 (Mn = 4.8 kDa, PD = 2.0) and ePDMS-25R (Mn = 10.6 kDa, PD = 2.1), were crosslinked in solution at different polymer volume fractions, φp,c, using a stoichiometric amount of the four-functional crosslinker and toluene as the solvent. Details on the crosslinking mechanism were published recently.35 The relative weight of the toluene in % as compared to the weight of the polymer is indicated by tXXX in the sample name. The samples crosslinked in the presence of up to 300 wt% toluene were cured for 7 days at room temperature. All samples crosslinked at higher solvent content were cured for 14 days. At the end of the crosslinking time the whole sample volume was gelled and the solvent was evaporated carefully. Completely dry networks were obtained within 2 days up to 14 days, depending on the weight fraction of the solvent.
Radiation-crosslinked PDMS networks were prepared by 10 MeV high-energy electron irradiation (Beta-Gamma-Service, Saal, Germany). The xPDMS-t23 and -t61 networks are based upon linear precursors of Mn ≈ 5 and 50 kDa, respectively, and the applied radiation dose (200, 350 or 500 kGy) is indicated as the last part of the sample name.
Natural (NR) and isoprene rubber (IR) samples were prepared from natural or synthetic latex suspensions, coagulant-dipped and dried to form thin (<1 mm) films and then crosslinked by an innovative UV curing method based upon the thiol–ene reaction using poly-functional thiol and a photoinitiator.36,37 Unlike thermally activated peroxide-crosslinked rubbers,38 which are substantially inhomogeneous, these networks are rather homogeneous and compare well with conventional sulfur-cured NR. Details of the curing conditions, recipes, and a detailed account of the sample properties will soon be published elsewhere. The UV power, irradiation time, and the amount of crosslinker were varied to realize different crosslink densities. The samples are simply numbered indicating increasing relative crosslink density. We note that results from conventionally prepared (masticated, roll-milled and sulfur-cured) natural rubber were found to be qualitatively the same, stressing the model character of these samples.
2.2 Experimental procedures
1H double-quantum (DQ) NMR experiments were carried out on a Bruker minispec mq20 spectrometer operating at a 1H resonance frequency of 20 MHz with a 90° pulse length of 2.2 μs and a dead time of 13 μs. The experiments and raw data analysis were performed following previously published procedures.30,31,38,39The experiments on PDMS networks, partially swollen in styrene and (deuterated) toluene, were performed at 308 K, which was shown to be the θ-temperature of PDMS/styrene systems.40 Analogous experiments on NR/IR samples swollen in deuterated toluene were conducted at 343 K. For preparation, about 30 mg of the sol-extracted sample was cut into small pieces and swollen with a well-defined amount of a solvent in a tightly sealed NMR tube. The corresponding swelling degrees, Q, were calculated assuming additive volumes of polymer and solvent.19 The PDMS samples were stored for 1 day in order to equilibrate in agreement with results of swelling kinetics.19
For NR/IR, it is important to consider light- and oxygen-induced degradation reactions upon swelling in toluene.41 A complete exclusion of light and air proved unfeasible; so for each swelling degree a new sample was prepared and measured after about 10 min after adding the solvent, which proved sufficient for equilibration of the small sample pieces.41
Equilibrium swelling experiments were preformed and evaluated as described in our previous work.32,41
2.3 Background of DQ NMR and relation to swelling experiments
In double-quantum (DQ) or more generally, multiple-quantum (MQ) NMR two different signal functions are obtained experimentally as a function of the pulse sequence duration, and analyzed in a combined fashion to obtain (i) the amount of isotropically mobile, thus non-elastic components referred to as defect fraction ωdef, which comprises potential sol (if not extracted), short dangling ends and loop structures, and (ii) the so-called normalized DQ intensity build-up curve. This curve encodes the residual dipolar coupling constant Dres (unit: rad s−1) arising from the non-isotropic orientation fluctuations of actual network chains as well as its potential distribution in an inhomogeneous sample.The through-space 1H–1H dipole–dipole coupling within monomer units is a weak first-order perturbation of the Larmor frequency, and depends on the fixed internuclear distance and on the instantaneous orientation of a given proton pair. This spin interaction is averaged to zero in the case of fast isotropic reorientations, but a finite and well-defined average value Dres remains for monomers in network chains fluctuating between two fixed ends (crosslinks or other topological constraints). In elastomers with chemically simple monomers, Dres is an effective value characteristic of all protons in a given monomer, and is proportional to the dynamic chain order parameter S,
 | (1) |
Importantly, with our method we can not only reliably determine from the DQ build-up curve the structure-averaged Dres described by eqn (1), but also its distribution in an inhomogeneous sample. In this study, it was essential to use a previously published, optimized numerical procedure31 to obtain the precise distribution function of Dres. Below, we will mostly discuss the numerically calculated standard deviation σ of the distribution in terms of its dimensionless width parameter σrel = σ/Dres with respect to the arithmetic distribution average.
Based upon the mentioned model considerations,39 and realizing that R02 = Nl2, Dres can be related to the (apparent) network chain molecular weight Mc ∼ N, e.g.,
 | (2) |
For NR, the reference coupling in the numerator is 617 Hz. The functionality of the crosslinks f enters through application of the phantom model, which was recently shown to provide an improved correlation even in the bulk.32 The phantom model also predicts the following relation for Mc obtained from equilibrium swelling experiments,
 | (3) |
2.4 Network characterization results
All samples were investigated by equilibrium swelling experiments and by DQ NMR measurements on dry and equilibrium swollen networks in order to obtain information about the network structure and in particular the amount of non-elastic defects. For the solution-crosslinked ePDMS sample series, the sol fraction ωsol extracted during the swelling experiments is on the order of a few percent (2–4%) for networks crosslinked in the bulk (φp,c = 1) up to polymer fractions of φp,c ≈ 0.15. Only at lower polymer concentration considerably larger sol fractions (10–40%) are observed for the ePDMS-25R samples. The rather low extracted sol fractions demonstrate that both ePDMS series are characterized by a very good conversion of the precursor chains over a broad range of dilutions during the crosslink reaction. This is also confirmed by the nearly complete consumption of the crosslinker and the terminal vinyl-groups observed during investigations of reaction kinetics.35The defect fraction, ωdef, determined by DQ NMR on dry samples, reveals a similar dependence on the polymer fraction during crosslinking, φp,c, as shown in Fig. 1a. The defect fraction of roughly 2% is observed over a broad range of dilutions (φp,c = 1–0.15) for both sample series, and a significant increase of the estimated defect fraction is only observed for samples crosslinked at lower φp,c, especially for the ePDMS-25R networks.
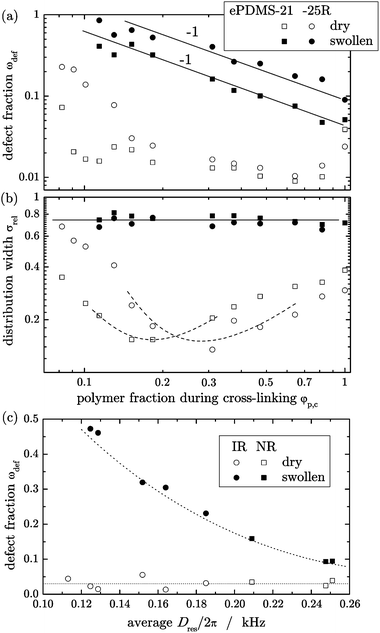 | ||
| Fig. 1 (a) Weight fraction of network defects, ωdef, determined by DQ NMR in dry and equilibrium swollen ePDMS-21 and -25R networks, along with (b) the variation of the relative width of the coupling constant distribution, σrel, depending on the polymer volume fraction during crosslinking, φp,c. Both plots are double-logarithmic. (c) Defect fraction found in dry and swollen NR and IR as a function of NMR crosslink density ∼Dres. All lines just guide the eye; the solid lines in (a) suggest a ωdef ∼ φp,c−1 dependence. | ||
The defect fractions determined in the equilibrium swollen networks differ from those determined in the corresponding dry networks by about one order of magnitude, as demonstrated in Fig. 1a. The defect fractions decrease with increasing polymer volume fractions during crosslinking φp,c for both series of end-linked networks, and appear to follow an inverse proportionality. The discrepancy between defect fractions found in the swollen vs. the dry state is particularly large for intermediate polymer volume fractions (φp,c = 0.7–0.15), which corresponds to previous observations in randomly crosslinked PDMS networks made from short precursor chains.32
The apparent relative distribution width σrel (Fig. 1b) determined in dry samples, reporting on the spatial distribution of crosslinks, features a non-monotonic dependence on the amount of diluent during crosslinking, going through a minimum. In the high-concentration region, ranging from bulk down to polymer fractions of φp,c = 0.15 the distribution width narrows continuously. The narrowest observed distribution widths σrel are about 0.15 and 0.13 for ePDMS-21 and ePDMS-25R, respectively, which are less than half of the distribution width of the respective bulk crosslinked samples. Such rather small values are usually observed for natural rubber prepared of high molecular weight precursor chains,39 and also for the NR and IR samples studied herein.
We attribute the higher inhomogeneities at high preparation concentration to insufficient mixing of the reactants when the viscosity is high. The higher relative distribution width at low concentration may indicate inhomogeneities arising from the formation of micro-gels and local sub-networks before a percolated structure is formed in a more dilute system. Also in this range, the network chains are partially swollen in their own defects, and we note that the dry-state defect content (Fig. 1a) and the corresponding inhomogeneity (Fig. 1b) exhibit similar trends in the different samples. The even higher σrel values measured in the equilibrium swollen state of all networks support this point. We earlier attributed this presumably universal feature to swelling inhomogeneities.20 In this work, making use of the new and more reliable numerical procedure to characterize such rather wide Dres distributions and thus their average,31 we are in a better position to draw quantitative conclusions from the average Dres(Q) values.
Finally, Fig. 1c reports defect fractions for the NR and IR samples as a function of their crosslink density. In agreement with earlier findings for conventional sulfur-vulcanized NR,38 the apparent defect fractions in the dry state are always rather low, but increase substantially upon swelling, in particular at lower crosslink density. We stress that the sample series investigated herein covers the lower range of application-relevant crosslink densities.
3 Results and discussion
The main focus of the present work is the study of the local chain stretching of polymer networks reflected in the segmental orientation S ∝ Dres upon swelling over a broad range of swelling degrees ranging from the dry state to the equilibrium swollen state. First, the results are discussed in terms of Cohen-Addad's two-stage scenario of the swelling process,18,19 and a universal affine relation between the determined Dres and the degree of swelling beyond a certain swelling threshold is demonstrated. In the second part, the influence of the solvent quality and the preparation conditions on the progressive network swelling is discussed. We find that previous conclusions on a general dependence of the phenomenon on the polymer concentration at preparation19 need to be refined, in particular in light of the large defect fractions of typical samples.3.1 Two-stage swelling and affine stretching at high swelling
Fig. 2a shows the apparent average Dres of ePDMS-21 networks, end-crosslinked in solution at different polymer volume fractions, φp,c, at various degrees of swelling in a good solvent (toluene). Analogous results were obtained for the second series of networks end-linked in solution, ePDMS-25R. Varying dependencies of Dres on Q are observed, which correspond qualitatively to results in the literature.19,20,42 Deviations from the literature data, in particular in the initial part, are however apparent, and we stress the better reliability of the present data analysis. This concerns the precise consideration (subtraction) of non-elastic defects and the robust distribution analysis.31 We note that the increase of the apparent defect fraction to the swollen-state plateau value shown in Fig. 1 roughly occurs during the first stage. Specifically for the more defect-rich lowly crosslinked (lower Dres (Q = 1)) samples, the initial decrease of Dres would be even more pronounced if the growing Dres = 0 defect fraction were not subtracted and considered in the plotted average value. In the second regime, the plotted Dres safely represents a constant fraction of elastically active network chains, while in the first regime, a varying amount of defects with slow chain relaxation time contributes to the average.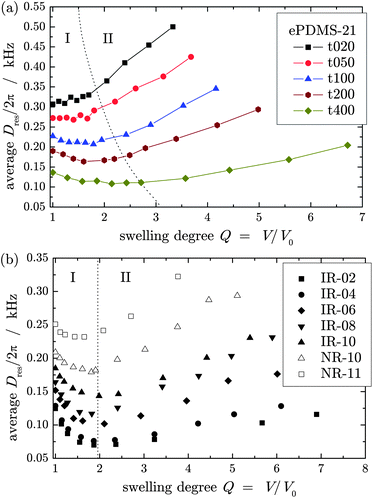 | ||
| Fig. 2 Average residual dipolar coupling constant, Dres, as a function of the swelling degree, Q, for (a) PDMS networks end-crosslinked in solution at different polymer volume fractions and (b) natural and synthetic poly(isoprene) rubbers. | ||
PDMS networks crosslinked at low polymer concentrations as well as all NR and IR samples show a distinct decrease of the coupling constant upon swelling. As φp,c increases, the decrease of Dres is less pronounced and for the samples crosslinked at φp,c > 0.6 even a slightly positive slope is observed, in contrast to Cohen-Addad's observations.18,19 For an interpretation, the first stage at low swelling is often discussed in terms of a strongly subaffine desinterspersion process,19,23,24 which can be interpreted as a topological unfolding of the network strands induced by the swelling solvent.25 This will be addressed in the second part.
Beyond a certain swelling degree Q′ represented by the dotted line in Fig. 2 all networks feature a similar, monotonically increasing dependence of the coupling constant on the swelling degree, suggesting actual chain stretching in the second stage. For the end-linked PDMS series, a systematic change of Q′ is observed, indicating a dependence of Dres(Q) at low swelling degrees on preparation conditions of the networks which will be discussed below. For all IR and NR samples a qualitatively similar dependence of Dres on Q is observed, as shown in Fig. 2b. Starting from the dry samples the coupling constant decreases upon swelling up to a certain swelling degree threshold Q′. The latter has a constant value for all investigated rubber samples as indicated by the dotted line in Fig. 2b.
A log–log representation of the data (see Fig. 6) reveals that the monotonic increase can be described by a power-law for all investigated samples, with a scaling exponent νdef describing the local chain stretching of elastically active network strands. Simple geometric considerations assuming an affine deformation of junction distances R, using Dres ∝ R2 and Q ∝ R3, predict a strict monotonic increase of Dres ∼ Q2/3, thus νdef = 2/3. This is obviously violated in the first stage to different degrees by most samples.
For an objective test of possibly uniform deformation behavior, the second-stage data from all samples were fitted to a power-law,
| Dres(Q) = Dres,nQνdef | (4) |
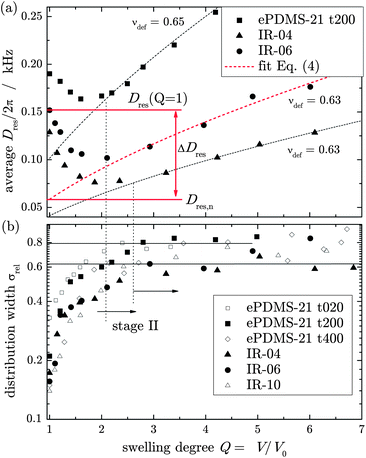 | ||
| Fig. 3 (a) Comparison of Dres(Q) dependencies for different samples, along with fits of the second-stage data to eqn (4). (b) The relative distribution width σrel grows with Q in the first stage but is nearly constant in the second stage, indicating uniform deformation of the whole inhomogeneous network structure. | ||
Of course in the first stage, a distinct broadening of the Dres distribution upon swelling, attributed to the appearance of swelling heterogeneities,20 is observed for all samples. Fig. 3a also shows that the fitted Dres,n deviates considerably from the value determined in the corresponding dry sample, Dres (Q = 1). The difference characterizes the first-stage affinity; a quantification of the associated release of topological constraints will be presented in the second part.
The finding of affinity in the second stage is universal, as is demonstrated by a log–log plot of a normalized Dres(Q)/Dres,nvs. Q for the second stage of all investigated samples; see Fig. 4. Again, only weak deviations towards slightly subaffine behavior are evidenced. This also suggests a specific physical meaning of the coupling constant, Dres,n, from the power law fit to the late-stage swelling, back-extrapolated to a hypothetical network state at Q = 1 for all samples, which were prepared in rather different ways. This will be addressed in the second part.
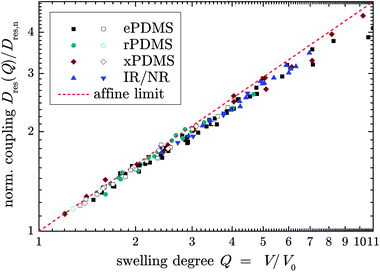 | ||
| Fig. 4 Log–log plot of second-stage Dres data normalized with respect to the back-extrapolated coupling constant, Dres,n, as a function of Q for various samples swollen in good (solid symbols) and θ solvents (open symbols). The dashed line has a slope of 2/3 and indicates the affine prediction. | ||
For a more detailed picture, the full Dres distribution functions were examined directly depending on Q. Fig. 5a shows the distributions of a solution end-linked PDMS network and a synthetic rubber, rPDMS-25R t020 and IR-10, respectively, determined at different degrees of swelling, Q. The dry samples (Q = 1) feature a rather narrow distribution, indicating a homogeneous network structure and thus distribution of crosslinks. Owing to swelling, the distributions are broadened, involving higher and lower coupling constants with respect to the dry sample. Especially the high-coupling contribution rises, which directly illustrates the increased residual order of the load-carrying network strands due to the chain stretching upon swelling. At low and intermediate swelling degrees the maxima of the distributions, representing the most probable chain order, are shifted slightly towards lower coupling constants whereas at higher swelling degrees above Q′ the opposite is observed.
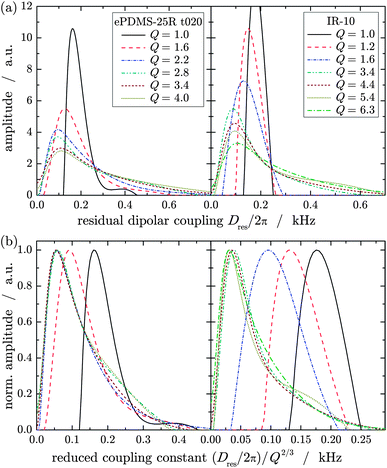 | ||
| Fig. 5 (a) Coupling constant distributions of ePDMS-25R t020 and IR-10 determined at different swelling degrees, Q, and (b) the same distributions normalized to their maximum amplitude plotted vs. a coupling constant reduced with respect to affine deformation. | ||
In order to compare the Dres distributions at different Q, they were normalized with respect to their maximum amplitude and plotted depending on a reduced Dres scaled by Q−2/3 of the corresponding swelling degree implying the assumption of an affine network deformation. The so-obtained distributions differ significantly at low and intermediate swelling degrees as depicted in Fig. 5b. This emphasizes again the non-affine increase or even decrease of Dres and the broadening of the distribution parameterized by σrel. However, at higher swelling degrees beyond Q′, the distributions are in very good agreement over their entire width, which is especially highlighted by the nearly perfect coincidence of the maxima. Thus, the whole inhomogeneous structure of a network, irrespective of its structure or preparation condition, is deformed affinely beyond the threshold swelling degree Q′.
3.2 Low and intermediate degrees of swelling
The observed behavior of the apparent chain stretching as reflected in Dres in the first stage of the swelling process at low swelling degrees is usually discussed in terms of chain desinterspersion, as mentioned above. During swelling, the solvent molecules replace monomer units of the network chains which represent their own solvent in dry polymer networks,19 leading to a separation of the individual network strands. As indicated by scattering studies, this can proceed through topological unfolding without any change of the conformation of the network chains,23,25,26 meaning that the end-to-end distance of the individual network strands does not necessarily change. The changes in Dres can therefore be complex and the question arises whether single-chain approaches are applicable to describe the first stage.Cohen-Addad et al.,19 based upon his sample series, has concluded a universal Dres(Q) behavior that scaled vertically from sample to sample with the respective polymer volume fraction φp,c during crosslinking. We now find that the initial decay of Dres(Q) is not universal and that its dependence on preparation conditions is more complex. A log–log plot of representative data, see Fig. 6, shows that a power law appears applicable in the first stage, but that it is not only the prefactor but also the exponent that varies with the concentration at preparation, φp,c. In agreement with Cohen-Addad's work, we find that the crossover swelling degree Q′ is the same for different precursor polymers and depends only on φp,c. However, we find a power-law dependence Q′ ∼ φp,c−0.25±0.02, in contrast to an exponent of −5/8 reported in the earlier work, which was motivated by a scaling idea based on the c* theorem.19
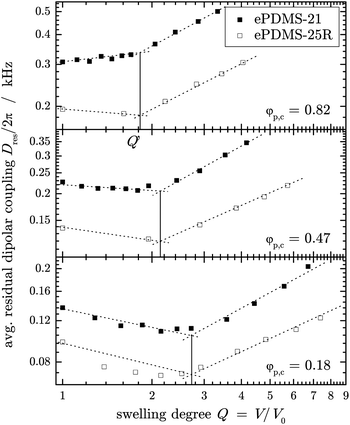 | ||
| Fig. 6 Comparison of Dres(Q) for networks prepared from different molecular weight pre-polymers, ePDMS-21 and ePDMS-25R, end-crosslinked in solution at different polymer concentrations, φp,c, in log–log representation. The dotted lines are power-law fits, and the vertical solid lines represent the crossover swelling degrees Q′. | ||
Strikingly, the latex-based UV-crosslinked NR and IR samples investigated herein, as well as conventional (roll-milled) sulfur-vulcanized NR (data not shown), exhibit more or less the same negative initial slopes of Dres(Q), although these samples were crosslinked in the bulk and had a widely varying defect content. Another option for network formation in the bulk used herein is radiation crosslinking using an electron beam. Corresponding xPDMS sample data are compared in Fig. 7 with data of ePDMS samples that have almost matching trends in the high-Q region. The xPDMS samples exhibit affine behavior over the whole Q range, apparently complementing the trend seen for the ePDMS series towards high φp,c (see Fig. 2a). The big difference between the NR/IR and xPDMS samples is probably due to the rather inhomogeneous structure of the latter, as inferred from the large values of σrel = 0.6 and 0.8, and the comparably high defect fractions (about 0.1–0.4) in the dry state. As mentioned, these networks are to a degree swollen in their own defects, unfolding the swelling inhomogeneities and masking the first stage. Nevertheless, the widely different trends observed in the NR/IR samples and the PDMS samples suggest that there is no simple and universal dependence of the first-stage behavior on just the network chain dimensions.
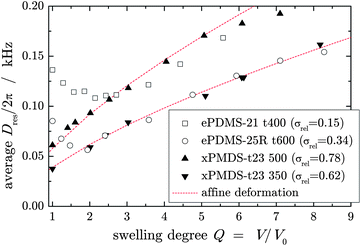 | ||
| Fig. 7 D res(Q) for two radiation-crosslinked xPDMS samples compared to two solution end-linked ePDMS samples chosen to approximately match in the second stage of swelling. The lines are fits of eqn (4) with constant exponent 2/3 to the xPDMS sample data over the whole data range. | ||
Another possible issue in interpreting the initial behavior or Dres(Q) is thermodynamic in nature. If a topological desinterspersion process occurred without changes in the chain dimension R,23,26Dres ∼ R2 would a priori be constant in the first stage. A decrease could then be explained by excluded-volume effects arising upon swelling in a good solvent (removing the excluded-volume screening in the melt state), as shown in one of our earlier publications.33 There, we have for the first time compared Dres(Q) for swelling in good vs. θ solvent, supporting the assumption. However, the data were subject to systematic errors related to the then not yet sufficiently robust distribution analysis; so we show improved data in Fig. 8.
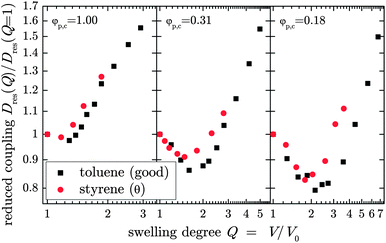 | ||
| Fig. 8 D res(Q) for three ePDMS-21 samples prepared at different concentrations, comparing swelling in good (toluene) and θ solvents (styrene at 308 K). | ||
Clear differences between good (toluene) and θ (styrene at 308 K (ref. 40)) solvents are indeed observed; yet these are restricted to the high-Q stage, where Dres(Qeq) at swelling equilibrium Qeq follows our expanded theoretical treatment covering the good as well as θ solvent ranges.33,34 Importantly, virtually no differences are observed in the first stage, which rules out excluded-volume effects as the origin of the negative slope, and leaves us with a possible desinterspersion or a release of “packing constraints”, as initially assumed.
In quantifying the “non-classical” contribution to the segmental orientation correlations Dres and thus to the linear-regime elasticity measured in bulk samples, we turn to a closer analysis of the back-extrapolated values Dres,n, obtained by fits to the affine second stage using eqn (4). In Fig. 9, where both quantities are plotted vs. the apparent crosslink density from swelling experiments, we find non-zero intercepts for the former, but near-zero intercepts for the latter. In previous works,32,38,41 the non-zero intercept has been interpreted as entanglement contribution, and a very recent study43 confirms that this contribution to the elasticity modulus can be successfully extracted using the non-linear Mooney–Rivlin analysis. Strikingly, the Dres,n values are proportional to the crosslink density estimated by swelling virtually without intercept. For the few samples investigated in θ solvent, the data indicates an intercept even closer to zero, confirming that the slightly lower good-solvent values arise from the excluded-volume effect on Dres. Obviously, this effect on the absolute value of Dres,n is rather small. Both quantities, Dres and Dres,n, may well be influenced by topologically trapped entanglements, which are physical but elastically active crosslinks contributing also in the high-deformation range. In any way, the correlation shows that Dres,n has a well-defined physical meaning, reflecting the true crosslink density. Since our previous work has demonstrated the good applicability of the phantom model for swollen samples,32,34,41,44 we refer to Dres,n as describing the “phantom reference state” of a network. The deviation from the actual bulk value, ΔDres = Dres − Dres,n, thus provides a measure for the non-classical elasticity contributions. For all observed samples, the data in Fig. 9 suggest this contribution to be almost independent of crosslink density, but dependent on the sample nature.
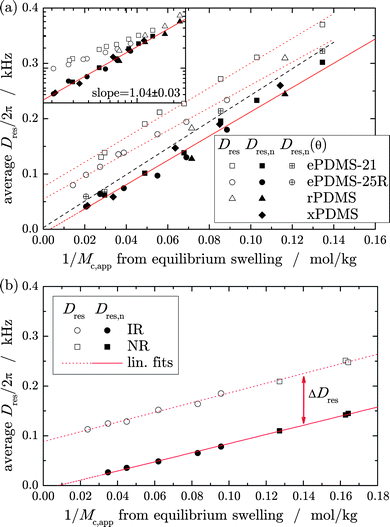 | ||
| Fig. 9 Average residual coupling Dres determined in dry networks (open symbols), and the respective back-extrapolated values, Dres,n, obtained by evaluation of the late-stage swelling data according to eqn (4) (filled symbols), both as a function of the apparent crosslink density from swelling experiments given by eqn (3) for the (a) PDMS sample series and (b) the IR/NR series. The lines are linear fits. The log–log inset in (a) further supports the fact that the difference between the two quantities is mainly due to an almost constant contribution ΔDres that becomes negligible for the relations at high crosslink density. | ||
We end this paper with a discussion of the possible contributing factors to ΔDres. One possible scenario is that the crosslink fluctuations around their mean position that enter the phantom model could be constrained by surrounding chains in the bulk network,11 and be released upon swelling. Considering that the fluctuations are a priori not dependent on the degree of deformation,45 this means that the phantom-model correction factor for the crosslink density (more precisely: network chain density ∼1/Mc) could be different from the phantom prediction (f − 2)/2 in eqn (2) and (3). In the first stage, a continuous decrease could be expected from a starting value close to its affine fixed-junction limit of 1 down to a value of 0.5 (for a crosslink functionality f = 4), or even less when the average f is lower, as is the case for the lower crosslinked defect-rich PDMS samples based on short precursors.32 SANS studies have in fact shown that fluctuations of crosslinks around their average position are of smaller magnitude in dry networks than those predicted by the phantom model,14 while diffusion NMR results have confirmed enhanced segmental mobility in the swollen state.46 Furthermore, mechanical studies of solution-crosslinked samples have indicated an elasticity modulus that is larger than the phantom prediction.8
As to the origin of constraints, one could intuitively assume that topologically remote but spatially close crosslinks play an important role. Thus, the crosslink density itself could be a measure of the constraints on crosslink fluctuations.47 Thus, for samples with lower crosslink density in the dry state the decrease of Dres at low swelling degrees should be less pronounced. From Fig. 2, we however take that this is not the case; for all samples of this study, the initial decrease is most pronounced for the samples with lowest crosslink density.
We also stress that such prefactor-based arguments would mainly change the slope of Dres in Fig. 9, but not necessarily lead to an intercept, as can be inferred from eqn (2). Note that the phantom prefactor cancels from a comparison of Dres measured in the bulk and 1/Mc,app from equilibrium swelling, eqn (3) only when the phantom model is applicable in both states. Otherwise, the slope would change. We remind again that most of the discussed Dres,n values are specific for good solvent, and that (ultimately better comparable) values obtained for θ solvent are slightly higher, which adds a weak bias to these arguments.
In trying to interpret the data in Fig. 9, we stress that the relative contribution of ΔDres to the total Dres is considerably smaller for PDMS than for NR/IR at comparable crosslink density. This is in fact in line with a simple dependence on the entanglement molecular weight, which is usually taken to contribute as Dres ∝ G ∼ 1/Mc + 1/Me to both NMR and the elasticity modulus G. Since Me is about 2–3 times higher for PDMS than for NR/IR, the observed trend could be explained. We further note that ΔDres shows some dependence on precursor molecular weight, but does not depend on the concentration at preparation, which varies widely. This is not a contradiction to the entanglement argument, as the entangled structure could well depend somewhat on the conformation of the network chains, which are known to be in a “supercoiled” state in deswollen networks prepared in solution.48,49 Also, it is not clear whether the entanglement effect represents the above discussed constraint to mere junction fluctuations, or acts as an additional constraint also in a fixed-junction scenario.
However, the usual entanglement interpretation does not resolve one outstanding problem: the fact that lowly crosslinked dry samples always feature rather low apparent defect fractions even when they have rather high actual defect fractions identified in the swollen state (see Fig. 1). In other words, Dres of weakly crosslinked samples reflects to a significant part anisotropically mobile defects. This is one of the central outstanding problems of the NMR methodology and network physics in general, as it shows that parts of the defect structures have reduced mobility and thus contribute to the elastically active fraction, and thus also to the linear-regime elasticity,43 when embedded in the bulk network matrix. This is primarily a matter of timescale, as the given NMR approach probes the anisotropy of segmental orientation fluctuations roughly on the ms range. Similarly, a polymer chain behaves elastically on a given time or frequency scale only when it cannot relax the internal stress faster than the applied external stimulus. We expect this to be the case only for entangled defects with correspondingly long relaxation times. However, most of the investigated PDMS networks were prepared of rather short pre-polymers, in which the expected defect structures are short dangling chains or short loops32,50 which should not be subject to a significant tube constraint. Similar arguments hold for the defects in NR/IR, where also short loops are expected when a crosslink forms within a given chain.
We suggest this problem to be related to previous deuterium NMR experiments of strained samples, in which even low-molecular deuterated probe chains show a line splitting, thus a motional anisotropy.51 The phenomenon has been explained in terms of a nematic-like mean field, which is in different theoretical approaches hypothesized to represent a second contribution to network elasticity on top of the regular entropy term.24,52,53 Related arguments concerning local ordering of polymer chains have already been a subject in the famous 1979 Faraday Discussion; see for instance the introductory lecture of Flory.54 Now for the given problem, a strained sample exhibits anisotropic excluded-volume interactions, as directly demonstrated by an anisotropic amorphous halo in X-ray scattering,43 and this means that even a large-scale diffusive average of a small probe molecule would not render its orientation fluctuations isotropic. In transferring this argument to the unstrained state and to short pending defect structures, one would have to assume that excluded-volume interactions are also anisotropic in the unstrained state. As isotropy must be restored at large length scales, such a local anisotropy would have to exhibit a correlation length in the nm range, at least corresponding to the length scale probed by the constrained diffusion of pending defects. We anticipate that further experimental and theoretical work along these lines may ultimately help to resolve some of the open questions.
4 Conclusions
We have presented an in-depth NMR study of local orientation correlations of segments in partially swollen networks prepared under different conditions, i.e., end-linking of short PDMS precursors, radiation-crosslinking of different linear PDMS, and random crosslinking of natural and synthetic poly(isoprene) rubber. The method probes the local degree of network chain stretching, and is known to reflect the dry-state crosslink density relevant for the mechanical behavior in linear response. In agreement with earlier work, the local chain stretching has been found to be rather inhomogeneous, and follow a two-stage process upon step-wise swelling. Based upon a reliable data analysis, and the observations of qualitatively different trends in the different sample series, it is concluded that previous observations on the first stage are not universal, but that the second stage is characterized by an affine deformation of average crosslink positions. Based on previous evidence of the applicability of the phantom model in this range, we have established a back-extrapolation procedure of this affine range to a hypothetical “phantom reference state” of the bulk network, which by way of a comparison with results from equilibrium swelling was shown to reflect the true crosslink density of the networks.The deviation of this reference state from the actual dry state observables, e.g. the NMR-based crosslink density or elasticity modulus in the linear regime reflects non-classical contributions to the network elasticity. Our data appear roughly consistent with a constant offset contribution that does not depend on crosslink density, ruling out simple arguments on crosslink-induced constraints to junction fluctuations. Rather, the data appear consistent with the common interpretation as an apparently additive entanglement constraint (noting that deviations are expected for very low crosslink densities if the NMR experiments were conducted at very high temperatures55). A big outstanding problem is however the role of network defects. The lowly crosslinked samples investigated in this study have been shown to exhibit a rather high (often >20%) content of elastically inactive dangling structures when investigated by NMR in the swollen state; however the larger part of these defects contribute to the elastic response reflected in the NMR response of the dry state and also in the mechanical response, at least on timescales up to the ms range. While such defects in many of our samples are not expected to exhibit molecular weights beyond the entanglement threshold, the question as to why they relax so slowly is still to be resolved. We envisage a possible explanation in terms of locally anisotropic excluded-volume constraints that may exhibit a sufficiently high correlation length even in unstrained bulk networks.
These issues will be further investigated in future work, focusing in particular on the correlation of the NMR-determined apparent and true defect fractions with time- or frequency-dependent rheology results. We anticipate that the new concept of the “phantom reference network” established in this study may be of help to resolve relevant open questions in the science of elastomers.
Acknowledgements
The authors thank Jens-Uwe Sommer for discussions and comments.References
- M. Gottlieb and R. J. Gaylord, Experimental tests of entanglement models of rubber elasticity. 2. Swelling, Macromolecules, 1984, 17(10), 2024–2030 CrossRef CAS.
- M. Rubinstein and S. Panyukov, Elasticity of polymer networks, Macromolecules, 2002, 35(17), 6670–6686 CrossRef CAS.
- J. J. Hermans, Deformation and swelling of polymer networks containing comparatively long chains, Trans. Faraday Soc., 1947, 43, 591–600 RSC.
- F. T. Wall and P. J. Flory, Statistical thermodynamics of rubber elasticity, J. Chem. Phys., 1951, 19(12), 1435–1439 CrossRef CAS.
- H. M. James and E. Guth, Theory of the elastic properties of rubber, J. Chem. Phys., 1943, 11, 455–481 CrossRef CAS.
- H. M. James and E. Guth, Theory of the increase in rigidity of rubber during cure, J. Chem. Phys., 1947, 15, 669–683 CrossRef CAS.
- M. Gottlieb, C. W. Macosko, G. S. Benjamin, K. O. Meyers and E. W. Merrill, Equilibrium modulus of model poly(dimethylsiloxane) networks, Macromolecules, 1981, 14(4), 1039–1046 CrossRef CAS.
- Y. Gnanou, G. Hild and P. Rempp, Molecular structure and elastic behavior of poly(ethylene oxide) networks swollen to equilibrium, Macromolecules, 1987, 20(7), 1662–1671 CrossRef CAS.
- M. Beltzung, C. Picot, P. Rempp and J. Herz, Investigation of the conformation of elastic chains in poly(dimethylsiloxane) networks by small-angle neutron scattering, Macromolecules, 1982, 15(6), 1594–1600 CrossRef CAS.
- K. L. Ngai and C. M. Roland, Junction dynamics and the elasticity of networks, Macromolecules, 1994, 27(9), 2454–2459 CrossRef CAS.
- P. J. Flory, Theory of elasticity of polymer networks. The effect of local constraints on junctions, J. Chem. Phys., 1977, 66, 5720 CrossRef CAS.
- G. Ronca and G. Allegra, An approach to rubber elasticity with internal constraints, J. Chem. Phys., 1975, 63(11), 4990–4997 CrossRef CAS.
- L. M. Dossin and W. W. Graessley, Rubber elasticity of well-characterized polybutadiene networks, Macromolecules, 1979, 12(1), 123–130 CrossRef CAS.
- R. Oeser, B. Ewen, D. Richter and B. Farago, Dynamic fluctuations of crosslinks in a rubber: a neutron-spin-echo study, Phys. Rev. Lett., 1988, 60, 1041–1044 CrossRef CAS.
- T. Hölzl, H. L. Trautenberg and D. Göritz, Monte Carlo simulations on polymer network deformation, Phys. Rev. Lett., 1997, 79, 2293–2296 CrossRef.
- M. Pütz, K. Kremer and R. Everaers, Self-similar chain conformations in polymer gels, Phys. Rev. Lett., 2000, 84, 298–301 CrossRef.
- J.-U. Sommer and S. Lay, Topological structure and nonaffine swelling of bimodal polymer networks, Macromolecules, 2002, 35, 9832–9843 CrossRef CAS.
- J. P. Cohen-Addad, M. Domard and J. Herz, NMR observation of the swelling process of polydimethylsiloxane networks – average orientational order of monomeric units, J. Chem. Phys., 1982, 76(5), 2744–2753 CrossRef CAS.
- J. P. Cohen-Addad, M. Domard, G. Lorentz and J. Herz, Polymeric gels. NMR study of elementary chain swelling. Effect of trapped topological constraints, J. Phys., 1984, 45(3), 575–586 CAS.
- K. Saalwächter, F. Kleinschmidt and J. U. Sommer, Swelling heterogeneities in end-linked model networks: a combined proton multiple-quantum NMR and computer simulation study, Macromolecules, 2004, 37(23), 8556–8568 CrossRef.
- H. Benoit, D. Decker, R. Duplessix, C. Picot, P. Rempp, J. P. Cotton, B. Farnoux, G. Jannink and R. Ober, Characterization of polystyrene networks by small-angle neutron scattering, J. Polym. Sci., Polym. Phys. Ed., 1976, 14(12), 2119–2128 CrossRef CAS.
- J. Bastide, R. Duplessix, C. Picot and S. Candau, Small angle neutron scattering and light spectroscopy investigation of polystyrene gels under osmotic deswelling, Macromolecules, 1984, 17, 83–93 CrossRef CAS.
- J. Bastide, C. Picot and S. Candau, Some comments on the swelling of polymeric networks in relation to their structure, J. Macromol. Sci., Part B: Phys., 1981, 19(1), 13–34 CrossRef.
- B. Deloche and E. T. Samulski, Rubber elasticity: a phenomenological approach including orientational correlations, Macromolecules, 1988, 21(10), 3107–3111 CrossRef CAS.
- J. U. Sommer, T. Russ, B. Brenn and M. Geoghegan, Scaling model for the anomalous swelling of polymer networks in a polymer solvent, Europhys. Lett., 2002, 57, 32–38 CrossRef CAS.
- C. Schmit and J. P. Cohen-Addad, NMR approach to the characterization of the swelling process of polyethylene networks, Macromolecules, 1989, 22(1), 142–146 CrossRef CAS.
- J. Bastide and L. Leibler, Large-scale heterogeneities in randomly cross-linked networks, Macromolecules, 1988, 21(8), 2647–2649 CrossRef CAS.
- S. Koizumi, M. Monkenbusch, D. Richter, D. Schwahn and B. Farago, Concentration fluctuations in polymer gel investigated by neutron scattering: static inhomogeneity in swollen gel, J. Chem. Phys., 2004, 121(24), 12721–12731 CrossRef CAS.
- M. Shibayama, Small-angle neutron scattering on polymer gels: phase behavior, inhomogeneities and deformation mechanisms, Polym. J., 2010,(1), 1834 Search PubMed.
- K. Saalwchter, Proton multiple-quantum NMR for the study of chain dynamics and structural constraints in polymeric soft materials, Prog. Nucl. Magn. Reson. Spectrosc., 2007, 51(1), 1–35 CrossRef.
- W. Chassé, J. L. Valentín, G. D. Genesky, C. Cohen and K. Saalwächter, Precise dipolar coupling constant distribution analysis in proton multiple-quantum NMR of elastomers, J. Chem. Phys., 2011, 134(4), 044907 CrossRef.
- W. Chassé, M. Lang, J. Sommer and K. Saalwächter, Cross-link density estimation of PDMS networks with precise consideration of networks defects, Macromolecules, 2012, 45(2), 899–912 CrossRef.
- J.-U. Sommer, W. Chassé, J. Lopéz Valentín and K. Saalwächter, Effect of excluded volume on segmental orientation correlations in polymer chains, Phys. Rev. E, 2008, 78, 051803 CrossRef.
- W. Chassé, K. Saalwächter and J.-U. Sommer, Thermodynamics of swollen networks as reflected in segmental orientation correlations, Macromolecules, 2012, 45, 5513–5523 CrossRef.
- M. Kovermann, K. Saalwächter and W. Chassé, Real-time observation of polymer network formation by liquid- and solid-state NMR revealing multistage reaction kinetics, J. Chem. Phys., 2012, 116(25), 7566–7574 CAS.
- S. Schlögl, A. Temel, R. Schaller, A. Holzner and W. Kern, Prevulcanization of natural rubber latex by UV techniques: a process towards reducing type IV chemical sensitivity of latex articles, Rubber Chem. Technol., 2012, 83, 3478–3486 Search PubMed.
- S. Schlögl, A. Temel, R. Schaller, A. Holzner and W. Kern, Characteristics of the photochemical prevulcanization in a falling film photoreactor, J. Appl. Polym. Sci., 2012, 124, 3478–3486 CrossRef.
- J. L. Valentín, P. Posadas, A. Fernández-Torres, M. A. Malmierca, L. González, W. Chassé and K. Saalwächter, Inhomogeneities and chain dynamics in diene rubbers vulcanized with different cure systems, Macromolecules, 2010, 43, 4210–4222 CrossRef.
- K. Saalwächter, B. Herrero and M. A. López-Manchado, Chain order and cross-link density of elastomers as investigated by proton multiple-quantum NMR, Macromolecules, 2005, 38(23), 9650–9660 CrossRef.
- A. Lapp and C. Strazielle, Un nouveau solvant theta pour le polydimethylsiloxane. Comportement au voisinage des conditions theta et facteur d'expansion, Makromol. Chem., Rapid Commun., 1985, 6(9), 591–596 CrossRef CAS.
- J. L. Valentín, J. Carretero-González, I. Mora-Barrantes, W. Chassé and K. Saalwächter, Uncertainties in the determination of cross-link density by equilibrium swelling experiments in natural rubber, Macromolecules, 2008, 41, 4717–4729 CrossRef.
- J. P. Cohen-Addad, Polymeric-gel swelling: NMR evidence for the c* theorem, Phys. Rev. B, 1993, 48(2), 1287–1290 CrossRef.
- A. Vieyres, R. Pérez-Aparicio, P.-A. Albouy, O. Sanseau, K. Saalwächter, D. R. Long and P. Sotta, Sulfur-cured natural rubber elastomer networks: correlating crosslink density, chain orientation and mechanical response by combined techniques, Macromolecules, 2013, 46, 889–899 CrossRef CAS.
- K. Saalwächter, W. Chassé and J.-U. Sommer, Structure and swelling of polymer networks: insights from NMR, Soft Matter, 10.1039/c3sm50194a.
- H. M. James, Statistical properties of networks of flexible chains, J. Chem. Phys., 1947, 15(9), 651–668 CrossRef CAS.
- V. D. Skirda, M. M. Doroginizkij, V. I. Sundukov, A. I. Maklakov, G. Fleischer, K. Georg Husler and E. Straube, Detection of spatial fluctuations of segments in swollen polybutadiene networks by nuclear magnetic resonance pulsed field gradient technique, Makromol. Chem., Rapid Commun., 1988, 9(9), 603–607 CrossRef CAS.
- C. M. Roland, K. L. Ngai and D. J. Plazek, The viscoelastic behaviour of networks, Comput. Theor. Polym. Sci., 1997, 7, 133–137 CrossRef CAS.
- K. Urayama and S. Kohjiya, Extensive stretch of polysiloxane network chains with random- and super-coiled conformations, Eur. Phys. J. B, 1998, 2, 75–78 CrossRef CAS.
- P. G. De Gennes, Scaling concepts in polymer physics, Cornell University Press, Ithaca, New York, 1979 Search PubMed.
- M. Lang, D. Göritz and S. Kreitmeier, Length of subchains and chain ends in cross-linked polymer networks, Macromolecules, 2003, 36, 4646–4658 CrossRef CAS.
- P. Sotta, B. Deloche, J. Herz, A. Lapp, D. Durand and J.-C. Rabadeux, Evidence for short-range orientational couplings between chain segments in strained rubbers: a deuterium magnetic resonance investigation, Macromolecules, 1987, 20, 2769–2774 CrossRef CAS.
- J.-P. Jarry and L. Monnerie, Effects of nematic-like interaction in rubber elasticity theory, Macromolecules, 1979, 12, 316–320 CrossRef CAS.
- F. T. Oyerokun and K. S. Schweizer, Microscopic theory of orientational order, structure and thermodynamics in strained polymer liquids and networks, J. Chem. Phys., 2004, 120, 475–485 CrossRef CAS.
- P. J. Flory, Levels of order in amorphous polymers, Faraday Discuss. Chem. Soc., 1979, 68, 14–25 RSC.
- M. Lang and J.-U. Sommer, Analysis of entanglement length and segmental order parameter in polymer networks, Phys. Rev. Lett., 2010, 104, 177801 CrossRef CAS.
| This journal is © The Royal Society of Chemistry 2013 |
