 Open Access Article
 This Open Access Article is licensed under a Creative Commons Attribution-Non Commercial 3.0 Unported Licence
Impact of solvation on equilibrium conformation of polymer brushes in solvent mixtures
Rosa M.
Espinosa-Marzal†
a,
Prathima C.
Nalam†‡
a,
Sreenath
Bolisetty
b and
Nicholas D.
Spencer
*a
aLaboratory for Surface Science and Technology, Department of Materials, ETH Zurich, Wolfgang-Pauli-Strasse 10, CH-8093 Zurich, Switzerland. E-mail: nspencer@ethz.ch; Fax: +41-44-633-1027; Tel: +41-44-632-5850
bLaboratory of Food and Soft Materials, Department of Health Science and Technology, ETH Zurich, Schmelzbergstrasse 9, CH-8092 Zurich, Switzerland. E-mail: sreenath.bolisetty@agrl.ethz.ch; Tel: +41-44-632-9140
First published on 1st March 2013
Abstract
We have investigated the response of dextran brushes in aqueous dimethyl sulfoxide (DMSO) mixtures under normal compression using the extended surface forces apparatus. The hydrophilic, tethered polymer chains extend significantly in the studied aqueous mixtures and two brush-covered surfaces exhibit repulsive forces upon compression against each other; these attributes are relevant for both anti-biofouling and lubrication properties. An estimation of the height of the dextran brushes with varying solvent quality is made from measurements of the onset of the repulsion: the brush swells significantly in pure water, a decrease in swelling being observed with an increase in DMSO concentration (up to ∼50 vol%), followed by a more pronounced swelling at higher DMSO concentrations. This behavior is in qualitative agreement with the solubility of bulk dextran polymer in aqueous DMSO solutions. Besides the conformational changes, an increase in the compressibility of the dextran brushes upon increasing the DMSO concentration was observed and explained by the change in the solvation structure of the polymer brush. We describe the equilibrium configuration of the polymer brush under marginal/good solvent conditions with the help of a mean-field approach, considering both solvent quality and a solvation-structure-dependent bond length. This work shows that an appropriate selection of polymer brush and solvent mixture can be used to tune the conformational properties of the polymer brushes at the interface, as well as the consequent repulsive and frictional forces.
Introduction
Polymer brushes immersed in a solvent or in a solvent mixture are systems of tremendous technological importance in the fields of lubrication, colloidal science, and biofouling, due to their ability to influence surface forces.1–7 Polymer chains attached to a surface maximize their configurational entropy by adopting self-avoiding walk configurations, and brush swelling is enhanced both by steric repulsion between the polymer chains and by monomer–solvent interactions, in the case of good solvents.8–10 If the distance between grafting sites is smaller than the radius of gyration of the free polymer chains in solution, the chains respond by establishing an optimum height of the brush to balance the two free-energy terms, as first described by Alexander:11swelling lowers the interaction energy between chains and favors the interaction with solvent molecules, at the price of a higher elastic free energy.In the last four decades, many attempts have been made to describe the equilibrium configuration of polymer brushes. Both the Flory approximation8 and the scaling approach11,12 assume a uniform monomer density within the brush. Based on a self-consistent mean-field theory13 (SCF), the Milner–Witten–Cates analytical approach14 yields a parabolic monomer-density distribution, strictly for moderately high-surface-coverage, long-chain-length polymer brushes in marginal solvents. Zhulina and co-workers15,16 simultaneously obtained similar results using an analytical approach and extended the model to a broad range of solvent qualities.16,17 Monte Carlo simulations18 and experiments19,20 have confirmed the non-uniform monomer-density distribution. While the SCF-based analytical models strictly describe the behavior of very long chains, the single-chain, mean-field theory (SCMF) is more appropriate for short and intermediate chain lengths (N < 100).9 Discrepancies between the predictions by SCMF and SCF-based analytical theories are mainly evident for the mushroom regime and the transition to the brush regime, while the predicted brush height and chemical potentials in the brush regime (at high surface coverage) by both theories are in good agreement, even for chains of intermediate length, such as those treated in this work.
In good solvents, polymer coils swell, whereas under poor solvent conditions they contract (or completely collapse). A temperature change that leads to solubility variations of the polymer in a single solvent can be responsible for the swelling/collapse behavior of the polymer brush,17 as confirmed by small-angle neutron scattering.19 Addition of another solvent to a polymer solution can greatly enhance or reduce the polymer solubility21 and brush conformation.19,22 In a solvent mixture, preferential solvation influences the equilibrium brush height and may lead to a difference in the concentrations of the co-solvents within the brush and in the bulk solvent, which can be predicted by a mean-field approach22,23 and by the SCF theory.24 Strong solvent–solvent interactions can account for anomalous brush behavior, such as swelling upon the addition of a small amount of bad solvent.25 Also, polymer collapse can be observed in a mixture of two good solvents that together, at a critical composition, behave as a poor solvent; this case is investigated in the present work. According to Brochard and de Gennes26 the collapse is caused by an indirect interaction between monomers: one monomer creates a cloud of preferential solvation in its vicinity and a second monomer is attracted by this cloud, whose size depends on the correlation length of the solvent mixture, leading to a collapse. However, the collapse cannot be described by this phenomenon if strong solvent–solvent interactions are present, as in this work.
The brush-like graft copolymer poly(L-lysine)-graft-dextran (PLL-g-dextran), consisting of dextran chains grafted onto a polycationic PLL backbone, has been previously demonstrated to adsorb spontaneously from aqueous solution onto negatively charged surfaces, such as many metal oxides. At an appropriate grafting ratio of dextran chains to the backbone, the adsorbed copolymers form dextran brushes in a purely aqueous environment.27–29 Dextran interacts with both water and DMSO via hydrogen bonding.30 In this paper, we investigate the equilibrium configuration of an end-grafted 5 kDa dextran brush in an aqueous solution of DMSO, water and DMSO both being good solvents for dextran. Measurements of normal surface forces between opposite brushes upon compression are carried out with an extended surface forces apparatus (eSFA) and the equilibrium brush height is obtained from the measured repulsive surface forces. The solubility of the dextran polymer in the selected solvent mixtures is determined by static light scattering and is correlated with the equilibrium conformation of polymers tethered to a surface. The mean-field approach in the limit of long, strongly stretched chains at a moderately high surface coverage is used to describe the equilibrium configuration of a polymer brush in a mixture of two good/marginal solvents that compete for solvation. Both solvent quality and a solvation-structure-dependent effective bond length of the polymer chain are included in the free energy of the system and their influence on the brush conformation is discussed.
The change in solvation of the brushes in solvent mixtures allows tuning of the conformational properties of the polymer brushes, as well as repulsive and frictional forces, at the interface.5,31 Furthermore, determining the structural changes of polymers in solvent mixtures may enhance our understanding of the conformational transitions of biomolecules in solution:32,33 variation of DMSO concentration in the aqueous environment of biomolecules has made it possible to observe otherwise inaccessible states of proteins, such as the unfolding of beta-sheets in amyloids,34 as well as helical structures of polysaccharides,35 which play an important role in triggering various cellular responses.
Theory: mean-field approach
A mean-field approach3,16,36 is applied to describe the brush equilibrium configuration in a mixture of two good solvents that compete for solvation, and also to estimate the surface forces acting between brushes upon compression when adsorbed on opposite surfaces as a function of the solvent-mixture composition. The analytical expression for the equilibrium brush configuration according to a mean-field approach has been recently proved to converge to the exact numerical solution of SCF theory in the limit of long (N → ∝) chains over a broad range of solvent qualities.36 Polydispersity is neglected in the theoretical approach. The use of the mean-field theory requires a moderately high surface coverage for self-avoiding walk configurations to be negligible.As will be shown later, the original mean-field model does not predict any change of the brush bulk modulus that we observe in our experiments. Based on the influence of the solution composition on the solvation structure of the polymer chains, we propose a modification of the mean-field approach to include a solvation-structure-dependent effective bond length of flexible chains.
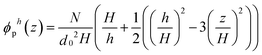
For a strongly swollen brush in a good/marginal solvent, the monomer density distribution at equilibrium per unit volume, ϕp, is exactly given by a parabolic function:36
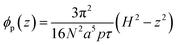 | (1) |
In a mixture of solvents, the equilibrium configuration of the brush results from the minimization of the free energy F per chain23 according to:
 | (2) |
 | (3) |
The free energy per chain F, considering only binary interactions, can be described as:36
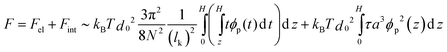 | (4) |
The influence of the polymer volume fraction ϕp on the virial coefficient38 has been neglected in eqn (4), which is a good approximation for dextran (5 kDa). Thus, the equilibrium height of the brush in a good/marginal solvent results from the minimization of F:
| H ∼ (8/π2)1/3Na(pτσ)1/3 | (5) |
Eqn (5) is in agreement with the expression derived by Milner et al.14 with (pτ) = 3/2.
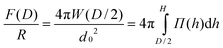
The compressive pressure created by a brush confined to height h (h < H) is given by3
 | (6) |
 | (7) |
The compressive free energy per area W between two brushes adsorbed onto flat walls separated by a distance equal to D follows from:
 | (8) |
Halperin and Zhulina3 compare the interaction between brush and colloidal or sharp tip in good/marginal and θ-solvents. An interpretation utilizing the Derjaguin approximation and assuming local compression of the brush is justified, when colloidal probes are utilized, as in SFA experiments. According to the Derjaguin approximation, the interaction force between two crossed cylinders where the point of closest approach lies at a distance D results from:
 | (9) |
We propose that the free energy at any solvent composition shall include not only the influence of the solvent mixture through a dimensionless virial coefficient τ(ϕ) that describes the quality of the solvent mixture, but also a solvation-structure-dependent parameter p(ϕ), ϕ being the volume fraction of the co-solvent. The solvent quality in a mixture of two solvents also depends on the interactions between the two solvents, as discussed later. To take into account the fact that the solvation structure might influence the intra-chain interactions, and hinder determined bond rotations,39 and through it the elastic free energy, we introduce an effective bond length leff or Kuhn length that depends on the solvation shell of the monomer and therefore is dependent on the co-solvent concentration:
| leff(ϕ) = lkp(ϕ) | (10) |
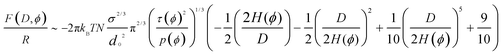 | (11) |
| H(ϕ) ∼ (8/π2)1/3Na(p(ϕ)τ(ϕ)σ)1/3 | (12) |
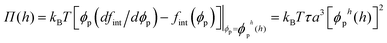
Comparing the free energy per unit area with the elastic potential energy, which is given by H−1∫Kzdz, we obtain the bulk modulus of the brush compressed to h ≤ H, K(z,ϕ,h), from:
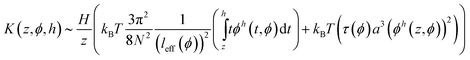 | (13) |
and the average value ![[K with combining macron]](https://www.rsc.org/images/entities/i_char_004b_0304.gif) (ϕ,h) is:
(ϕ,h) is:
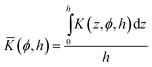 | (14) |
While a more stretched brush enhances the bulk modulus (H in the numerator of eqn (13)), it also leads to a decrease of the monomer density ϕ. As shown in Fig. 6, both effects counterbalance each other and the average value (ϕ,h) does not depend on the solution composition and resulting swelling ratio, if a constant effective bond length leff is assumed.
Materials and experimental methods
Materials
Dimethyl sulfoxide (DMSO) was used as received (HPLC grade, Alfa Aesar, Karlsruhe, Germany). The graft copolymer PLL(20 kDa)-g[3.5]-dextran(5 kDa) (PLL-g-dextran) was purchased from SuSoS AG (Dübendorf, Switzerland) and was characterized in HEPES (aqueous buffer, pH = 7.4, 10 mM of 4-(2-hydroxyethyl)-1-piperazine-1-ethanesulfonic acid, Sigma, St. Louis, MO, USA).27 The radius of gyration is 2.35 nm (from ref. 27); the density of dextran, ρ is taken as 1.4 g cm−3. The polymerization degree for a 5 kDa dextran chain is N ∼ 33. PLL-g-dextran adsorbs onto negatively charged substrates (in aqueous buffer) via the positively charged poly(L-lysine) backbone, forming brush-like structures. From adsorption measurements, the grafting density of the dextran brush was determined to be ∼0.31 ± 0.02 chains per nm2, which corresponds to a grafting distance between the dextran chains d0 of 1.9 ± 0.10 nm assuming hexagonal packing and a dry thickness of 2.06 nm. The brush configuration has been also confirmed by numerical simulations for PLL(20)-g[3.5]-poly(ethylene glycol) brushes with a similar architecture.40 Assuming a dextran monomer size a ∼ 7.1 Å,41,42 a moderately high surface coverage15 of σ = a2/d02 ∼ 0.12 [−] is obtained.Static light scattering
Light-scattering measurements were performed for dextran (5 kDa) (T5, Leuconostoc mesenteroides, Sigma Aldrich, Switzerland) chains in aqueous DMSO solutions. The elastic-light-scattering technique was used to determine the quality of the solvent mixtures for dextran by estimating the second virial coefficient.43 Static light scattering (SLS) measurements were performed using a 3D light-scattering instrument (LS Instruments AG, Fribourg, Switzerland). A high-intensity monochromatic laser was used to estimate the scattering intensity of the polymer in each solution at different polymer dilutions (at least 6 different dilutions were used) and also at multiple detection angles (α). The detection angles were varied from 40° to 140° in steps of 10 degrees. The intensity of the laser for a given polymer–solvent system was adjusted using an aperture, according to the scattering properties of the system. The scattered light was collected in the photon detector and auto-correlated over time. For dilute polymer solutions, the scattering intensity can be related to the molecular weight (Mw), the radius of gyration (Rg), and the second virial coefficient (A2) using the equation: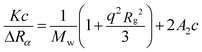 | (15) |
HEPES buffer was filtered (0.2 μm, FP30/0, Whatman) twice before use. It was challenging to dissolve the polymer in aqueous solutions without aggregation; therefore polymer solutions with concentrations of 5 mg ml−1 and below were used. Five or more dilutions of polymer solution were used for each aqueous co-solvent mixture. The polymer was initially added to the equivalent vol% of aqueous buffer and then magnetically stirred for 3 hours. After complete dissolution of polymer in the aqueous buffer, DMSO was added to the polymer solution and left overnight at 50 °C to reach equilibrium. Finally the polymer solutions were directly filtered into pre-cleaned light-scattering glass tubes and the scattering intensities were obtained at 10 detection angles for each concentration.
Zimm plots were constructed for the obtained data: the intercept at zero concentration (c = 0) and scattering intensity (q = 0) gives the molecular weight of the dextran, the slope at c = 0 is equivalent to Rg2/2 and the slope at q = 0 gives the osmotic second virial coefficient (A2). The refractive index increment (dn/dc) of dextran in each solvent mixture was measured with a temperature-controlled refractometer (see Table 1).
| Percentage of DMSO | dn/dc (l g−1) |
|---|---|
| 0 | 1.41 × 10⁻⁴ |
| 25 | 1.13 × 10⁻⁴ |
| 40 | 0.917 × 10⁻⁴ |
| 60 | 0.76 × 10⁻⁴ |
| 75 | 0.655 × 10⁻⁴ |
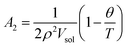
The relation between A2 and the θ-temperature of the polymer is given by:
 | (16) |
Surface forces apparatus
The surface forces apparatus (SFA) was used to determine forces between two surfaces as a function of the surface separation, measured by interferometry.44,45 Surface-force isotherms were obtained using an extended surface forces apparatus (eSFA)—a modified version of the Mk 3 SFA (Surforce, Santa Barbara, CA),46 with attachments to improve the accuracy, resolution, mechanical drift, thermal stability, imaging and essential automation of the instrument; these modifications have been described in detail in the literature.47,48 The accuracy of the distance measurements is ±30 pm.Thin mica sheets were prepared by manually cleaving ruby mica of optical quality Grade #1 (S&J Trading, Inc., NY, USA) in a class-100 laminar-flow cabinet. Uniformly thick (2–5.5 μm) mica sheets of size 8 mm × 8 mm were cut using surgical scissors, to avoid possible contamination with nanoparticles.49 A silver film of 40 nm thickness was thermally evaporated onto the mica sheets in vacuum (2 × 10⁻⁶ mbar). The silver-coated mica sheets were glued onto cylindrical lenses using an optical glue (DYMAX, OP-29). The samples were then immediately inserted into the sealed eSFA, the fluid cell was purged with dry nitrogen, and the mica thickness was determined by means of thin-film interferometry.
After determining the mica thickness, the surfaces were removed from the eSFA and polymer was adsorbed on both mica surfaces by ex situ immersion in the buffer solution with 0.25 mg ml−1 PLL-g-dextran for at least 30 minutes at room temperature. After copious rinsing, first with the pure buffer and then with pure water, the surfaces were placed back into the eSFA and the PCA (point of closest approach) was re-adjusted with an accuracy of ±1 μm. HEPES was used as aqueous buffer for all force–distance measurements to minimize aging effects on mica.50 Then, the eSFA fluid cell was filled with aqueous mixtures of DMSO at selected volume fractions. Both the polymer solutions used for adsorption and the solvent mixtures were filtered with a 0.2 μm-membrane before use. After thermal equilibrium was attained at 25 ± 0.1 °C (within 3 hours), approach and separation of the surfaces were carried out at a constant speed of 3 Å s−1 to determine the surface interaction as a function of the separation between the surfaces (D). The slow surface approach excluded hydrodynamic effects from the measured surface forces.1 A spring constant of ∼1927 ± 88 N m−1 was used in this work.
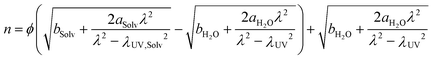
The transmitted interference spectrum consists of fringes of equal chromatic order, and was analyzed by fast spectral correlation interferometry47,48 to evaluate D. The refractive indices of the various bulk solvent mixtures were used as input to the multilayer-matrix method for computing the interference spectra. To include the wavelength dependency of the refractive index of aqueous solvent mixtures, an adapted Sellmeier's equation51,52 was used:
 | (17) |
Results
Solvent quality of DMSO aqueous solutions for dextran (5 kDa)
The second virial coefficients A2 for dextran (5 kDa) in aqueous DMSO solutions were estimated from the Zimm plots, as described before. The placement of several polarizers in the path of the laser affects the absolute intensity of the scattered light at the detector and thus the obtained intercepts for the calculation of A2 become dependent on the configuration of the instrument. Therefore, only normalized A2-values could be obtained using the available equipment. Fig. 1 shows the obtained second virial coefficient normalized by its value in pure buffer.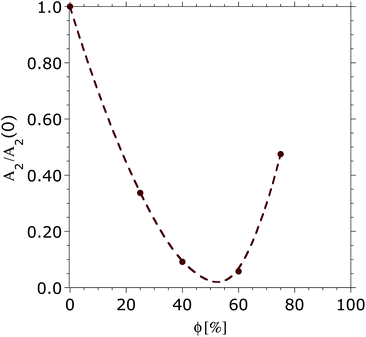 | ||
| Fig. 1 Second virial coefficients obtained by SLS for dextran (5 kDa) in aqueous DMSO mixtures, normalized with respect to the value obtained in pure buffer, A2(0). The line is a guide for the eye. | ||
The initial decrease of A2 shows the drop in the solubility of dextran with increasing DMSO concentration reaching a minimum between 40 and 60 vol% of DMSO and then a solubility increase (increase of A2) was observed at higher volume fractions of DMSO. The second virial coefficient for dextran (5 kDa) in pure DMSO could not be determined using SLS, most likely due to the small difference between the refractive index of the polymer and that of the DMSO itself (dn/dc of dextran in pure DMSO was close to zero). However, a higher solubility for dextran with a higher molecular weight (526 kDa) is reported in pure DMSO than in water.55 Intrinsic viscosity measurements30 also showed the solubility of dextran (150 kDa) in DMSO to be higher than in water. Hence, a further increase of A2 is expected above 75 vol% DMSO.
Surface-force isotherms
Surface-force isotherms for dextran brushes were measured in mixtures of HEPES and DMSO at selected volume fractions of DMSO (in Fig. 2, for 0, 25, 60 and 90 vol%). The measured forces were normalized by the radius R of the cylindrical mica (R ∼ 20 mm). Repulsive forces between the opposing polymer chains were measured at all concentrations. Upon increasing the volume fraction of DMSO, the onset of the repulsion takes place at smaller separations (D) until ϕ ∼ 50%, after which the onset of the repulsion is measured at larger separations. These results show a slight reduction in swelling ratio with respect to pure buffer for DMSO volume fractions below 50%, and then an enhancement of the brush swelling at higher concentrations of DMSO.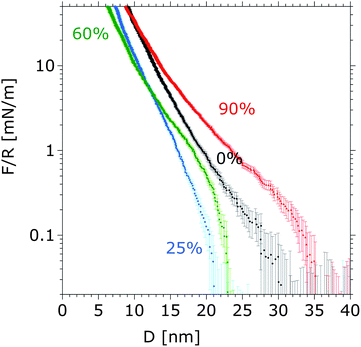 | ||
| Fig. 2 Measured surface-force isotherms between dextran brushes during approach of the surfaces in aqueous DMSO mixtures at 0, 25, 60 and 90 vol% of DMSO in HEPES, at a constant speed of 3 Å s−1. The depicted force–distance curves were obtained for the same pair of mica surfaces. The error bars give the standard deviation of the measured force on three consecutive approaches and separations. No hysteresis between the surface forces measured upon approach and separation was observed, which indicates that the force–distance curves describe the equilibrium state of the compressed elastic brush. Absence of adhesion suggests that no chain interdigitation or bridging occurs upon compression. | ||
The approach speed of the mica surfaces from D ∼ 1 μm was held at 3 Å s−1 until a maximum load of ∼250 mN m−1 was reached, and then the surfaces were separated at the same speed. No hysteresis was observed between the force–distance curves during approach and separation of dextran brushes in pure buffer solutions, suggesting that the curves had been obtained in the equilibrium state of the compressed elastic polymer brush. Also, no adhesion was measured during separation, suggesting the absence of inter-chain digitation or bridging, even at high loads, as a result of the strong repulsive force between the opposing polymer brushes arising from the presence of a thin solvent film at the interface. A change in the slope of the repulsive surface force between dextran brushes is also observed at volume fractions of DMSO above ∼50% in the aqueous solution (Fig. 2). As the stress on the compressed brushes is proportional to this slope,56 the change in the slope indicates an effective change of the compressibility of the dextran brush with solvent composition, which is analyzed and discussed in detail later.
Estimation of the equilibrium length of brushes
The equilibrium length H(ϕ) of the brushes in the selected solvent mixtures was determined by two different approaches. Firstly, the height of the polymer brush H was obtained from the gap distance between the surfaces at the onset of repulsion,1H = D/2 − D0, where D0 is the finite thickness of the underlying polylysine anchor (assumed to be 1 nm (ref. 4)). Secondly, H(ϕ) was obtained by fitting the measured surface forces isotherms to the modified form of eqn (11), to take into account an offset for the polylysine thickness D0: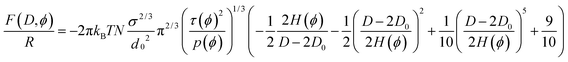 | (18) |
along with eqn (12), from which H(ϕ) is proportional to N(σp(ϕ)τ(ϕ))1/3. These equations are valid only for planar brushes. The dextran chains, tethered to the PLL backbone, do not interact with the surface and thus can be considered as a planar brush if the head groups along the backbone are uniformly distributed on the surface with a constant area per head and the chains are long and strongly crowded (ref. 8 and personal communication, A. Halperin). Indeed, the grafting density obtained from the adsorption measurements is in agreement with a uniform distribution of the side chains: the calculated distance between the side chains within a PLL-g-dextran molecule (∼1.8 to 2.5 nm according to the grafting ratio of 3.5 and a length of lysine of ∼0.5 to 0.75 nm (ref. 40)) is similar to that obtained from adsorption experiments (d0 ∼ 1.9 ± 0.10 nm). Moreover, PLL-g-dextran was synthesized with different MW of dextran ranging from 5 kDa to 20 kDa and various grafting densities and characterized by quartz crystal microbalance in aqueous buffer.27 The brush height obtained with the Voigt model is approximately proportional to Nσ1/3 within the experimental error, demonstrating the validity of eqn (12), and of the theory for planar brushes, to describe our system.
An invariant persistence length parameter with solvent composition, p(ϕ) = 1, was first assumed, in order to determine H(ϕ) and τ(ϕ), the two unknown parameters in eqn (12) and (18). A reasonable agreement between the measured and calculated interaction forces is achieved only in the regime of strong compression (F/R > 2 ± 1 mN m−1), as shown in Fig. 3, which was also found previously for PEG brushes.4 Thus, polydispersity of polymer chains can result in brush heights that are higher8 than the calculated values, which assumes a monodisperse polymer film. Besides, the applied model is strictly valid only for a parabolic monomer distribution in a marginal/good solvent in the limit of long and strongly stretched chains. Despite this, for the graft-copolymer poly(L-lysine)-graft-poly(ethylene glycol), PLL(20 kDa)-g[3.5]-PEG(2 kDa), which has a very similar architecture to that of the selected dextran brushes (PEG(2 kDa) and has a degree of polymerization N = 44), the exact solution of the SCF theory gives a quasi-parabolic monomer density profile in water (Fig. 10 in ref. 40), which justifies the use of the approach described above, at least for a qualitative analysis.
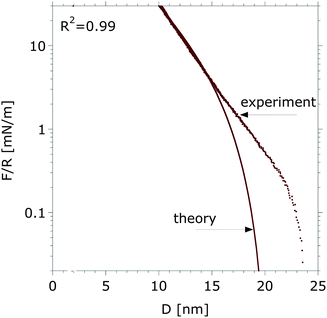 | ||
| Fig. 3 Experimentally determined force–distance curve and the calculated force–distance as predicted with eqn (12) and (18) for τ = 0.67 and H(0) = 8.75 nm between dextran brushes in pure aqueous buffer. A good fit (R2 = 0.99) is obtained over the whole force range, however a visible deviation between theory and experiment is observed below 2 mN m−1. | ||
The film thicknesses of dextran brushes as a function of the volume fraction of DMSO, determined from the onset of repulsion and as calculated with eqn (12) and (18), are depicted in Fig. 4a and the calculated dimensionless virial coefficient τ(ϕ) in Fig. 4b. At each solution composition the brush height is larger than the unperturbed radius of gyration of dextran (5 kDa) in water, which is 2.35 nm. While the absolute values are different, as expected, the trend is similar: a slight decrease of the film thickness is observed upon increasing the volume fraction of DMSO up to ∼50%, while a more pronounced swelling follows upon further increasing the DMSO concentration. A non-monotonic swelling results for the dextran–DMSO–water system, which is qualitatively in good agreement with the solubility of the polymer in the solvent mixture (see Fig. 1).
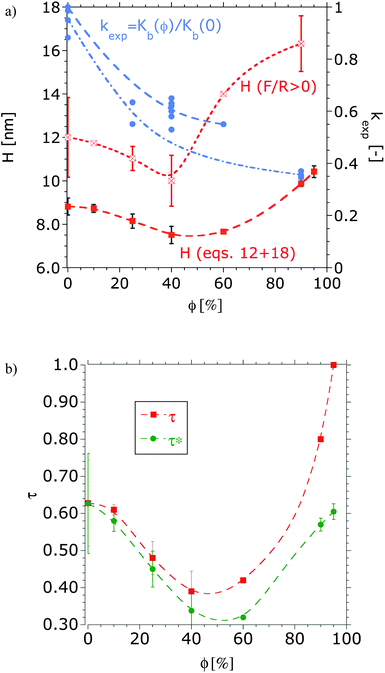 | ||
| Fig. 4 (a) Equilibrium height of the dextran brush (H, left Y-axis) obtained at the repulsion onset (F/R > 0) and by fitting the surface forces to eqn (12) and (18), respectively, as a function of the volume fraction of DMSO and ratio between the bulk modulus of dextran brush in the aqueous DMSO solution and that in pure buffer (kexp, right Y-axis). The data were obtained from four experiments with different pairs of mica surfaces and at least three force measurements at each concentration and pair of mica surfaces. (b) Dimensionless virial coefficient obtained from fitting the force–distance curves to eqn (12) and (18): τ was determined with p = 1 and τ* with a solvation-structure-dependent parameter p(ϕ), as described later. The lines are to guide the eye. | ||
Bulk modulus of dextran brushes
The brush bulk modulus can be obtained from the force law upon brush compression.56 The Johnson–Kendall–Roberts (JKR) model (and the Hertz model in absence of adhesion) has been applied to determine the nano-mechanical properties of different soft layers such as polymer brushes, gels and biopolymer brushes from compression experiments, using colloidal-probe atomic force microscopy.57–61 Chen et al.62 applied JKR theory to estimate the bulk modulus of surfactant and lipid monolayers compressed between mica surfaces using the surface forces apparatus. During compression of the monolayers, the measured distance D includes both the total deformation of the mica sheet ΔDm and of the two brushes Δz:| D = 2(H + D0) + Δz + 2ΔDm | (19) |
 | (20) |
the bulk modulus of the brush can be estimated by substituting Δz from eqn (19), which leads to:
 | (21) |
Eqn (20) neglects the lateral deformation of the brushes subjected to an uniaxial compressive stress. The adhesion between the polymer brushes was observed to be negligible in all solvent mixtures and accordingly the contact mechanics can be described by the Hertz theory. Thus, the maximal stress at the center of the contact for non-adhesive surfaces is given by:
 | (22) |
By substituting σ(0) from eqn (22) into eqn (21) the following relation between the load F/R and the measured distance D is obtained:
 | (23) |
It was assumed that outside the contact region the brush adopts an equilibrium configuration. The contact radius r between the brushes for very small deformations was obtained from the measured brush compression according to:
| r = Rsin[θ] with θ ∼ cos−1(1 − (H − D/2)/R) | (24) |
to determine Kc. Then, by fitting the surface-force isotherm to eqn (23), the bulk modulus of the brush Kb was determined. Sufficiently small compressive loads were selected, generally smaller than 20 mN m−1, to avoid deformation of the mica (mica deformation, if it occurs, can clearly be detected in the measured profiles in the xy-plane), while the corresponding deformation of the polymer brushes was less than ∼2 nm. At this small deformation a very good fit was achieved by considering Kb to remain constant.
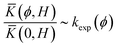
The ratio between the bulk modulus of the brush in the aqueous DMSO solution and in the pure buffer, kexp = Kb(ϕ)/Kb(0), is depicted in Fig. 4a for different volume fractions of DMSO. Our results show that the ratio kexp decreases notably with increasing DMSO volume fraction, suggesting that the brush becomes gradually more compressible: the bulk modulus obtained in aqueous buffer was Kb(0) = 37 ± 3 kPa, while in 90 vol% of DMSO the modulus significantly decreased to 15.1 ± 0.3 kPa. For a similar grafting density, Sui et al.63 measured an elastic modulus of 150 ± 4 kPa for a PNIPAM brush with a wet thickness of 630 nm in water (a good solvent) by means of AFM indentation, while the Young's modulus increased to 688 kPa by adding 50% methanol due to the collapse of the brush to 200 nm (dry thickness 100 nm). Our values are smaller, which may be due to either the use of different experimental techniques or the different brush architecture.
Greater substrate effects can be expected for both shorter and more collapsed brushes. However, the measured compressibility increases monotonically, whereas a non-monotonous stretching/collapse behavior is observed. Therefore, one can rule out the possibility that the substrate is responsible for the measured change of the compressibility.
Discussion
Solvent quality and brush swelling behavior
Upon increasing DMSO volume fraction, an initial decrease in the swelling of the dextran brushes was observed, followed by stronger brush swelling at volume fractions above 50%. No first-order transition is observed, in agreement with previous studies of single solvents, in which a solubility change of the brush is induced by temperature variations,17 or by use of co-solvent mixtures.23,64 These transitions have been studied for mixtures of good and bad solvents and they result from the interplay between preferential solvation of the polymer by one of the solvents and the strength of the solvent–solvent interactions.17,19,22,65 If both co-solvents are good solvents for the polymer, such as DMSO and water for dextran, preferential solvation by one of the two good solvents might lead to attractive interactions between polymer chains, which could explain a brush collapse at a critical composition, as discussed by Brochard and de Gennes.26However, the swelling behavior is more complicated when a strong interaction exists in the cosolvent mixture. The solvation effect on the conformation of hydrophilic polymers has been studied in the literature via diverse thermodynamic approaches. Such approaches to predict solubility also fail, especially for polar solvent–polymer interactions.66,67 For example, the solubility can be estimated through the interfacial free energy ΔG, which gives the free energy of cohesion between polymer and solvent. For dextran polymer, ΔG calculated according to van Oss theory68 is 40.725 mJ m−2 in water and 4.513 mJ m−2 in DMSO. Positive values of ΔG indicate that the polymer dissolves in the solvent spontaneously while the polymer tends to precipitate for negative values of ΔG. According to this estimation, dextran polymers are expected to dissolve in aqueous DMSO mixtures but the solubility in water is expected to be larger than in DMSO, which contradicts the measured conformational changes. The limitations of the currently available thermodynamic models for predicting polymer solubility have been also demonstrated for PEG and dextran in aqueous ethylene glycol and glycerol solutions elsewhere.66 We have studied the conformation changes of dextran in mixtures of water and DMSO via QCM experiments66 and the results are in very good agreement with the eSFA experiments reported here.
A physical explanation for the observed maximum collapse at the intermediate concentration has been found based on molecular models of mixtures of DMSO and water. They show that DMSO disrupts the hydrogen bonding between water molecules at volume fractions below 50%.69,70 Studies conducted using X-ray and neutron small-angle scattering71 confirm this strong interaction between water and DMSO. For example, the ternary PVA–water–DMSO system72 exhibits a solubility minimum, owing to the formation of complex solvent clusters of DMSO and water, which behave as a bad solvent for untethered PVA. The largest amount of these complexes was found at 65% of DMSO. Although experimental techniques to determine accurately the solvation structure of the monomer by a solvent mixture are not available to date, a water–DMSO complex formation might explain the measured solubility minimum of dextran (5 kDa) in water–DMSO mixtures (see Fig. 1) at ∼50% DMSO. Results reported by Dintzis and Tobin73 and Basedow et al.74 also show the non-monotonic solvent quality of DMSO–water mixtures for dextran with much higher molecular weight.
Fig. 5 schematically shows the origin of the collapse/stretching behavior. In pure water, dextran acts as a weak structure breaker of the water network (as the strengths of water–dextran and water–water bonds are similar) and forms hydrogen bonds with water molecules (Fig. 5a). Below a volume fraction of ∼50% of DMSO, water and DMSO preferentially interact with each other and form molecular complexes leading to a more poorly solvated dextran brush (in comparison to pure water) favoring monomer–monomer interactions75 and a slight decrease in the film thickness (Fig. 5b). At higher percentages of DMSO, the DMSO molecules solvate the brush and the brush tends to stretch. Since DMSO is an aprotic solvent, dextran readily interacts with DMSO molecules without the need to first break the dense hydrogen-bonded network, in order to interact, in contrast to its behaviour with water. The stronger dextran–DMSO hydrogen bonds and large molecular size of DMSO can induce a higher excluded-volume effect than in water, thus, dextran brushes in DMSO exhibit a higher film thickness than in pure water (Fig. 5c).
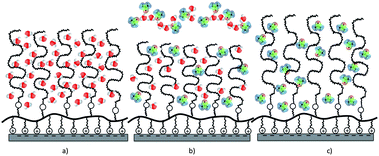 | ||
| Fig. 5 Schematic representation of conformational changes of dextran brushes in aqueous DMSO solutions due to changes in the solvent quality: (a) in pure water, (b) ϕ ∼ 50 vol% of DMSO in aqueous buffer and (c) ϕ ∼ 100 vol% of DMSO. | ||
The dimensionless virial coefficient of the polymer brush τ can be expressed as a function of the θ-temperature of the brush. However, the θ-temperatures of polymer in bulk, i.e. the polymer solubility in the selected mixtures (∝A2), may differ from that of the tethered polymer chains due to the difference in free energy.8,9 For example, tethering may prevent the demixing and precipitation which occurs for free polymers in poor solvents.8 Despite this, the observed trend in Fig. 1 for the second virial coefficient of the polymer in bulk and the results from the literature are in qualitative agreement with the parameter τ(ϕ) obtained for the polymer brush (Fig. 4b) from the surface force measurements. Thus, τ(ϕ) gives the influence of the solvent quality on the equilibrium configuration of the brush.
Solvation-structure-dependent effective bond length
The bulk modulus of the brush can be estimated with the described mean-field approach in the equilibrium configuration and under compression using eqn (13). Fig. 6 shows the position-dependent bulk modulus of the dextran brush in a solvent mixture obtained by assuming p = 1 and a parameter τ(ϕ), which was obtained by fitting the measured surface forces (Fig. 4b). The predicted bulk modulus K is not a constant within the brush due to the parabolic monomer-density distribution in equilibrium (eqn (1)) and upon compression (eqn (7)). Indeed, it reaches a maximum close to the surface and decreases with z, the distance from the surface. According to this approach, the average bulk modulus (eqn (14)) of the polymer brush does not depend on the solution composition or solvent quality. This is in contrast to the experimental results, which show an increase in the compressibility (i.e. a decrease of the bulk modulus) of the dextran brush with increase in the volume fraction of DMSO (Fig. 4a), which cannot be explained by substrate effects, as pointed out before. However, discrepancies between theory and experiment must be expected. The theory is only strictly valid for very long planar brushes. Moreover, a standard Flory free energy has been used in eqn (4) although the hydrogen bonding between dextran and water and DMSO is decisive for the polymer solubility30 and ternary interactions have been neglected. In the following, we propose another reason for the observed discrepancy between experiment and model based on recent experimental and simulation results.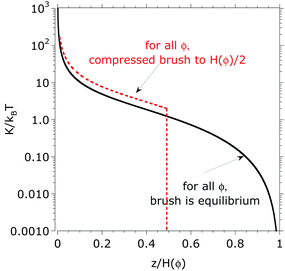 | ||
| Fig. 6 Bulk modulus K/kBT as predicted with eqn (13) with p(φ) = 1 as a function of the normalized brush height in equilibrium. The stiffness distribution results from the assumed parabolic monomer density, which leads to a softer brush close to the brush–liquid interface and stiffer brush close to the surface. K was calculated for different volume fractions of DMSO, 0%, 40%, 60%, and 100% in equilibrium (uncompressed) and compressed to the half of the equilibrium height; the results merge in a single curve at any compression if the distance to the surface is normalized by the brush height. | ||
Water-soluble polymers induce a local solvation structure, in which water molecules interact with the individual monomers and form a hydration sheath around the polymer that strongly influences the polymer conformation.38 Experiments and simulations support the idea that the solvation structure influences the elastic energy of polymer chains. Force spectroscopy of single PEG molecules shows that the resistive force against elongation depends on the solvent—in this study, water or hexadecane. It is shown that water molecules form fluctuating intrachain bridges, shortening the net polymer length and resisting chain extension.76Ab initio quantum-mechanical calculations demonstrate the different stability of monomer configurations depending on the solvent, leading to a different secondary structure and affecting the length of the oligomeric states depending on the intra-chain solvent-mediated hydrogen bond structure. This cannot be described with a simple polymer picture but it requires a two-state model. These results are highly relevant since different supra-molecular structures of the polymer chain may affect the interaction with solutes, e.g. with proteins.77 Single-molecule force microscopy has also shown that solvent molecules (water and glycerol) influence the mechanical transition states of a protein through a change of the solvation structure.78 Thus, the free energy and, in turn, the folding/unfolding thermodynamics and kinetics of a protein, are strongly determined by the interaction of the macromolecule with each solvent molecule. Numerical simulations show that PMMA in benzene stiffens with the surrounding benzene solvation shell;79 the obtained diameter of the chain cross-section is given by the size of the solvent molecules. It has also been shown by UV resonance Raman spectroscopy80 that the temperature-driven collapse of PNIPAM is related to changes in the polymer hydration shell. In the extended state, the exposed amide bonds provide three hydrogen bonding sites where water molecules localize and serve as nucleating sites for formation of large water clusters i.e. a hydration shell.81 At elevated temperatures, increased thermal agitation disrupts the extensive hydrogen bonding network that stabilizes the large water cluster. The loss of favorable interactions destabilizes the exposed PNIPAM conformation. PNIPAM then collapses to a compact conformation. The loss of well-ordered water molecules from the hydrophobic group's solvation shell into the bulk increases the system entropy, thus stabilizing the compact PNIPAM conformation. The range of reported data in different references for persistence length and monomer size of PNIPAM is very broad. This led Halperin and Kröger82 for the first time to address the question of a temperature-dependent persistence length to describe the solvation-dependent conformation of PNIPAM.
Based on the discussed results, we propose that the solvation structure of the dextran monomer influences the intra-chain interactions via hydrogen bonding and through it the stiffness of the hydrated chain, which we describe via a solvation-structure-dependent parameter p(ϕ) within the mean-field approach.
The effective bond length is estimated by equating the calculated bulk modulus and the experimentally determined bulk modulus at each volume fraction of DMSO, i.e. neglecting any other reason for discrepancies between model and experiment:
 | (25) |
which is a rough approximation. This gives an effective bond length, leff(ϕ), that increases monotonically with the DMSO volume fraction up to a maximum of 2.5× larger than in water (in pure DMSO). It is likely that the larger molar volume of the DMSO molecules and the stronger interaction with the monomer are responsible for the increase in effective bond length. Thus, by considering the influence of the solvation structure on the chain stiffness, the increase of brush compressibility with increase in DMSO volume fraction that was observed in the surface force measurements can be described.
The two limiting curves obtained for kexp lead to an upper and lower limit for pexp at each co-solvent concentration. An average value for pexp was used to determine τ*(ϕ) (Fig. 4b) and H*(ϕ) with eqn (12) and (18). Fig. 7 shows the normalized equilibrium brush height (left Y-axis), estimated by fitting the measured surface forces with a constant and a solvation-structure-dependent parameter, which is given on the right Y-axis. These results show that the equilibrium brush height is underestimated by neglecting the solvation-structure-dependent elastic energy. As expected, an increase in the effective bond length leads to a more stretched brush. The underestimation is higher at high concentrations of DMSO. According to eqn (13) and (14) an increase in the effective bond length leads to a decrease of the entropy elasticity of the brush, and macroscopically leads to a more significant brush compressibility, as discussed above.
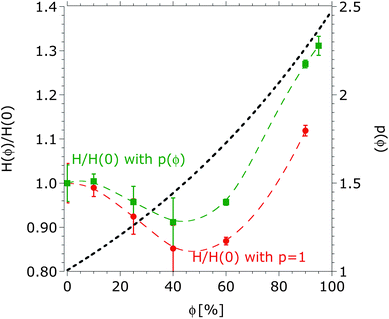 | ||
| Fig. 7 Normalized equilibrium brush height as a function of the volume fraction of DMSO obtained from fitting surface forces curves to eqn (12) and (18) by assuming a constant effective bond length (p = 1, circles) and a solvation-structure-dependent bond length (p(ϕ) squares), respectively. The lines are to guide the eye. The corresponding solubility parameters τ and τ* are shown in Fig. 4b. The average persistence length parameter is given on the right Y-axis. | ||
These results are obtained for a polymer brush in a mixture of two good solvents that strongly interact with each other. In a mixture of a good and a bad solvent the effective bond length of the polymer chain remains constant as long as there is enough good solvent in the brush, since only the good solvent can participate in forming a solvation shell. This is observed for PEG brushes in a mixture of weakly interacting 2-propanol and water.83 The preferential adsorption of water by PEG brushes prevents collapse as long as there is enough water in the solvent mixture to solvate the polymer (i.e. 2-propanol is excluded from the brush). Indeed, PEG collapse starts only at concentrations of 2-propanol above 85 vol%.84
The solvation structure influencing the compressibility of the brush (Fig. 4a) might also affect the lubrication performance of the brush. If the compressibility of dextran brushes increases with increase in DMSO concentration, the deformation of the brush under an applied load is larger and the load is distributed over a larger surface area, which leads to lower local pressures85 and likely to a thicker fluid film. The higher swelling ratio is expected to aid in further reduction of friction.1 The behavior of dextran brushes in mixtures of DMSO and water under shear is currently under investigation.
Conclusions
The equilibrium configuration of brushes is strongly influenced by the interaction between co-solvents and polymer, especially for good solvents such as water and DMSO, since they compete for solvation. The solvation shells also affect the entropy elasticity, in agreement with reported results for proteins and water-soluble, non-polar polymers. A mean-field approach allows the interplay between solvent quality of solvent mixtures and solvation-structure-dependent conformation to be taken into account. In the particular system discussed in this work—a dextran brush anchored via a PLL backbone to a negatively charged flat substrate in aqueous DMSO solution—the solvation structure formed by DMSO molecules along the polymer chains counterbalances the collapse due to the poor solvent quality at intermediate concentrations of DMSO, whereas the increase of brush compressibility distributes the load over a larger contact area. These effects lead, in turn, to a non-negligible increase (or to a less pronounced decrease) of the repulsive force between compressed brushes grafted to opposite surfaces and to lower pressures in the contact region, respectively, which are expected to positively affect the lubricating5,86 performance, among other properties.Acknowledgements
The financial assistance of the European Science Foundation, through their Eurocores (FANAS) program is gratefully acknowledged. We thank Prof. Martin Kröger, ETH Zurich, for his help with the mean field approach, Prof. Raffaele Mezzenga, ETH Zurich, for allowing access to the light-scattering instrument and Prof. Avraham Halperin, Laboratoire interdisciplinaire de Physique, Université Joseph Fourier, Grenoble, Prof. Manfred Heuberger (Empa, St. Gallen), Mr Tolga Goren, and Dr Jarred N. Clasohm for useful suggestions and discussions. We are grateful to Giovanni Cossu for his technical support.References
- J. Klein, Annu. Rev. Mater. Sci., 1996, 26, 581–612 CrossRef CAS.
- G. S. Grest, Adv. Polym. Sci., 1999, 138, 149–183 CrossRef CAS.
- A. Halperin and E. B. Zhulina, Langmuir, 2010, 26, 8933–8940 CrossRef CAS.
- M. Heuberger, T. Drobek and N. D. Spencer, Biophys. J., 2005, 88, 495–504 CrossRef CAS.
- A. Nomura, K. Okayasu, K. Ohno, T. Fukuda and Y. Tsujii, Macromolecules, 2011, 44, 5013–5019 CrossRef CAS.
- L. Isa, E. Amstad, K. Schwenke, E. Del Gado, P. Ilg, M. Kröger and E. Reimhult, Soft Matter, 2011, 7, 7663–7675 RSC.
- M. T. Muller, X. P. Yan, S. W. Lee, S. S. Perry and N. D. Spencer, Macromolecules, 2005, 38, 5706–5713 CrossRef.
- A. Halperin, M. Tirrell and T. P. Lodge, Adv. Polym. Sci., 1992, 100, 31–71 CrossRef CAS.
- I. Szleifer and M. A. Carignano, Adv. Chem. Phys., 1996, 94, 165–260 CrossRef CAS.
- S. T. Milner, Science, 1991, 251, 905–914 CAS.
- S. Alexander, J. Phys., 1977, 38, 983–987 CAS.
- P. G. de Gennes, Macromolecules, 1980, 13, 1069–1075 CrossRef CAS.
- J. M. H. M. Scheutjens and G. J. Fleer, J. Phys. Chem., 1979, 83, 1619–1635 CrossRef CAS.
- S. T. Milner, T. A. Witten and M. E. Cates, Macromolecules, 1988, 21, 2610–2619 CrossRef CAS.
- A. M. Skvortsov, I. V. Pavlushkov, A. A. Gorbunov, Y. B. Zhulina, O. V. Borisov and V. A. Pryamitsyn, Polym. Sci. U.S.S.R., 1988, 30, 1706–1715 CrossRef.
- E. B. Zhulina, O. V. Borisov and V. A. Priamitsyn, J. Colloid Interface Sci., 1990, 137, 495–511 CrossRef CAS.
- E. B. Zhulina, O. V. Borisov, V. A. Pryamitsyn and T. M. Birshtein, Macromolecules, 1991, 24, 140–149 CrossRef CAS.
- T. Cosgrove, T. Heath, B. Van Lent, F. Leermakers and J. Scheutjens, Macromolecules, 1987, 20, 1692–1696 CrossRef CAS.
- P. Auroy and L. Auvray, Macromolecules, 1992, 25, 4134–4141 CrossRef CAS.
- H. Yim, M. S. Kent, S. Satija, S. Mendez, S. S. Balamurugan, S. Balamurugan and G. P. Lopez, Phys. Rev. E: Stat., Nonlinear, Soft Matter Phys., 2005, 72, 051801 CrossRef CAS.
- E. Antoniou and P. Alexandridis, Eur. Polym. J., 2010, 46, 324–335 CrossRef CAS.
- T. M. Birshtein and Y. V. Lyatskaya, Macromolecules, 1994, 27, 1256–1266 CrossRef CAS.
- P. Y. Lai and A. Halperin, Macromolecules, 1992, 25, 6693–6695 CrossRef CAS.
- V. M. Amoskov, T. M. Birshtein and A. A. Mercurieva, Macromol. Theory Simul., 2006, 15, 46–69 CrossRef CAS.
- J. F. Marko, Macromolecules, 1993, 26, 313–319 CrossRef CAS.
- F. Brochard and P. G. De Gennes, Ferroelectrics, 1980, 30, 33–47 CrossRef CAS.
- C. Perrino, Poly(L-lysine)-g-dextran (PLL-g-dex): brush-forming, biomimetic carbohydrate chains that inhibit fouling and promote lubricity, ETH Zurich, 2009 Search PubMed.
- C. Perrino, S. Lee and N. D. Spencer, Tribol. Lett., 2009, 33, 83–96 CrossRef CAS.
- C. Perrino, S. Lee, S. W. Choi, A. Maruyama and N. D. Spencer, Langmuir, 2008, 24, 8850–8856 CrossRef CAS.
- E. Antoniou, C. F. Buitrago, M. Tsianou and P. Alexandridis, Carbohydr. Polym., 2010, 79, 380–390 CrossRef CAS.
- A. Li, S. N. Ramakrishna, E. S. Kooij, R. M. Espinosa-Marzal and N. D. Spencer, Soft Matter, 2012, 8, 9092–9100 RSC.
- T. Arakawa, Y. Kita and S. N. Timasheff, Biophys. Chem., 2007, 131, 62–70 CrossRef CAS.
- T. Kamiyama, H. Liu and T. Kimura, J. Therm. Anal. Calorim., 2009, 95, 353–359 CrossRef CAS.
- A. Loksztejn and W. Dzwolak, Biochemistry, 2009, 48, 4846–4851 CrossRef CAS.
- X. Wang, Y. Zhang, L. Zhang and Y. Ding, J. Phys. Chem. B, 2009, 113, 9915–9923 CrossRef CAS.
- A. Halperin, M. Kröger and E. B. Zhulina, Macromolecules, 2011, 44, 3622–3638 CrossRef CAS.
- G. J. Fleer, M. A. Cohen Stuart, J. M. H. M. Scheutjens, T. Cosgrove and B. Vincent, Polymers at Interfaces, 2nd edn., Chapman & Hall, London, 1998 Search PubMed.
- R. Toomey and M. Tirrell, Annu. Rev. Phys. Chem., 2008, 59, 493–517 CrossRef CAS.
- M. Rubinstein and R. H. Colby, Polymer Physics, OUP Oxford, 2003 Search PubMed.
- L. Feuz, F. A. M. Leermakers, M. Textor and O. Borisov, Langmuir, 2008, 24, 7232–7244 CrossRef CAS.
- G. W. Robinson, C. H. Cho and J. Urquidi, J. Chem. Phys., 1999, 111, 698–702 CrossRef CAS.
- V. Molinero and W. A. Goddard, J. Phys. Chem. B, 2004, 108, 1414–1427 CrossRef CAS.
- B. H. Zimm, J. Chem. Phys., 1948, 16, 1093–1099 CrossRef CAS.
- D. Tabor and R. H. S. Winterton, Proc. R. Soc. London, Ser. A, 1969, 312, 435–450 CrossRef CAS.
- J. N. Israelachvili and D. Tabor, Proc. R. Soc. London, Ser. A, 1972, 331, 19–38 CrossRef CAS.
- J. N. Israelachvili and P. M. McGuiggan, J. Mater. Res., 1990, 5, 2223–2231 CrossRef CAS.
- M. Heuberger, Rev. Sci. Instrum., 2001, 72, 1700–1707 CrossRef CAS.
- M. Heuberger, J. Vanicek and M. Zäch, Rev. Sci. Instrum., 2001, 72, 3556–3560 CrossRef CAS.
- M. Heuberger and M. Zäch, Langmuir, 2003, 19, 1943–1947 CrossRef CAS.
- J. Lyons, D. Furlong and T. Healy, Aust. J. Chem., 1981, 34, 1177–1187 CrossRef CAS.
- W. Sellmeier, Ann. Phys. Chem., 1871, 219, 272–282 CrossRef.
- M. A. Khashan and A. Y. Nassif, Appl. Opt., 1997, 36, 6843–6851 CrossRef CAS.
- P. Pacak, J. Solution Chem., 1987, 16, 71–77 CrossRef CAS.
- R. G. LeBel and D. A. I. Goring, J. Chem. Eng. Data, 1962, 7, 100–101 CrossRef CAS.
- A. M. Basedow, K. H. Ebert and W. Feigenbutz, Die Makromolekulare Chemie, 1980, 181, 1071–1080 CrossRef CAS.
- T. Abe, N. Higashi, M. Niwa and K. Kurihara, Langmuir, 1999, 15, 7725–7731 CrossRef CAS.
- E. Kutnyanszky and G. J. Vancso, Eur. Polym. J., 2012, 48, 8–15 CrossRef CAS.
- T. R. Matzelle, D. A. Ivanov, D. Landwehr, L. A. Heinrich, C. Herkt-Bruns, R. Reichelt and N. Kruse, J. Phys. Chem. B, 2002, 106, 2861–2866 CrossRef CAS.
- B. Park and N. I. Abu-Lail, Soft Matter, 2010, 6, 3898–3909 RSC.
- E. K. Dimitriadis, F. Horkay, J. Maresca, B. Kachar and R. S. Chadwick, Biophys. J., 2002, 82, 2798–2810 CrossRef CAS.
- X. Sui, Q. Chen, M. A. Hempenius and G. J. Vancso, Small, 2011, 7, 1440–1447 CrossRef CAS.
- Y. L. Chen, C. A. Helm and J. N. Israelachvili, Langmuir, 1991, 7, 2694–2699 CrossRef CAS.
- X. F. Sui, S. Zapotoczny, E. M. Benetti, P. Schon and G. J. Vancso, J. Mater. Chem., 2010, 20, 4981–4993 RSC.
- T. M. Birshtein and Y. V. Lyatskaya, Macromolecules, 1994, 27, 1256–1266 CrossRef CAS.
- G. S. Grest and M. Murat, Macromolecules, 1993, 26, 3108–3117 CrossRef CAS.
- P. C. Nalam, L. Daikhin, R. M. Espinosa-Marzal, M. Urbakh and N. D. Spencer, J. Phys. Chem. C, 2013 DOI:10.1021/jp310811a.
- C. J. Van Oss, Interfacial Forces in Aqueous Media, Taylor & Francis, 2006 Search PubMed.
- C. J. Van Oss, K. Arnold, R. J. Good, K. Gawrisch and S. Ohki, J. Macromol. Sci., Part A, 1990, 27, 563–580 CrossRef.
- I. I. Vaisman and M. L. Berkowitz, J. Am. Chem. Soc., 1992, 114, 7889–7896 CrossRef CAS.
- I. A. Borin and M. S. Skaf, J. Chem. Phys., 1999, 110, 6412–6420 CrossRef CAS.
- S. N. Shashkov, M. A. Kiselev, S. N. Tioutiounnikov, A. M. Kiselev and P. Lesieur, Phys. B, 1999, 271, 184–191 CrossRef CAS.
- S.-J. Hong, H.-T. Huang and P.-D. Hong, J. Appl. Polym. Sci., 2004, 92, 3211–3217 CrossRef CAS.
- F. R. Dintzis and R. Tobin, Carbohydr. Res., 1978, 66, 71–83 CrossRef CAS.
- A. M. Basedow, K. H. Ebert and J. Emmert, Die Makromolekulare Chemie, 1979, 180, 1339–1343 CrossRef CAS.
- A. Luzar and D. Chandler, J. Chem. Phys., 1993, 98, 8160–8173 CrossRef CAS.
- F. Oesterhelt, M. Rief and H. E. Gaub, New J. Phys., 1999, 1, 6 CrossRef.
- A. Halperin and D. E. Leckband, C. R. Acad. Sci., Ser. IV: Phys., Astrophys., 2000, 1, 1171–1178 CrossRef CAS.
- L. Dougan, G. Feng, H. Lu and J. M. Fernandez, Proc. Natl. Acad. Sci. U. S. A., 2008, 105, 3185–3190 CrossRef CAS.
- U. M. Apel, R. Hentschke and J. Helfrich, Macromolecules, 1995, 28, 1778–1785 CrossRef CAS.
- Z. Ahmed, E. A. Gooding, K. V. Pimenov, L. Wang and S. A. Asher, J. Phys. Chem. B, 2009, 113, 4248–4256 CrossRef CAS.
- J. A. W. Harings, Y. S. Deshmukh, M. R. Hansen, R. Graf and S. Rastogi, Macromolecules, 2012, 45, 5789–5797 CrossRef CAS.
- A. Halperin and M. Kröger, Macromolecules, 2011, 44, 6986–7005 CrossRef CAS.
- R. F. Lama and B. C. Y. Lu, J. Chem. Eng. Data, 1965, 10, 216–219 CrossRef CAS.
- M. T. Muller, X. P. Yan, S. W. Lee, S. S. Perry and N. D. Spencer, Macromolecules, 2005, 38, 3861–3866 CrossRef.
- J. S. Hou, V. C. Mow, W. M. Lai and M. H. Holmes, J. Biomech., 1992, 25, 247–259 CrossRef CAS.
- A. Nomura, K. Ohno, T. Fukuda, T. Sato and S. Tsuji, Polym. Chem., 2012, 3, 148 RSC.
Footnotes |
| † These authors contributed equally to this work. |
| ‡ Present address: Department of Mechanical Engineering and Applied Mechanics, University of Pennsylvania, Pennsylvania, USA. |
| This journal is © The Royal Society of Chemistry 2013 |