 Open Access Article
 This Open Access Article is licensed under a
 Creative Commons Attribution 3.0 Unported Licence
Core–shell nanoparticle monolayers at planar liquid–liquid interfaces: effects of polymer architecture on the interface microstructure†
Lucio
Isa
*a,
Davide C. E.
Calzolari‡
b,
Diego
Pontoni
b,
Torben
Gillich
a,
Adrienne
Nelson
a,
Ronald
Zirbs
c,
Antoni
Sánchez-Ferrer
d,
Raffaele
Mezzenga
d and
Erik
Reimhult
c
aETH Zurich, Laboratory for Surface Science and Technology, Department of Materials, Wolfgang-Pauli-Strasse 10, 8093 Zürich, Switzerland. E-mail: lucio.isa@mat.ethz.ch
bEuropean Synchrotron Radiation Facility, High-Energy Beamline ID15, 6 rue J. Horowitz, BP220, 38043 Grenoble, France
cUniversity of Natural Resources and Life Sciences Vienna, Institute for Biologically inspired materials, Department of Nanobiotechnology, Muthgasse 11-II, 1190 Vienna, Austria
dETH Zurich, Food and Soft Materials Science, Institute of Food, Nutrition & Health, Schmelzbergstrasse 9, 8092 Zurich, Switzerland
First published on 12th February 2013
Abstract
Self-assembly of core–shell nanoparticles (NPs) at liquid–liquid interfaces is rapidly emerging as a strategy for the production of novel nano-materials bearing vast potential for applications, including membrane fabrication, drug delivery and emulsion stabilization. The development of such nanoparticle-based materials is facilitated by structural characterization techniques that are able to monitor in situ the self-assembly process during its evolution. Here, we present an in situ high-energy X-ray reflectivity study of the evolution of the vertical position (contact angle) and inter-particle spacing of core–shell iron oxide–poly(ethylene glycol) (PEG) nanoparticles adsorbing at flat, horizontal buried water–n-decane interfaces. The results are compared with time-resolved interfacial tension data acquired with the conventional pendant drop method. We investigate in particular the effect of varying polymer molecular weights (2–5 kDa) and architectures (linear vs. dendritic) on the self-assembly process and the final structure of the interfacially adsorbed NP monolayers. Linear PEG particles adsorb more rapidly than dendritic PEG ones and reach full interface coverage and stable NP monolayer structure, while dendritic PEG particles undergo a slower adsorption process, which is not completed within the experimental time window of ∼6 hours. All NPs are highly hydrophilic with effective contact angles that depend weakly on PEG molecular weight and architecture. Conversely, the in-plane NP separation depends strongly on PEG molecular weight. The measured inter-particle separation at full interface coverage yields low iron oxide core content, indicating a strong deformation and flattening of the linear PEG shell at the interface. This finding is supported by modeling and has direct implications for materials fabrication, e.g. for the realization of core–shell NP membranes by in situ cross-linking of the polymer shells.
1 Introduction
Self-assembly of nanoparticles (NPs) has recently seen an upsurge as a strategy to obtain novel materials due to the extraordinary physical and chemical properties of the nanoscale building blocks and the potential for parallel fabrication of complex hierarchical structures.1–4 Despite the great promise, the design of functional materials that can be precisely structured via fine-tuning of the building block properties still remains an open challenge.A promising approach for achieving the desired structural and functional control involves the assembly of core–shell NPs at liquid–liquid interfaces.5 In these interfacial systems, the inorganic cores can act as sensors or actuator elements, while solvated polymer shells can provide NP stabilization, guide the assembly, and enable responsive functions.6,7 Independent tuning of the core and shell properties enables control over inter-particle separation, microstructure, and mechanical properties of the final assemblies. These aspects are particularly relevant for NP self-assembly at liquid interfaces (SALI).8,9 Adsorption of composite, surface-active nanoparticles at liquid interfaces can in fact be used to produce controlled quasi-two-dimensional (2D) assemblies such as macroscopic planar membranes,10 or microscopic responsive capsules and vesicles,11–15 which are particularly suitable for delivering hydrophobic compounds. We expect that the conformation taken by the polymer shell will influence the NP location with respect to the liquid–liquid interface and the lateral separation between neighboring adsorbed NPs. In addition, specific conformations of the polymer capping may enhance the exposure of selected end-groups to either liquid phase, and enable selective cross-linking and/or additional functionalization. Recent work has started to address in detail various aspects of core–shell NP-SALI, such as the kinetics and energetics of assembly, NP concentration and polydispersity effects, shell structure and hydration.6,7 However, crucial information on the position of NPs upon adsorption and on their shell conformation at liquid–liquid interfaces is still scarce.
The position of adsorbed NPs relative to an oil–water interface is univocally related to their contact angle, which in the ideal case depends only on the interfacial tensions between the three materials comprising the system. The contact angle affects the interfacial NP adsorption energy16 and determines the local environment,17i.e. the cross-section occupied by the NP at the interface and the fraction of the NP surface exposed to either liquid. This can strongly influence the interactions experienced by the adsorbed NPs.18 For these reasons a host of different methods has been developed to measure contact angles of NPs at interfaces,19–24 with recent developments reaching single-particle contact angle detection capability in the 10 nm NP size range.25 Many of these methods are indirect and rely on assumptions which break down for core–shell objects (e.g. particle incompressibility); moreover, often they have low sensitivity or limited applicability for in situ time-resolved investigations. For deformable objects such as soft core–shell NPs the very definition of contact angle becomes imprecise because the presence of a diffuse shell of thickness comparable to or larger than the particle size makes it impossible to define a true three-phase contact line. Therefore, only “effective” contact angles can be defined by measuring the distance between the liquid–liquid interface and the centre of the solid core of the adsorbed core–shell NP. Recent work has indeed shown that the presence of a deformable shell plays a significant role in determining the energetics of composite particle adsorption.6,26
X-ray reflectivity has been used successfully to determine the structure of core–shell NPs adsorbed at the water–air interface.27 Extension of these studies to NPs bound to buried liquid–liquid interfaces9,28 is particularly attractive both for addressing fundamental scientific questions and for improving a wide range of applications such as emulsion stabilization, capsule formation, drug delivery and ultra-filtration. Recent developments involving the use of monochromatic and focused synchrotron hard X-ray beams29 demonstrated the high resolution structural characterization capability offered by high-energy X-ray reflectivity (HE-XR) for systems ranging from atomically layered liquid metals,30 to interfacially frozen molecular films31,32 and polarized electrolyte solution interfaces.33 Application of HE-XR to silica NP monolayers obtained in the presence of surfactants at water–hexane interfaces34 has also demonstrated accurate in situ NP contact angle determination. This is achieved by fitting the reflectivity profiles using a model that includes all the relevant physical properties of the NP system under investigation.34 In this article, we apply the above mentioned approach to study in situ the time evolution of the vertical position (contact angle) and the inter-particle spacing of composite NPs adsorbing at flat, horizontal water–n-decane interfaces. The NPs comprise an iron oxide core grafted with various architectures of dense poly(ethylene glycol) shells.35
2 Experimental section
2.1 Materials
For all experiments we used n-decane (99%, Sigma-Aldrich) purified from polar impurities by 5 cycles in a basic alumina column (Aluminum oxide activated basic, Brockmann I, Acros Organics) and in MilliQ water (R = 18.2 MΩ cm, TAC ≤ 6 ppb).The core–shell NPs were synthesized and functionalized in house. Full details can be found in ref. 35.
2.2 Methods
2.2.4.1 Sample cell for X-ray studies. The HE-XR measurements were carried out in a custom-built monolithic polyoxymethylene (POM) cell (Fig. 2a, more details in the ESI†) comprising an internal 2 × 8 cm2 trough hosting the aqueous NP solution (light blue in Fig. 2a) which is completely covered by an external bulk n-decane phase (light yellow in Fig. 2a). The 1 × 10⁻⁵ mol aqueous NP suspension was slowly injected through the cell bottom using a remotely controlled high-precision syringe pump until a flat air–water interface was created. The flatness of the interface was monitored by scanning the cell vertically through the horizontally aligned micro-focused X-ray beam and by detecting the reflected X-ray beam at incidence angles comparable to the critical angle for total external reflection (a few hundredths of a degree at the working X-ray energy of ∼70 keV). n-Decane was then carefully poured along the internal wall of the cell in order to slowly cover the water surface and create a buried planar water–n-decane interface. The n-decane layer covering the water surface was a few mms thick in order to ensure that at all the reflection angles explored (typically between 0 and 0.5 degrees) both the incident and the reflected X-ray beams traversed only the oil bulk phase and did not reach the free oil–air interface before exiting the sample cell (Fig. 2a). The incident beam entered the liquid cell through a 1 mm thick POM window, was partially reflected by the liquid–liquid interface, exited the cell through a second 1 mm thick window, and reached a point detector aligned behind two sets of collimating slits (not shown in Fig. 2a). The incidence (α) and reflection (β = α) angles are scanned simultaneously to produce a reflectivity profile as a function of the momentum transfer q = 4πsin(α)/λ, where λ ≅ 0.177 Å is the typical X-ray wavelength used in the HE-XR experiments. The X-ray beam footprint on the reflecting liquid–liquid interface is approximately 3 cm long near the critical angle for total external reflection (∼0.009 degrees) and remains still several mm long at the largest angles explored (∼0.4 degrees).29
2.2.4.2 Physical model for XR data fitting. The measured reflectivity curve is related, via a Fourier transform, to the sample's interface-normal electron density profile ρ(z) averaged within the plane of the reflecting interface. To model the interfacial NP monolayer's ρ(z) profile we used a recently introduced approach,34 which takes into account the spherical shape of the NPs and the main physical parameters describing the interface:
| ρ(z) = ρi(z) + ∫∫[ρNP(sav,ρp;z) − ρNP(sav,ρi(z);z)]G(rav,σr;r)G(hav,σh;h)drdh | (1) |
ρ i(z) describes the bare interface between water (bulk electron density ρw = 0.334 e Å−3) and n-decane (ρd = 0.253 e Å−3) with an interface roughness σi:
 | (2) |
The term ρNP(z) represents the contribution of the NP monolayer to the interfacial electron density. The NP film is modelled as a monolayer of hexagonally ordered spheres of radius r, immersion depth h, lateral separation sav and bulk electron density ρp (Fig. 2b):
 | (3) |
3 Results and discussion
In this article we study a series of NPs with iron oxide cores stabilized by shells of irreversibly grafted PEG of different molecular weights and architectures. The spherical iron oxide cores (d = 8.4 ± 1.4 nm from SAXS, see ESI†) are prepared by high temperature decomposition of Fe(acac)3 in oleylamine according to ref. 35. The as-synthesized cores are subsequently stabilized by ligand replacement of oleylamine for PEG–nitrodopamine, whose strong binding results in a dense, irreversibly adsorbed PEG shell.37,38 We prepared three different core–shell particle batches stabilized by linear PEG of 5 kDa (L5) and 2.5 kDa (L2.5) molecular weight (Mw), and dendritic PEG with a molecular weight of 2.5 kDa39 (D2.5) (see Table 1 and Fig. 1). The effective thickness of the PEG shell was estimated by measuring the hydrodynamic diameter of the particles in MilliQ water by DLS and subtracting the core size measured by SAXS (see Table 1). All NPs have similar grafting density (determined by TGA) in the range 0.56 to 0.73 chains per nm2. The 5 kDa linear PEG yields thicker shells (ts ∼ 10.8 nm) than the 2.5 kDa linear PEG (ts ∼ 7.3 nm). For similar molecular weight and grafting density, the linear PEG particles L2.5 have thicker stabilizing shells than the dendritic PEG particles D2.5 (ts ∼ 4.3 nm).| NP batch | d [nm] | PEG Mw [g mol−1] | n [chains per nm2] | t s [nm] | ξ [mV] |
|---|---|---|---|---|---|
| L5 | 8.4 ± 1.4 | 5557 | 0.56 | 10.8 | −1.42 ± 0.10 |
| L2.5 | 8.4 ± 1.4 | 2737 | 0.69 | 7.3 | −3.16 ± 0.08 |
| D2.5 | 8.4 ± 1.4 | 2477 | 0.73 | 4.3 | −9.80 ± 0.10 |
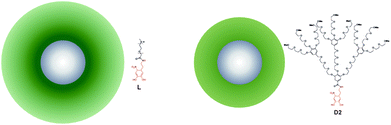 | ||
| Fig. 1 Schematic representation of the core–shell NPs. Left: L2.5 is stabilized by linear 2.5 kDa PEG. Right: D2.5 is stabilized by 2nd generation dendritic 2.5 kDa PEG. The relative sizes are to scale. | ||
NPs adsorb at the interface as a function of time and therefore induce a time evolution of the system's electron density profile normal to the water–decane interface. Since the electron density of iron oxide (ρp = 1.473 e Å−3) is higher than those of both water and n-decane, the electron density profile measured by HE-XR exhibits a maximum in correspondence to the average position of the NP core center relative to the water–n-decane interface. Due to the very low electron density contrast between solvated PEG and the liquids, the density profile of the stabilizing shell cannot be determined accurately with our method. Including polymer shells and/or flat polymer films adsorbed at the interface into complementary modelling can in fact be only used to quantify the uncertainties in the parameters of the fitting procedure and not to resolve directly the polymer structure.34 The average effective contact angles θav are calculated from the fitted core immersion depth hav and the known average core size rav (Fig. 2b), as θav = arccos((hav/rav) − 1). Errors determining the contact angles include particle size polydispersity and a distribution of water immersion values (see eqn (1)). An additional source of errors could be a shift in the localization of the interface due to the presence of the interfacial PEG layer, as mentioned above. In any case, due to the fact that the electron density of hydrated PEG is found to differ from the one of bulk water by only 3% (see ESI†), we expect to be fairly insensitive to such variation and thus to be able to locate the interface with high accuracy. The reported errors represent a conservative estimate of the combinations of these effects.
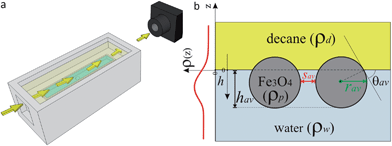 | ||
| Fig. 2 (a) Schematic representation of the HE-XR experimental geometry. The yellow arrows represent the X-ray beam which impinges on the liquid–liquid interface and is reflected towards the detector. (b) Scheme of the experimental quantities in the HE-XR experiments. The average NP immersion depth hav is obtained from the fitted electron density profile ρ(z) (red line) and an effective average contact angle θav can be calculated. Assuming uniform hexagonal packing and core radius rav, the average core-to-core inter-particle separation sav can be calculated from the amplitude of the ρ(z) peak. | ||
The amplitude of the oscillations observed in the measured reflectivity profiles (Fig. 3) is related to the average electron density of the interfacial NP layer. Assuming a uniform hexagonal packing for the interfacially adsorbed NPs, the average lateral separation sav (Fig. 2b) between the surface of neighboring NPs is obtained via model fitting (eqn (1)) of the experimental HE-XR profiles.
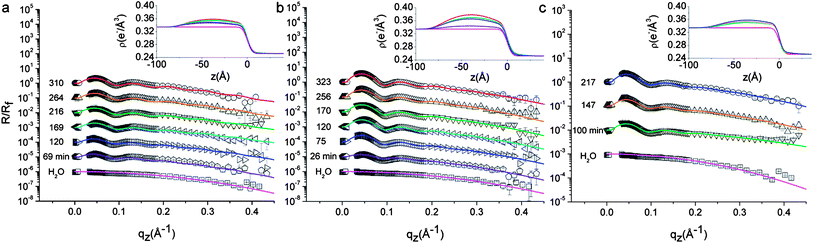 | ||
| Fig. 3 Measured HE-XR profiles normalized by the theoretical Fresnel reflectivity for L5 (a), L2.5 (b) and D2.5 (c). The experimental data points (symbols), fits (solid lines), and the corresponding electron density profiles ρ(z) (insets) are shown for different adsorption times as indicated in the graphs (curves are shifted for clarity). The times of the data points correspond to the abscissa values of Fig. 4b–c. All graphs include the bare water–n-decane interface reflectivity profile at the bottom (□). Micron level misalignments between the X-ray beam and the interface in some of the measurements affect the quality of the data points near the critical angle, therefore they are excluded from the graph and from the model fitting procedure. | ||
Fig. 3 shows representative measured reflectivity curves normalized by the theoretical Fresnel reflectivity Rf for the investigated NPs. In the absence of NPs at the interface, the reflectivity signal decays monotonically as a function of q (bottom curve in all figures). The corresponding electron density profile is modeled by an error function connecting the bulk water and n-decane electron densities, with a Gaussian width σi = 4.0 Å representing the interface roughness induced by thermally excited capillary waves (see eqn (2)). This fitted value is only slightly larger than the theoretical capillary-wave-roughness σCW ∼ 3.0 Å, as calculated40 for a typical interface tension γ = 35 mN m−1 and taking into account the instrumental resolution of our setup (δqz = 0.03 Å−1). Using Fig. 3a as an example, we observe that oscillations in the reflectivity signal develop upon L5 NP adsorption as a function of time and that the period of the R/Rf oscillations agrees well with the average NP size determined by SAXS, thus confirming that the interfacial film consists of a NP mono-layer. With increasing adsorption times, the oscillations in the reflectivity profiles become more pronounced. This is a signature of the increasing packing of the NPs within the plane of the interface. The fitted electron density profiles ρ(z) presented in the insets of Fig. 3 exhibit a maximum which increases with adsorption time suggesting a progressive accumulation of NPs. The ρ(z) maxima are always on the water side of the interface (negative z), as expected for hydrophilic NPs. It should be recalled in this context that XR modeling does not guarantee the uniqueness of the solution. We performed a thorough search for alternative solutions based on conventional box-models and model independent approaches.34 We could indeed find a second set of solutions in which the particles appeared as highly hydrophobic, but the fit quality was lower, as attested by the reduced chi-squared value of the fits. In addition, given PEG's high water solubility and poor n-decane solubility,6 the highly hydrophobic solution was discarded as non-physically justifiable and we retained the best fit sets reported in Fig. 3. A second trend observed in these fits regards the location of the maximum in ρ(z), which tends to shift towards less negative z values, suggesting a small but progressive increase of the effective contact angle with adsorption time. Qualitatively similar trends are observed also in the reflectivity data from L2.5 (Fig. 3b) and D2.5 (Fig. 3c) NPs. The shifts would be more pronounced in denser monolayers, e.g. obtained from NPs coated with shorter stabilizing layers. Additional experiments are needed to characterize fully the details of contact angle variations, however below we summarize and interpret the results extracted from the data and fits of Fig. 3 in relation to Fig. 4, which reports the temporal evolution of the fitted inter-particle separation (Fig. 4b) and effective contact angle (Fig. 4c).
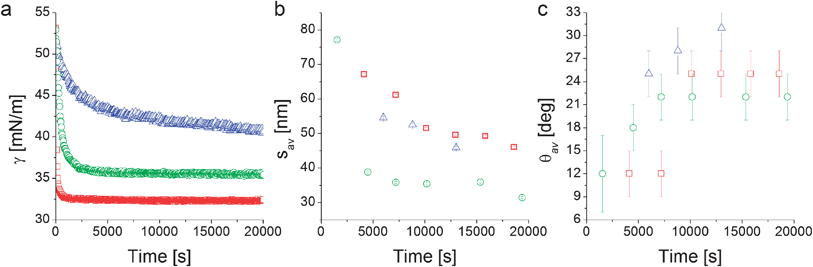 | ||
| Fig. 4 Interfacial tension measurements from pendant drop tensiometry (a), fitted average inter-particle separation (b) and contact angle (c) from XR data modeling as a function of time for the nanoparticles L5 (□), L2.5 (○), and D2.5 (Δ). | ||
Complementary pendant drop tensiometry on the same suspensions used for XR (Fig. 4a) shows that the apparent interfacial tension γ of an aqueous NP suspension in n-decane decreases with time, indicating NP adsorption at the interface. In particular we find that the linear-PEG particles L5 and L2.5 adsorb very rapidly upon droplet formation and that the apparent interfacial tension stabilizes at a constant value. The long-time γ value depends on the linear PEG molecular weight as previously reported.6 In our previous work we also demonstrated that both the temporal evolution and the plateau values of γ for free PEG in solution differ from the ones obtained using NPs stabilized by PEG of the same molecular weight due to conformational constraints and to the fact that the high grafting density allows for more polymers to be transported to the interface by the NPs.6
The time evolution of γ is different for the particles stabilized with the dendritic PEG, where the adsorption proceeds much more slowly and the interfacial tension does not reach a constant value within an experimental observation time of ∼6 hours. We hypothesize that this may be due to a combination of two main factors. First, the D2.5 particles present a significant surface charge (Table 1).35 Upon interfacial adsorption, a like-charge layer is formed and additional NP adsorption implies overcoming an electrostatically repulsive barrier. Second, the presence of a more rigid dendritic PEG shell makes it possible to approximate the particle as a hard object and thus easily calculate a binding energy after measuring the single-particle average contact angle as ΔE = −γ0πr2(1 − cos θav)2,16 where r is the core radius plus shell thickness and γ0 is the interfacial tension of pure water–n-decane. From the first measured values of θav reported in Fig. 4c the average adsorption energy at short times is calculated to be ∼20 kBT. Due to particle polydispersity and to the quadratic dependence of the binding energy on the particle size, it is possible that smaller NPs can reversibly adsorb and desorb. This can lead to a slowing down of the build-up of the interfacial coverage and to size-selection of larger particles as highlighted by simulations and experiments.6,41 The higher values of θav at longer times shift the adsorption energy towards irreversible interfacial trapping. The case is different for the NPs stabilized by linear PEG where including the interaction of the soft polymer shell with the two liquids into the interfacial trapping energy calculation leads to values in the thousands of kBT range for similarly sized NPs and polymers,6 implying irreversible adsorption during the entire adsorption process.
From Fig. 4b we notice that the time evolution of the inter-particle separation sav measured by XR follows qualitatively the increase of interfacial NP coverage that is revealed by the PDT-determined reduction of γ. Fig. 4b suggests the same γ-related qualitative difference in the behavior between NPs stabilized by linear and dendritic PEG. Linear PEG NPs tend towards a saturation of the inter-particle spacing for adsorption times of 5000 to 10![[thin space (1/6-em)]](https://www.rsc.org/images/entities/char_2009.gif) 000 s, while the dendritic NPs are characterized by a continuous densification, at least within the time window accessed by the experiment. The step-like changes in the values of sav at the longest adsorption times (∼20000 s) for the linear PEG NPs may be due to structural rearrangements and further densifications at the interface which are not detected by macroscopic tensiometry. Such late-stage step-like increases of the interfacial NP density are consistent with numerical simulations of densely populated core–shell NP-laden interfaces, where both size polydispersity and cooperative phenomena appear to be at the origin of abrupt further NP monolayer densification via collective NP structural rearrangements.42 We remark here that the error bars reported in Fig. 4b represent the errors of the XR fitting routine and may underestimate the real variations of the inter-particle separations, stemming above all from size polydispersity and non-uniform coverage over the large area illuminated by the X-ray beam.
000 s, while the dendritic NPs are characterized by a continuous densification, at least within the time window accessed by the experiment. The step-like changes in the values of sav at the longest adsorption times (∼20000 s) for the linear PEG NPs may be due to structural rearrangements and further densifications at the interface which are not detected by macroscopic tensiometry. Such late-stage step-like increases of the interfacial NP density are consistent with numerical simulations of densely populated core–shell NP-laden interfaces, where both size polydispersity and cooperative phenomena appear to be at the origin of abrupt further NP monolayer densification via collective NP structural rearrangements.42 We remark here that the error bars reported in Fig. 4b represent the errors of the XR fitting routine and may underestimate the real variations of the inter-particle separations, stemming above all from size polydispersity and non-uniform coverage over the large area illuminated by the X-ray beam.
In addition to the details of the temporal evolution of sav, its long-time value is in itself very useful for extracting general information regarding the structure of the NP film adsorbed at the interface. In the case of dendritic-PEG particles the rather limited number of available data points and the continuous evolution (Fig. 4b) do not guarantee that the final stable structure has been probed. However it is evident that the lateral separation between D2.5 particles (∼45 nm) is much larger than twice the dendritic shell thickness measured in the bulk water phase (∼8.6 nm, Table 1). For D2.5 NPs, a non-negligible surface charge is present, as suggested by their zeta potential of approximately −10 mV (Table 1). Such a surface charge may be responsible for long-range repulsions through the water phase thus yielding large NP separation, which for charged particles at interfaces is expected to decrease with increasing particle concentration.43 Dipolar interactions at the interface may also play a role, but should be weak due to the strongly hydrophilic character of the NPs.44,45 A complete understanding of the dendritic-PEG NP system requires additional investigations spanning longer experimental time windows.
The more abundant data collected on the linear-PEG systems allow us to discuss more deeply the details of their interfacial structure. In particular, it is evident from Fig. 4b that the inter-particle separation for L2.5 and L5 particles is also considerably larger than twice the thickness of the PEG shell in bulk water both from experiments (Table 1) and theoretical calculations.6 For linear-PEG NPs, charge effects should be negligible due to thick polymer shells, their low zeta potentials and strong partitioning to the water side (see Table 1, especially for L5). It is therefore likely that the polymer conformation at the interface is responsible for and dominates the microstructure of the adsorbed NP monolayer. From Fig. 4b it is also evident that at long times the particles stabilized by the shorter PEG chains pack more closely at the interface. This implies that, at least for L5, the shells are in direct steric contact since any residual charge repulsion would yield a larger sav for L2.5 than for L5, stemming from the higher surface charge of the former (see Table 1). The choice of PEG molecular weight thus allows controlling the nanoparticle density within the adsorbed NP film, as well as the time scale of the self-assembly process. Irreversible adsorption implies that – in the presence of excess NPs in the bulk water phase as in our case – adsorption ceases only when the interface is fully covered by particles. Furthermore, the lateral mobility of non-interacting NPs at the interface ensures that a packing fraction higher than that yielded by random sequential adsorption can be reached.46 The measured values of sav at long times indicate that at saturation the NP cores occupy only a small fraction of the interface (2.2% and 4.0% for L5 and L2.5, respectively). This means that the space between NP cores has to be occupied by the polymer shells, which in turn requires a major deformation and stretching of the polymer chains at the interface. Recent direct observations of the conformation of surface-active, deformable microgel particles have indeed demonstrated that such objects flatten significantly at liquid–liquid interfaces, taking sizes up to twice their hydrated size in bulk.47 As in the latter case, the conformation of the polymer shell at the interface for our NPs is given by a balance between PEG's solubility in the two liquids, its surface activity at water–n-decane interfaces and the entropic elasticity of the polymer shell at the interface. PEG chains can directly adsorb at the interface, where they tend to occupy as much interfacial area as possible by assuming stretched conformations that are more elongated than those encountered in bulk water. The free energy gain of interfacial adsorption is balanced by the loss of entropy in the brush until the equilibrium configuration is achieved. This situation can to a first approximation be modeled by calculating the thickness ti of a “quasi-2D” brush of PEG chains grafted onto a spherical band of radius c. The latter corresponds to the radius of the NP core cross-section at the position of the interface, and is calculated using the measured θav values (Fig. 5). The width δ of the spherical band on the NP core corresponds to an effective thickness of the interface. Previous studies showed partial liquid mixing and thermal fluctuations at interfaces play a significant role in NP adsorption,48 leading to an effective interface thickness which can easily be of the order of 2–3 nm, i.e. considerably larger than the theoretical capillary wave thickness. For our core–shell particle system, this means that PEG chains within at least such thickness can directly participate in interfacial adsorption and therefore determine the final structure of the adsorbed NP monolayer. Moreover, numerical simulation studies have shown that sufficiently flexible stabilizing shells can be deformed to enhance interface coverage,26,49 implying that also chains not residing exactly at the interface can contribute to the formation of a two-dimensional interfacial polymer film, with the effect of increasing the “quasi-2D” grafting density. Adapting our previous calculations of an Alexander brush tethered onto a spherical surface to a 3 nm slice on the NP surface,6 we can calculate the thickness of an a-thermal 2D PEG brush with an effective linear grafting density ni obtained by projecting the number of chains participating in the interfacial adsorption onto the contour of the particle cross-section. The calculation results are summarized in Table 2 and compared to the saturation values of sav.
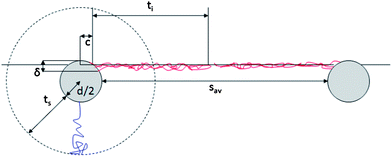 | ||
| Fig. 5 Schematic representation of shell conformation and NP arrangement at the interface. The drawing is to scale for L5. | ||
| NP batch | c [nm] | δ [nm] | n i [chains per nm] | t i [nm] | δ [nm] | n i [chains per nm] | t i [nm] | s av [nm] |
|---|---|---|---|---|---|---|---|---|
| L5 | 1.78 | 2 | 3.73 | 20.6 | 3 | 5.6 | 22.9 | 46.0 |
| L2.5 | 1.57 | 2 | 4.6 | 12.1 | 3 | 6.9 | 13.5 | 31.4 |
This simple calculation hints already towards agreement with the experimental values and supports our interpretation of the interface microstructure as represented in Fig. 5. More detailed quantitative comparisons with refined models would require a detailed knowledge of the actual polymer density profile of the deformed shell under the asymmetric solvation conditions at the water–n-decane interface. Additionally, the measured values of sav rely on the assumption of uniform hexagonal packing at the interface; non-uniform coverage and a non-crystalline interface imply that the values extracted from the fit overestimate the real inter-particle separation. Again, a more quantitative comparison would require the detailed knowledge of the local interface microstructure. However, the applied model already highlights the occurrence of severe shell deformation at the interface in agreement with the experiments.
In addition to the evolution of the inter-particle separation, the XR data suggest an intriguing evolution of the NP contact angle, which varies with PEG MW and architecture (Fig. 4c). The contact angles of the linear-PEG particles exhibit a relatively slow increase and saturate at time scales comparable to the stabilization time for sav (Fig. 4b). Conversely, the dendritic PEG particles are characterized by a continuous increase of the contact angle. The slow contact angle evolution for the dendritic PEG NPs might be due to a progressive removal of water strongly trapped in the hydrated PEG shells which surround the particles even on the n-decane side. Recent experiments on larger polymer-stabilized colloids have indeed demonstrated that hydrophilic stabilizing shells maintain a certain degree of hydration even if partially compressed on the oil side of the interface.50 The long-time evolution of contact angles may also be ascribed to heterogeneity and defects on the NP surfaces leading to pinning and de-pinning of contact lines, which has been observed for microparticles.51 This mechanism might also be relevant for the macromolecular roughness of a grafted polymer shell particle. For the linear PEG NPs, the qualitative correspondence between the time evolution of contact angles and inter-particle separation suggests that the former could stem from collective effects and interactions between particles, even though a higher time resolution is needed to discuss the details of the time evolution as a function of PEG molecular weight. Given the highly hydrophilic character of PEG and its strong interfacial activity, the NP equilibrium position at the interface, and thus the contact angle, are determined by a balance between maximizing the volume of PEG exposed to the water, the amount of PEG adsorbed at the interface and the cross-section of the solid core sitting at the interface, and at the same time minimizing the amount of PEG exposed to n-decane. Our results suggest that for longer PEG chains the above balance is achieved at a smaller value of hav thus yielding a higher effective contact angle. As mentioned before, the D2.5 particles are expected to behave similarly to charged hard spheres where the main contribution to determining the position at the interface comes from surface wettability and particle size (removal of free interfacial area), with the presence of aromatic rings in the dendrons which may lead to more hydrophobic particles.
4 Conclusions
In this article we have reported the time evolution of the vertical position (contact angle) of core–shell NPs relative to a flat horizontal water–decane interface, as well as their lateral separation within the interface. These results were enabled by HE-XR and accurate fitting of the reflectivity curves according to a recently demonstrated procedure which accounts for the physical properties of the particles.34 Our results show that the architecture of the stabilizing shell controls the adsorption behavior of NPs at liquid interfaces. In particular, we found that NPs stabilized by rigid dendritic PEG shells exhibit a behaviour similar to hard charged objects, with the NP contact angle evolving with time at the interface. This may be ascribed to a slow loss of hydration upon exposure to organic solvent or contact line pinning and evolution. On the other hand, NPs stabilized by linear PEG showed an evolution to an equilibrium contact angle which is likely the consequence of interactions with other particles adsorbing at the interface. For the latter, we reported that the separation between NP cores at long times (at or close to interface saturation) was much larger than the size of the hydrated polymer shell in bulk. This cannot be explained by electrostatic repulsion stemming from a residual charge at the core surface due to the screening of the thick polymer shells and the highly hydrophilic NP nature. This implies that saturation is achieved with a low NP core content at the interface and that most of the space is filled by the polymer shells. This in turn requires strong deformation and flattening of the polymer shells at the interface. The resulting observed inter-particle distance is supported by a simple model for a two-dimensional polymer brush confined within the interface.Our results have strong implications for the design and realization of NP membrane materials obtained by assembly of NPs at emulsion and other oil–water interfaces. Changes in the conformation of the polymer shells affect the interfacial NP core density and the shell density distribution at the interface. These in turn can be exploited, for instance, to expose specific active groups to obtain permanent crosslinking at the interface, or for developing specific interfacial molecular capture strategies. Our findings also motivate additional fundamental investigations of the behavior of soft objects at interfaces.
Acknowledgements
The authors are thankful to Patrick Ilg and Martin Kröger for the calculations of the 2D brushes and useful discussions. Marcus Textor, Dieter Schlüter and Nicholas D. Spencer are acknowledged for discussions and support during the NP synthesis. Christian Roth and Martin Elsner are acknowledged for the fabrication of the liquid cell. L.I. acknowledges financial support from MC-IEF- 2009-252926 and SNSF Ambizione (PZ00P2_142532/1). The authors thank the ESRF for support and provision of beam time and the MPI-Stuttgart for access to the High Energy Micro-Diffraction instrument (ID15A).References
- S. C. Glotzer and M. J. Solomon, Nat. Mater., 2007, 6, 557–562 CrossRef.
- M. Grzelczak, J. Vermant, E. M. Furst and L. M. Liz-Marzan, ACS Nano, 2010, 4, 3591–3605 CrossRef CAS.
- Y. Lin, A. Boker, J. B. He, K. Sill, H. Q. Xiang, C. Abetz, X. F. Li, J. Wang, T. Emrick, S. Long, Q. Wang, A. Balazs and T. P. Russell, Nature, 2005, 434, 55–59 CrossRef CAS.
- Z. H. Nie, A. Petukhova and E. Kumacheva, Nat. Nanotechnol., 2010, 5, 15–25 CrossRef CAS.
- V. Garbin, J. C. Crocker and K. J. Stebe, J. Colloid Interface Sci., 2012, 387, 1–11 CrossRef CAS.
- L. Isa, E. Amstad, K. Schwenke, E. Del Gado, P. Ilg, M. Kroger and E. Reimhult, Soft Matter, 2011, 7, 7663–7675 RSC.
- L. Isa, E. Amstad, M. Textor and E. Reimhult, Chimia, 2010, 64, 145–149 CrossRef CAS.
- A. Boeker, J. He, T. Emrick and T. P. Russell, Soft Matter, 2007, 3, 1231–1248 RSC.
- Y. Lin, A. Boker, H. Skaff, D. Cookson, A. D. Dinsmore, T. Emrick and T. P. Russell, Langmuir, 2005, 21, 191–194 CrossRef CAS.
- Y. Lin, H. Skaff, A. Boker, A. D. Dinsmore, T. Emrick and T. P. Russell, J. Am. Chem. Soc., 2003, 125, 12690–12691 CrossRef CAS.
- E. Amstad, J. Kohlbrecher, E. Mueller, T. Schweizer, M. Textor and E. Reimhult, Nano Lett., 2011, 11, 1664–1670 CrossRef CAS.
- E. Amstad and E. Reimhult, Nanomedicine, 2012, 7, 145–164 CrossRef CAS.
- H. W. Duan, D. Y. Wang, N. S. Sobal, M. Giersig, D. G. Kurth and H. Mohwald, Nano Lett., 2005, 5, 949–952 CrossRef CAS.
- D. A. Gorin, S. A. Portnov, O. A. Inozemtseva, Z. Luklinska, A. M. Yashchenok, A. M. Pavlov, A. G. Skirtach, H. Mohwald and G. B. Sukhorukov, Phys. Chem. Chem. Phys., 2008, 10, 6899–6905 RSC.
- J. Zhang, R. J. Coulston, S. T. Jones, J. Geng, O. A. Scherman and C. Abell, Science, 2012, 335, 690–694 CrossRef CAS.
- P. Pieranski, Phys. Rev. Lett., 1980, 45, 569–572 CrossRef CAS.
- Y. Peng, W. Chen, T. M. Fischer, D. A. Weitz and P. Tong, J. Fluid Mech., 2009, 618, 243–261 CrossRef CAS.
- F. Bresme and M. Oettel, J. Phys.: Condens. Matter, 2007, 19, 413101 CrossRef.
- J. H. Clint and S. E. Taylor, Colloids Surf., 1992, 65, 61–67 CrossRef CAS.
- D. O. Grigoriev, J. Kragel, V. Dutschk, R. Miller and H. Moehwald, Phys. Chem. Chem. Phys., 2007, 9, 6447–6454 RSC.
- B. P. Binks, J. H. Clint, A. K. F. Dyab, P. D. I. Fletcher, M. Kirkland and C. P. Whitby, Langmuir, 2003, 19, 8888–8893 CrossRef CAS.
- E. Hild, T. Sesztak, D. Volgyes and Z. Horvolgyi, Prog. Colloid Polym. Sci., 2004, 125, 61–67 CAS.
- D. Y. Zang, A. Stocco, D. Langevin, B. B. Wei and B. P. Binks, Phys. Chem. Chem. Phys., 2009, 11, 9522–9529 RSC.
- L. N. Arnaudov, O. J. Cayre, M. A. C. Stuart, S. D. Stoyanov and V. N. Paunov, Phys. Chem. Chem. Phys., 2010, 12, 328–331 RSC.
- L. Isa, F. Lucas, R. Wepf and E. Reimhult, Nat. Commun., 2011, 2, 438 CrossRef.
- K. A. Tay and F. Bresme, J. Am. Chem. Soc., 2006, 128, 14166–14175 CrossRef CAS.
- C. Stefaniu, M. Chanana, H. Ahrens, D. Y. Wang, G. Brezesinski and H. Mohwald, Soft Matter, 2011, 7, 4267–4275 RSC.
- S. Kubowicz, M. A. Hartmann, J. Daillant, M. K. Sanyal, V. V. Agrawal, C. Blot, O. Konovalov and H. Mohwald, Langmuir, 2009, 25, 952–958 CrossRef CAS.
- V. Honkimaki, H. Reichert, J. S. Okasinski and H. Dosch, J. Synchrotron Radiat., 2006, 13, 426–431 CrossRef CAS.
- L. Tamam, D. Pontoni, T. Hofmann, B. M. Ocko, H. Reichert and M. Deutsch, J. Phys. Chem. Lett., 2010, 1, 1041–1045 CrossRef CAS.
- B. M. Ocko, H. Hlaing, P. N. Jepsen, S. Kewalramani, A. Tkachenko, D. Pontoni, H. Reichert and M. Deutsch, Phys. Rev. Lett., 2011, 106, 137801 CrossRef CAS.
- L. Tamam, D. Pontoni, Z. Sapir, S. Yefet, E. Sloutskin, B. M. Ocko, H. Reichert and M. Deutsch, Proc. Natl. Acad. Sci. U. S. A., 2011, 108, 5522–5525 CrossRef CAS.
- J. F. L. Duval, S. Bera, L. J. Michot, J. Daillant, L. Belloni, O. Konovalov and D. Pontoni, Phys. Rev. Lett., 2012, 108, 206102 CrossRef.
- D. Calzolari, D. Pontoni, M. Deutsch, H. Reichert and J. Daillant, Soft Matter, 2012, 8, 11478–11483 RSC.
- T. Gillich, C. Acikgöz, L. Isa, N. Spencer, A. Schlüter and M. Textor, ACS Nano, 2013, 7, 316–329 CrossRef CAS.
- L. G. Parratt, Phys. Rev., 1954, 95, 359–369 CrossRef.
- E. Amstad, A. U. Gehring, H. Fischer, V. V. Nagaiyanallur, G. Haehner, M. Textor and E. Reimhult, J. Phys. Chem. C, 2011, 115, 683–691 CAS.
- E. Amstad, T. Gillich, I. Bilecka, M. Textor and E. Reimhult, Nano Lett., 2009, 9, 4042–4048 CrossRef CAS.
- T. Gillich, E. M. Benetti, E. Rakhmatullina, R. Konradi, W. Li, A. Zhang, A. D. Schluter and M. Textor, J. Am. Chem. Soc., 2011, 133, 10940–10950 CrossRef CAS.
- A. Braslau, P. S. Pershan, G. Swislow, B. M. Ocko and J. Alsnielsen, Phys. Rev. A, 1988, 38, 2457–2470 CrossRef.
- Y. Lin, H. Skaff, T. Emrick, A. D. Dinsmore and T. P. Russell, Science, 2003, 299, 226–229 CrossRef CAS.
- K. Schwenke and E. Del Gado, 2012, in preparation.
- L. Isa, K. Kumar, M. Muller, J. Grolig, M. Textor and E. Reimhult, ACS Nano, 2010, 4, 5665–5670 CrossRef CAS.
- T. S. Horozov, R. Aveyard, J. H. Clint and B. P. Binks, Langmuir, 2003, 19, 2822–2829 CrossRef CAS.
- K. Masschaele, B. J. Park, E. M. Furst, J. Fransaer and J. Vermant, Phys. Rev. Lett., 2010, 105, 048303 CrossRef.
- L. J. Bonales, J. E. F. Rubio, H. Ritacco, C. Vega, R. G. Rubio and F. Ortega, Langmuir, 2011, 27, 3391–3400 CrossRef CAS.
- K. Geisel, L. Isa and W. Richtering, Langmuir, 2012, 28, 15770–15776 CrossRef CAS.
- D. L. Cheung and S. A. F. Bon, Phys. Rev. Lett., 2009, 102, 066103 CrossRef.
- R. Ranatunga, R. J. B. Kalescky, C. C. Chiu and S. O. Nielsen, J. Phys. Chem. C, 2010, 114, 12151–12157 Search PubMed.
- K. M. Reed, J. Borovicka, T. S. Horozov, V. N. Paunov, K. L. Thompson, A. Walsh and S. P. Armes, Langmuir, 2012, 28, 7291–7298 CrossRef CAS.
- D. M. Kaz, R. McGorty, M. Mani, M. P. Brenner and V. N. Manoharan, Nat. Mater., 2012, 11, 138–142 CrossRef CAS.
Footnotes |
| † Electronic supplementary information (ESI) available: Additional details and SAXS data. Additional information on the HE-XR liquid cell. See DOI: 10.1039/c3sm27367a |
| ‡ Present address: Physics Department, Fribourg University, Ch. du Musée 3, CH-1700 Fribourg, Switzerland. |
| This journal is © The Royal Society of Chemistry 2013 |