 Open Access Article
Creative Commons Attribution 3.0 Unported Licence
Oriented aggregation of calcium silicate hydrate platelets by the use of comb-like copolymers†
Luc
Nicoleau
*a,
Torben
Gädt
a,
Livia
Chitu
b,
Günther
Maier
b and
Oskar
Paris
c
aBASF Advanced Materials & Systems Research, BASF Construction Chemicals GmbH, 83308 Trostberg, Germany. E-mail: luc.nicoleau@basf.com; Fax: +49 862166502734; Tel: +49 8621862734
bMaterials Center Leoben Forschung, Leoben, Austria. E-mail: livia.chitu@mcl.at
cMontanuniversität, Institute of Physics, Leoben, Austria. E-mail: oskar.paris@unileoben.ac.at
First published on 4th April 2013
Abstract
We present an in-depth study of the formation of stable suspensions of low density aggregates of calcium silicate hydrate (C–S–H) particles stabilized by comb-like copolymers. These suspensions exhibit fundamentally interesting properties such as gel formation at 1.4 vol% of particles. Furthermore, they constitute a novel class of hardening accelerators for cementitious systems. Stabilization of C–S–H particles by polyelectrolytes is essential for the synthesis of stable and active C–S–H suspensions. Comb-polymers consisting of charged monomers (acrylic acid or 2-(phosphonooxy)-ethyl-methacrylate) and poly(ethylene glycol) monomers direct C–S–H particle aggregation into fractal structures. The fractal nature of the aggregates has been characterized by TEM and SAXS. Based upon (U)SAXS data of different C–S–H suspensions, it is demonstrated that two-dimensional initial C–S–H particle aggregation favours the creation of structures with a high specific surface area which are particularly active as cement hardening accelerators.
1 Introduction
Polyacrylic acid and acrylic acid copolymers are the industrially most important polyelectrolyte classes. They are used as dispersants for various substrates such as CaCO3 (ref. 1 and 2) and cementitious systems.3 Additionally acrylic acid copolymers have applications as anti-scaling4 agents and flocculants.5 In aqueous solution, polyelectrolytes such as polyacrylic acid copolymers can adsorb on small inorganic particles (e.g. CaCO3, TiO2). Depending on the molecular weight of the polyelectrolyte, the particles can either be flocculated or stabilized against agglomeration by adsorption. Furthermore, polyelectrolytes strongly influence the early stages of CaCO3 crystallization6 and stabilize amorphous calcium carbonate particles.7–9We have been interested in the use of polyelectrolytes consisting of a charge bearing monomer and a poly(ethylene glycol)-containing monomer for the stabilization of aqueous colloidal suspensions of calcium-silicate-hydrate10 (C–S–H in cement notation). These polymers are typically obtained by the co-polymerization of macromonomers containing a long poly(ethylene glycol) chain with at least another monomer containing one ionizable function.11,3 Classic examples are copolymers containing methacrylic acid and methoxy-poly(ethylene glycol)-methacrylate which are usually obtained by free radical co-polymerization from aqueous solution. Due to the significant importance of this class of comb polymers as dispersants for cementitious systems – they are also known as “superplasticizers” in the field of concrete technology – a multitude of different comb polymer technologies also comprising phosphate containing comb polymers12 have emerged over the last twenty years or so.
Calcium-silicate-hydrate is the main hydrate that develops when cement reacts with water. A long standing problem in the field of cement technology has been the understanding and control of the chemical reactions responsible for the setting of the cement–water mixture and for the strength development.13 In fields such as pre-cast concrete technology, it is desirable to have very fast strength development of the fabricated concrete pieces. Therefore, industry has been using essentially two approaches: (1) heat treatment of the concrete specimen to accelerate the chemical reactions involved (so-called “heat curing”) and (2) addition of chemical hardening accelerators to the concrete mix (e.g. soluble calcium salts such as calcium chloride or nitrate). With the synthesis of well-dispersed C–S–H suspensions a novel technology has become available which is superior compared to traditional methods. The addition of C–S–H suspensions to fresh concrete constitutes a revival of the seeding technology in cement with the purpose of hydration acceleration. Essentially, the C–S–H acts as crystallization nuclei and therefore enables a faster development of the mechanical properties of mortars and concretes.
Stable C–S–H suspensions can be obtained with stabilizing polymers and they accelerate the cement hydration already at low dosage in C–S–H.14 It was demonstrated that cement, and especially tricalcium silicate as the main component of cement, reacts faster if more C–S–H nuclei precipitate in the early stages after the mixing of cement with water.15 The accelerating effect due to the C–S–H suspensions is attributed to a seeding effect, widely known in other fields,16,17 which has recently been of increasing interest in the field of cement.18,19
C–S–H has a surface charge density up to 4.8 e− nm−2 in highly alkaline conditions.20 That leads to interesting phenomena which cannot be easily described by classical theories based on mean field approximations like the D.L.V.O theory. An example to illustrate this point is the fact that C–S–H particles show a strong attraction with a range beyond 2 nm,21 although they are highly negatively charged and should repel each other. This attraction between C–S–H particles is at the origin of the cohesion in cement.22 Another particularity of C–S–H particles is their size which does not exceed 60–80 nm in diameter and 10 nm in height.23
The present work studies the link between the organization of C–S–H platelets in aqueous suspensions and the efficiency as a cement hydration accelerator. It will be shown that C–S–H aggregate structures as measured by small-angle X-ray scattering (SAXS) can be described with a fractal model. The outcome of the fractal model is combined with adsorption measurements of polymer onto the C–S–H particles in order to propose mechanisms connecting the fractality of the C–S–H aggregates with their efficiency as seeding materials for cement. The efficiency as hydration accelerators has been estimated by isothermal calorimetry.
2 Experimental part
2.1 Synthesis of C–S–H suspensions
As stabilizers, three different comb-like polymers were used, two containing carboxylate functions (Polymers 1 and 2) and one with phosphate functions (Polymer 3). Polymers 1 and 2 are copolymers obtained by aqueous radical polymerization of acrylic acid and vinyloxybutyl-poly(ethylene glycol).24 Polymer 3 is obtained by copolymerizing 2-(phosphonooxy)-ethyl-methacrylate with methoxy-poly(ethylene glycol)-methacrylate.12 The characteristics of polymers are summarized in Table 1 and the structures are presented in Fig. 1. The molecular weight of the copolymers as well as of both poly(ethylene glycol) macromonomers have been determined using gel permeation chromatography on a Waters Alliance 2690 equipped with a Waters 2487 UV detector and a Waters 2410 RI detector. The copolymer samples were dissolved in a mixture of aqueous 0.05 M ammonium formate and methanol (80![[thin space (1/6-em)]](https://www.rsc.org/images/entities/char_2009.gif) :
:![[thin space (1/6-em)]](https://www.rsc.org/images/entities/char_2009.gif) 20 v/v). The columns used were Shodex OHpak SB 804HQ and 802.5HQ. The references used for calibration were poly(ethylene glycol) standards obtained from PSS Polymer Standards Service GmbH.
20 v/v). The columns used were Shodex OHpak SB 804HQ and 802.5HQ. The references used for calibration were poly(ethylene glycol) standards obtained from PSS Polymer Standards Service GmbH.
| Ionizable functions | Charge density [μeq. g−1] | Mean molar mass of PEG chains [g mol−1] | Molar mass [g mol−1] | |
|---|---|---|---|---|
| Polymer 1 | –COOH | 880 | 5800 | 38![[thin space (1/6-em)]](https://www.rsc.org/images/entities/char_2009.gif) 000 000 |
| Polymer 2 | –COOH | 790 | 5800 | 150![[thin space (1/6-em)]](https://www.rsc.org/images/entities/char_2009.gif) 000 000 |
| Polymer 3 | –P03H2 | 1650 | 5000 | 38![[thin space (1/6-em)]](https://www.rsc.org/images/entities/char_2009.gif) 000 000 |
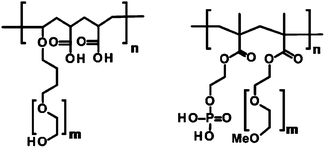 | ||
| Fig. 1 Structural motifs of the three polymers used in the syntheses. The first motifs correspond to Polymers 1 and 2 and the second motif to Polymer 3. | ||
The C–S–H suspensions were synthesized in a 500 mL double-walled glass reactor at T = 20 °C. A 51 wt% calcium nitrate solution and a 1.4 molar solution of sodium metasilicate are fed into a solution containing the polymer. The feeding lasts 100 minutes and the total [Ca2+] is equal to 900 mM and [Si] 540 mM. At the end of the synthesis, the solid content in C–S–H is 7.2% and the pH of the suspension is 11.2. In the present case, during the entire feeding time, the solution remains highly supersaturated with respect to C–S–H which implies suspension conditions very far from the solubility equilibrium which favors the precipitation of nanoparticles. The polymer is charged into the reactor at the beginning; the polymer content at the end of the synthesis is 81 g per liter of suspension. The solid content of C–S–H can be determined at any time of the synthesis. For doing so, 3 g of suspension is placed in an oven at 60 °C for 24 hours. The C–S–H content corresponds to the mass of the dried residue minus the polymer content, the mass of nitrate ions and the mass of sodium ions. All polymer-stabilized C–S–H suspensions as well as the samples taken during the synthesis are stable; neither settlement nor phase separation is observed for at least 6 months after their synthesis.
A suspension of C–S–H particles without any polymer has also been produced with the same amounts of reactants under the same experimental conditions. This suspension serves as the reference for the efficiency of C–S–H particles without a proper stabilization. This pure C–S–H suspension is not stable and settles rapidly. Within one day a dense deposit forms at the bottom of the recipient. The suspension can be redispersed by ultrasonication and stirring.
2.2 Measurement of the acceleration efficiency by isothermal calorimetry
As the hydration of cement's silicate phases can be monitored by calorimetry, this technique was chosen to estimate the accelerating efficiency of the seeding suspensions. 50 g of cement and 25 g of distilled water are mixed by mechanical stirring. Then, 3 g of paste is sealed in a plastic ampoule and inserted into the calorimeter (TAM-AIR, TA Instruments). The temperature is kept constant at 20 °C. All hydrations were carried out with water to cement ratios of 0.5. The concentration of C–S–H is 0.35% of dried C–S–H per weight of cement. C–S–H particles are added as suspensions and the quantity of water from the suspension is accounted for when adjusting the water to cement ratio. A linear heat flow evolution occurs during the first hours of hydration (Fig. 2); this period corresponds to the hydration step and is controlled by the growth of C–S–H. As the heat flow is proportional to the hydration rate of silicate phases,13 the derivative of heat flow with respect to time represents the hydration acceleration. The linearity means that the acceleration is constant, and given by the slope Acc.ref for the reference containing only cement and water, and by Acc.with CSH when C–S–H seeds are present in addition to cement and water. The relative acceleration A, due to the addition of C–S–H seeds, is calculated as follows: | (1) |
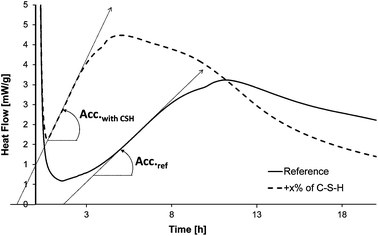 | ||
| Fig. 2 Typical heat flow curves obtained during the hydration of cement. | ||
2.3 Measurement of the adsorption of polymers onto C–S–H
The vast majority of methods for the quantitative measurement of polymer adsorption onto a substrate suspended in water require the separation of the solid particles from the liquid phase. When nanoparticles are involved, separation becomes challenging. Facing this problem, we decided to filtrate the suspensions under centrifugation. The centrifugal force is high enough to get a couple of mL completely free of particles within 10 minutes. This duration would have to be multiplied by a factor of 20 if a classical pressure filtration set-up were employed. The centrifuge tubes contain filtration membranes that are commercialized under the Vivaspin brand by Sartorius-Stedim with various pore sizes. We used 0.2 micron pore size tubes. The polyethersulfone membranes contain glycerine as a humectant. The glycerine is removed by filling the centrifuge with deionized water and subsequent centrifugation after which the water phase is discarded. This is repeated three times. Afterwards, the centrifuge tubes are stored under deionized water and are dried before use. The tubes are then filled with 8 g of the C–S–H suspension and subsequently subjected to centrifugation at 6000 g until at least 1 g of clear filtrate is obtained. 1 mL of the filtrate is then diluted with 9 mL deionized water and subjected to ICP-OES measurements. The ICP-OES instrument (Spectro Ciros Vision FSV 12) is calibrated using standard solutions of silicon. Although it is not common to measure the emission wavelengths related to carbon, it is possible in our case to determine the carbon concentration in filtrates with sufficient precision as also reported elsewhere.25 Due to the lack of carbon standards under these conditions, carbon was calibrated using polymer standard solutions. The polymer in the standard solutions is always identical to the polymer employed in the stabilization of the respective C–S–H suspensions. Determination of the Si content in the filtrates serves as a control for the complete retention of C–S–H particles on the filtration membrane. The filtrates were always clear and contained only a few micromoles of silicon, which is a very small quantity and supports the fact that no C–S–H particles pass through the filter.2.4 Small-angle scattering: experiments and fractal model
Small-angle (SAXS) and ultra-small-angle (USAXS) scattering experiments were carried out at the ID2 beamline at the European Synchrotron Radiation Facility (ESRF, Grenoble, France) using a highly monochromatic beam with low divergence and small cross-section. The SAXS/USAXS configuration covered several sample detector distances within a total q range of 0.001–0.6 nm−1 at a wavelength of λ = 0.1 nm (12.4 keV). The length of the scattering vector q is given by q = 4πsin(θ)/λ, θ being the scattering angle. The SAXS patterns were recorded with a pinhole camera by a CCD detector at 9 successive positions on the sample cell at exposure times of 10 ms up to 1 s. The 2D data were azimuthally averaged to obtain the intensity profiles. The cell and water backgrounds were subtracted from the original intensity profiles. The data were converted into absolute units (in units of water scattering).SAXS/USAXS patterns of the samples with different ratios of C–S–H prepared in the presence of the three polymer types at different concentrations were collected. Most of the scattering data from the investigated samples show similarities over the entire q range which extends over more than 3 orders of magnitude. In Fig. 3, the SAXS pattern recorded at the ESRF was combined with the SAXS pattern recorded with the laboratory source Nanostar (Bruker AXS). In so doing, a larger q range up to 2 nm−1 is covered. In such a pattern, three dominant regions can be distinguished for the samples stabilized by polymers:
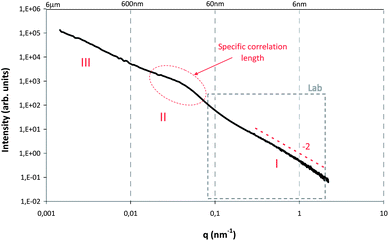 | ||
| Fig. 3 SAXS pattern of the commercial C–S–H suspension X-SEED®100‡ which shows the typical I(q) curve of C–S–H suspensions stabilized by polymers. | ||
• at large q (q > 0.1 nm−1, region I), a power law with a slope of approx. −2 indicates that the primary structures in the system can be described by planar objects (disk shaped nanoparticles). The same observation has been obtained elsewhere26 for Laponite particles with related morphologies. The formation of platelets or flakes seems to be a classical phenomenon for C–S–H particles.15,27,28
• In the low-q range (q < 0.01 nm−1, region III), the experimental data show a strong increase in intensity with decreasing q, indicating large structures. Special care was taken in the experiments to make sure that this signal is not due to air bubbles in the system. The experimental data for degassed and non-degassed samples did not show noticeable differences in the scattering pattern in the whole q-range range, which indicates that the observed behavior is the result of large aggregates/clusters formed in the solutions. The increase in intensity is accompanied by the development of an approximately linear region in the log–log plots (see Fig. 3), which follow a power-law with a non-integer exponent, indicating that the morphology of the scattering entities in the samples may be of a fractal nature. For all the samples the slope s ranges from −1 to −3, which suggests that the structure can be described by a mass fractal. Similar behavior is found in the literature29–32 for systems which exhibit order at low q.
• Between the two regions (region II), a clearly recognizable hump appears in the scattering data. This hump indicates a particular correlation length in the system which can be either associated with the diameter of the primary plates or with the distance between them.
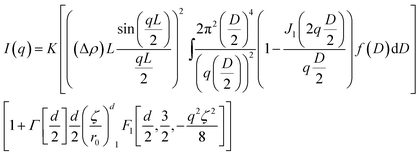
An analytical expression of the scattering from plate-like primary particles arranged in a mass fractal structure is given in eqn (2), allowing us to fit the I(q) curves. The derivation of this equation and the meaning of all parameters is reported in the electronic ESI.†
 | (2) |
There are 6 fitting parameters in this model: L the thickness of plates, D0 the mean diameter of plates, σ2 the variance of the plate diameter, d the fractal dimension, r0 the size of the fractal initiator and ζ the diameter of aggregates with a fractal character. Even though the number of fitting parameters is high, meaningful limits can be given for most of them, making the fit of the intensity over at least two orders of magnitude in q valid. Fitting procedures were carried out using the SASfit software.33
3 Results and discussion
3.1 Image analysis
Due to the attractive forces, C–S–H particles rapidly aggregate. Without any stabilizing polymer, large and coarse aggregates of C–S–H particles34 are formed during synthesis. These settle within minutes depending on the C–S–H volume fraction. The aggregation in combination with the settlement of the aggregates leads to suspensions with very low viscosity. Interestingly, in the presence of comb shaped polyelectrolytes with pendant poly(ethylene glycol) chains a homogeneous C–S–H gel formation is observed instead of sedimentation. This phenomenon is not unusual if the volume fraction in C–S–H is high and gels have been observed in cement or in tricalcium silicate paste.35,36 However, we have found that in the presence of comb polymers only a very low volume fraction in C–S–H (1.4%) is necessary to get a gel (Fig. S1†). The gel formation means: (1) self-organization of particles is important and (2) there are strong interactions between C–S–H particles despite the presence of stabilizing comb-polymers. As the accelerating effect of C–S–H seeding suspensions is lower when the particles are not stabilized by polymers, it can be assumed that the polymer-induced C–S–H gels develop a larger surface area than those without polymer stabilization, i.e. the density of the aggregates is crucial for having efficient seeding suspensions.The characterization of aggregates of anisotropic nanoparticles is not a straightforward task. Transmission electron microscopy (TEM) observations indicate that C–S–H platelets tend to form larger structures which may be described as fractal aggregates, illustrated in Fig. 4. The micrograph has been obtained by drying a diluted sample (1/10) of X-SEED®100 on a copper grid. Large aggregates >5 μm of C–S–H particles are visible.§ The TEM micrograph was transformed into a binary image to enhance the contrast and fine-structure of the aggregates. It is possible to obtain some information about the fractal character of a structure by image analysis.37 Weitz38 has successfully used this procedure to calculate the fractal dimension according to Hausdorff's definition on aggregated gold particles. An image analysis based on the so-called correlation analysis was performed in order to calculate the corresponding fractal dimension.¶ The result is shown in Fig. 5. By and large, the drying process should further increase particle aggregation. Nonetheless, typical fractal motifs can be distinguished similar to other materials such as gold,39 soil40 or fullerenes.41 This very simple fractal analysis reveals that the self-similarity is conserved over at least two orders of magnitude. This means that the aggregation of C–S–H platelets is of a fractal nature for these length scales.
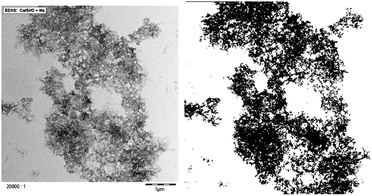 | ||
| Fig. 4 TEM image of X-SEED®100 without image processing on the left-hand side and after transformation into a binary image on the right-hand side. The resolution of the second image is 400 × 400 pixels. | ||
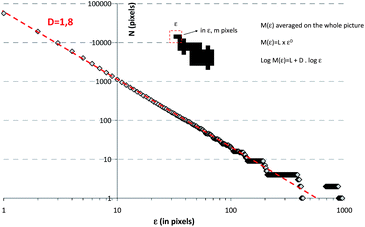 | ||
| Fig. 5 Fractal image analysis of the binary image in Fig. 4. From this image, a fractal dimension close to 1.8 can be estimated. The slope is constant over a broad size range, indicating that the self-similarity is conserved over two orders of magnitude. | ||
3.2 Acceleration efficiency
The first characteristic to be evaluated is the efficiency of the suspensions as seeding materials. This property is measured by heat flow calorimetry as set out in the experimental part. The calorimetry tests are always carried out with the same amount of C–S–H and therefore the accelerating efficiency is given per gram of C–S–H. The results showing the development of the accelerating efficiency of polymer-stabilized C–S–H particles are given in Fig. 6. The efficiency of the C–S–H suspension which is not stabilized by polymers is also shown for comparison. The unstabilized C–S–H suspension does not accelerate the hydration reaction at this low dosage. The three employed polymers show a different ability to stabilize C–S–H suspensions. We see that the final suspensions have significantly different accelerating capacity. For Polymer 2, the acceleration is close to 1.2 which is almost as poor as un-stabilized C–S–H.For Polymer 1, an acceleration of about 2 is reached and 2.8 is achieved with Polymer 3. The three polymers show similar behavior, in the sense that (1) the first C–S–H particles precipitated during the first 10 minutes of C–S–H synthesis are almost inefficient as seeding materials (acceleration close to or below 1), (2) the particles become more and more efficient until reaching a maximum located at roughly the half way point with respect to time in the synthesis and (3) after the maximum the acceleration efficiency of the particles remains almost constant or drops in the case of Polymer 2.
3.3 Characteristics of the aggregated C–S–H structures
First of all, we tried to analyze the unstabilized C–S–H suspension. But unfortunately it was not possible to produce an acceptable and reproducible SAXS pattern, even after ultrasonication of the suspension. This difficulty was attributed to fast settlement and to the high aggregation rate of particles or clusters of particles. For the three syntheses in the presence of polymers, samples were taken after 10, 20, 40, 60 and at the end of feeding i.e. after 100 minutes. These samples were analyzed by SAXS and the curves obtained fitted with the fractal model as set forth in the experimental part (eqn (2)). The SAXS patterns and the corresponding fitted data are presented in Fig. 7–9. No fits are shown for Polymer 2 since it was not possible to use the mass fractal model and to obtain acceptable fits. For this polymer, only the part at high q, corresponding to the form factor, was fitted in order to extract the characteristics of the single C–S–H particles. The fitting parameters and the concentration of C–S–H in the suspensions are reported in Table 2.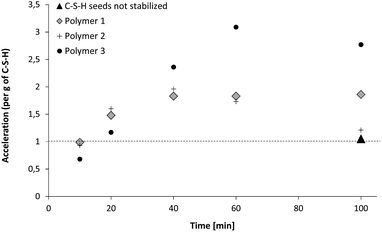 | ||
| Fig. 6 Evolution of the relative acceleration of C–S–H particles. The time refers to the duration of calcium and silicate salt dosage during C–S–H synthesis, i.e. 20 minutes means that the C–S–H synthesis was stopped after 20 minutes which means that the resulting C–S–H suspension has a C–S–H content of 20% with regard to the 100 minutes sample. | ||
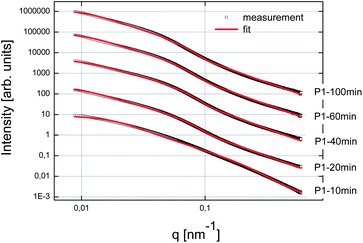 | ||
| Fig. 7 SAXS patterns of the C–S–H suspensions synthesized with Polymer 1. The curves were shifted arbitrarily on the y-axis to make the curves visible. | ||
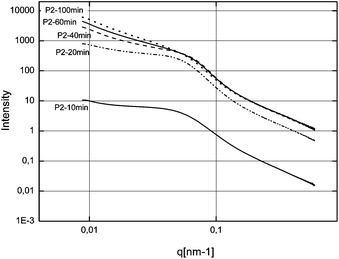 | ||
| Fig. 8 SAXS patterns of the C–S–H suspensions synthesized with Polymer 2. | ||
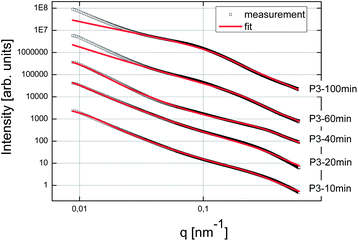 | ||
| Fig. 9 SAXS patterns of the C–S–H suspensions synthesized with Polymer 3. The curves were shifted arbitrarily on the y-axis to better distinguish them. | ||
| Sampling time [min] | Polymer type | CSH content [%] | Form factor – thickness L [nm] | Form factor – length D0 [nm] | Form factor – σD0 | Structure factor – size of the fractal initiator r0 [nm] | Structure factor – size of the fractal aggregate ζ [nm] | Structural factor – d fractal dimension |
|---|---|---|---|---|---|---|---|---|
| 10 | Polymer 1 | 0.72 | 1.3 | 17 | 7.71 | 6 | 130 | 1.7 |
| 20 | Polymer 1 | 1.45 | 1.3 | 56 | 26 | 16 | 210 | 1.4 |
| 40 | Polymer 1 | 2.90 | 1.3 | 56 | 26 | 16 | 210 | 1.45 |
| 60 | Polymer 1 | 4.34 | 1.3 | 59 | 24 | 17.5 | 250 | 1.54 |
| 100 | Polymer 1 | 7.24 | 1.3 | 60 | 29 | 18 | 400 | 1.59 |
| 10 | Polymer 2 | 1.13 | 1.4 | 35 | 14 | |||
| 20 | Polymer 2 | 2.38 | 1.4 | 32 | 23 | No fractal or not enough fractal aggregation | ||
| 40 | Polymer 2 | 4.50 | 1.4 | 40 | 28 | to fit the curves | ||
| 60 | Polymer 2 | 5.39 | 1.4 | 42 | 28 | |||
| 100 | Polymer 2 | 6.66 | 1.4 | 46.2 | 24.7 | |||
| 10 | Polymer 3 | 0.70 | 1.4 | 12 | 4.8 | 8 | 240 | 2.1 |
| 20 | Polymer 3 | 1.40 | 1.4 | 12.5 | 3.32 | 8.2 | 300 | 2.1 |
| 40 | Polymer 3 | 2.80 | 1.4 | 16.5 | 4.5 | 8.7 | 340 | 2.2 |
| 60 | Polymer 3 | 4.19 | 1.4 | 19.9 | 3.75 | 9 | 600 | 1.7 |
| 100 | Polymer 3 | 6.99 | 1.4 | 28 | 4.42 | 10 | 700 | 1.4 |
Fractal aggregates, which could be fitted with eqn (2), are never observed with Polymer 2. For all polymers, the thickness of plates is close to 1.4 nm which represents exactly the size of a single crystal cell of 14 Å tobermorite in the direction perpendicular to the silicate chains. 14 Å tobermorite is the natural crystal representative of the C–S–H structure for the calcium to silicon ratio42 used in this study. It is important to point out that the diameter of plates evolves in the same way as the size of the fractal initiator, although they are two independent parameters in the fit. Although the fractal initiator is by definition spherical in the employed model, it scales with the real diameter of C–S–H platelets and we can conclude that one C–S–H platelet is basically the primary building block of the fractal. As previously mentioned, both sizes are not equal since C–S–H is a thin platelet and the fractal initiator of the model is spherical in the mass fractal structure factor.
As many phenomena in nucleation and growth processes are linked to surface properties, it should be expected that accelerating performances of seed suspensions should be driven by a surface feature. Intuitively one would think that the surface area developed by the primary particles might be a cornerstone characteristic. As shown in Fig. 10, the surface area developed by a mass of very thin particles (as compared to their length) is quasi-independent of the diameter of the particles. Indeed, the diameters and thicknesses obtained after the fits of SAXS patterns at high q enable the calculation of the total surface area developed by the particles knowing the solid content. Nonetheless, for the three polymers, the size of platelets and their development over the synthesis time are significantly different, indicating a different capability to control the growth of the particles.
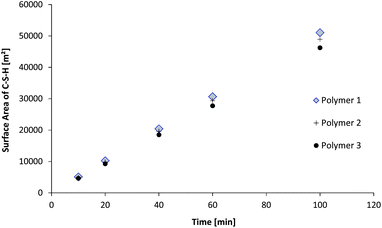 | ||
| Fig. 10 Evolution of the total surface area of C–S–H particles during the synthesis. The surface area is calculated for one liter of suspension. | ||
The first polymer investigated is Polymer 1. Fig. 11 exhibits the evolution of the fractal dimension, the size of fractal aggregates, the diameter of C–S–H plates and the radius of the fractal initiator, and finally the packing density of the aggregates. In order to take into account the size of the primary particle in the calculus, this packing density is estimated according to the following equation:43,44
 | (3) |
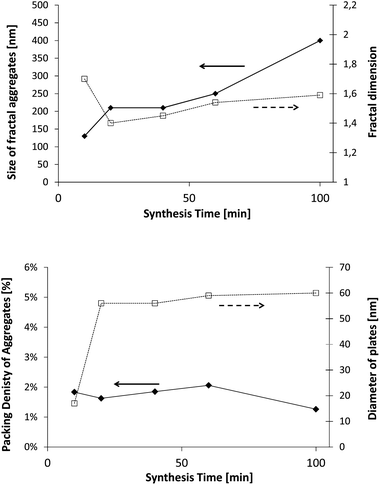 | ||
| Fig. 11 Evolutions of the different fitting parameters derived from the fractal model given in eqn (2) and the fit of the SAXS curves corresponding to the C–S–H suspensions synthesized with Polymer 1. | ||
Despite the fact that this equation is widely used in the field of dispersions, it is not strictly valid here since the radius of the fractal initiator is set to be spherical as opposed to the real size and morphology of platelets. Nonetheless, for the sake of simplicity, we decided to use this equation in order to estimate the packing density.
After 10 minutes of synthesis, the fractal dimension is close to 1.8 and the fractal aggregates have a diameter of about 120 nm. The fractal dimension decreases afterwards and then increases slowly to 1.6 at the end of the synthesis. The diameter of aggregates is continuously increasing up to 400 nm. We also observe that the diameter of single C–S–H particles increases between 10 and 20 minutes. After that, no remarkable change is noticed. With this information, we may imagine a possible evolution of the C–S–H structure stabilized by Polymer 1. At t0 + 10 min, small 120 nm fractal aggregates are made up of C–S–H particles with a diameter of 17 nm arranged along a rather random path (Df = 1.8). The platelets grow until the 20th minute when they reach a diameter of 56 nm. After 20 minutes, the aggregates grow by a further aggregation mechanism which increases the fractal dimension. No significant change is seen in the packing density which stays at ∼2%.
This means that the aggregation occurs in three dimensions. We can assume that the aggregates formed at ∼20 minutes tend to then aggregate themselves after 40 min. A schematic description of this process is depicted in Fig. 12. Considering a density of 2.16 g cm−3 for C–S–H,13 the volume fraction of C–S–H in the suspension at the end of the synthesis has to be close to 3.3%. The packing density of the aggregates (∼1.3%) is therefore smaller than the total volume fraction of C–S–H. This is possible only if, besides the fractal aggregates, more dense objects have also precipitated. It is also worth pointing out that a wrong value of r0 may induce a deviation between the real and calculated packing densities. Assuming that there is always a part of C–S–H which cannot be stabilized by polymers, we presume that these objects are dense C–S–H aggregates. These dense aggregates are not taken into account in our fractal model and it does not seem to hamper the fitting of I(q) curves. Based on the known volume fraction of C–S–H in the suspension VCSH and the packing density of the fractal aggregates, it is possible to make a rough estimate of the amount of dense aggregates, using the following equation:
| VCSH = (100% − x%)PF + x%PD | (4) |
 | (5) |
 | (6) |
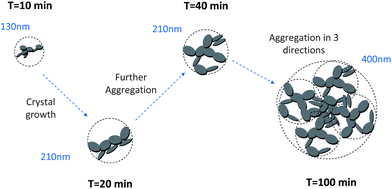 | ||
| Fig. 12 Sketch of the structure development during the precipitation of C–S–H stabilized by Polymer 1. The dashed circles represent the size of fractal aggregates. The polymer adsorbed onto the C–S–H particles is not shown. | ||
The packing density of the dense aggregates is a priori unknown but we may reasonably assume that it should not greatly differ from that of the C–S–H observed in cement paste for which the packing densities have been estimated.45 We choose the value of PD = 66% corresponding to the so-called low-density C–S–H, actually the lowest packing density so as not to underestimate the fraction of dense aggregates. At the end of the synthesis, according to eqn (6), it implies that about 3.3% of the total amount of C–S–H is dense aggregates. This quantity is small and we know that dense/non-stabilized C–S–H aggregates do not accelerate the hydration of cement. A small amount of these dense aggregates should not influence the overall performances of the polymer stabilized C–S–H suspensions (see also Fig. 6). Indeed, during the second half or at the end of the synthesis, we do not see a drop in performances. This would have been the case if a significant quantity of densely packed C–S–H were precipitated, which confirms the validity of the assumption that the overall amount of dense aggregates is small.
The properties of C–S–H in the presence of Polymer 3 are quite different. Indeed, the first aggregates (∼10 min) are over 200 nm in size consisting of thin primary particles with a diameter close to 12 nm which are arranged in a plane-like fashion with a fractal dimension of 2.1. There are only slight changes during the first 40 minutes of synthesis, the fractal dimension remains quasi constant, the aggregates swell only little and the platelet diameter increases quasi proportionally with time. After 40 minutes of feeding and until the end of the synthesis, the fractal dimension decreases strongly, and meanwhile, the size of aggregates increases which leads to a large decrease in the packing density (from 4.7% to 0.1%, Fig. 13) since only a small growth of the primary platelets is seen.
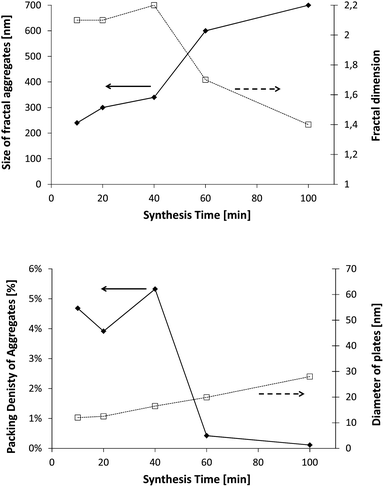 | ||
| Fig. 13 Evolution of the different fitting parameters derived from the fractal model and the fit of the SAXS curves corresponding to the C–S–H suspensions synthesized with Polymer 3. | ||
These data can be interpreted as a step by step evolution of the fractal C–S–H structure in suspensions stabilized by Polymer 3. A schematic representation is given in Fig. 14. The first aggregates are slightly larger than those of C–S–H stabilized with Polymer 1 and the small particles are arranged in a plane-like fashion. Until 40 minutes, there are only small variations of the parameters in spite of the precipitation of 4 times more C–S–H than at 10 minutes. We therefore propose that identical objects are precipitating. This phenomenon is accompanied by a modest crystal growth. A transition is observed after 40 minutes. The fractal aggregates become bigger with a remarkable decrease of the fractal dimension. Here, we propose that the new precipitated material connects the aggregates already present and thereby structures with long-range order are formed which are predominantly directed along one dimension. This phenomenon may be imagined as the formation of branches within a network. It has also been reported in the literature that already aggregated silica particles can lead to more “open” structures if they further aggregate.46 At the end of the synthesis, the packing density of the fractal aggregates (0.1%) is also smaller than the volume fraction of C–S–H in the aqueous suspension. According to eqn (6), there would be about 5% of dense C–S–H aggregates with respect to the overall C–S–H amount.
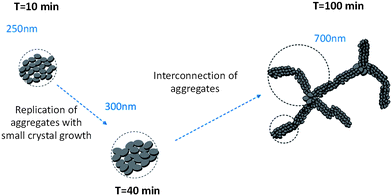 | ||
| Fig. 14 Sketch of structure development during the precipitation of C–S–H stabilized by Polymer 3. The dashed circles represent the size of fractal aggregates. The polymer adsorbed onto the C–S–H particles is not represented. | ||
The results obtained with Polymer 2 are also remarkable because this polymer does not show any fractal aggregation but interestingly it is able to stabilize the C–S–H suspension for 40 minutes as Fig. 6 indicates. Two possibilities can be discussed in order to explain the absence of a fractal structure: either the C–S–H particles collapse into high-density aggregates or C–S–H precipitates as perfectly dispersed particles with a highly random orientation and separation between particles. A couple of points indicate that the first possibility is unlikely.
Half way through the synthesis (i.e. 50 min), we see that the performance of the suspension is acceptable i.e. at the same level as that of Polymer 1, which means that particles are at least partially stabilized since C–S–H without any stabilizer does not exhibit any accelerating ability. This conclusion is supported by the fact that we do not observe any settling of the suspension and that the size of platelets is not significantly larger than that of other stabilizing polymers (Fig. 15), at least at the beginning of the synthesis. Secondly, the SAXS patterns (Fig. 8) for the intermediary C–S–H suspensions (20, 40, 60 minutes) show that the particles scatter also at a lower q than the q characteristic of primary particles, which indicates that there is some correlation between the particles but not with a fractal organization. For this reason, it is concluded that the first particles are rather well dispersed rather than more densely aggregated. It is worthwhile to evaluate this argument at the end of the synthesis. Indeed, after 100 minutes of feeding, the suspension shows a very low accelerating performance. With the same logic we can argue that the particles are rather aggregated with a dense packing. Moreover, the 100 min SAXS pattern shows that the slope of the curve I(q) at low q is quite low (Fig. 8). The set of data indicates that the system goes from a well-dispersed suspension to a densely aggregated system. A similar behavior has already been reported in the literature for aqueous dispersions of silane-functionalized Laponite clay platelets.26
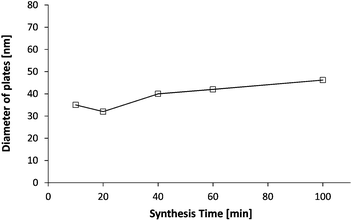 | ||
| Fig. 15 Evolution of the diameter of plates obtained from the SAXS patterns of the C–S–H suspensions synthesized with Polymer 2. In this case, no fractal size has been observed/no fractal aggregation can be assumed. | ||
3.4 Polymer adsorption
An important characteristic measured for all the samples is the adsorption of polymer onto the C–S–H particles. As Fig. 16 reveals, the three polymers have a high affinity for the C–S–H surface since they are strongly adsorbed from the beginning of the synthesis (we recall that the total amount of polymer is in the reactor from the start of the synthesis). The mass of polymer adsorbed per unit surface area of C–S–H, as well as the percentage of polymer adsorbed, is given. The first observation is that the three polymer adsorptions do not differ significantly. At least one half of the polymer is adsorbed in the first ten minutes and this amount increases until reaching 100% adsorption after 40–50 minutes, i.e. after the first half of the synthesis when half of the final amount of C–S–H has precipitated.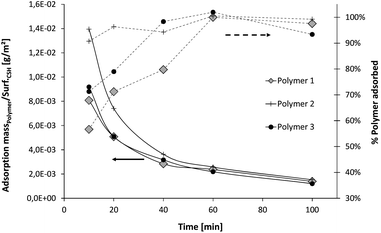 | ||
| Fig. 16 Evolution of the percentage of polymer adsorbed and the adsorption per unit surface area of C–S–H during the syntheses. The adsorption per m2 is calculated and averaged with the size of primary plates determined by SAXS. | ||
On average, it means that the first precipitated C–S–H particles are more covered by polymer than the particles that are precipitated at the end of the synthesis. Here, it is not reasonable to assume, at least for Polymers 1 and 3, that there are two distinct populations of C–S–H particles, one bearing a lot of polymer and another one almost free of polymer. Indeed, 50% of un-stabilized C–S–H particles would have huge consequences on the accelerating efficiency of the overall C–S–H suspension which is not the case (Fig. 6). Moreover, we do not see any particular instability of the suspensions after 50 minutes, meaning that the particles remain colloidally stable, in contrast to the synthetic un-stabilized C–S–H suspension which settles within minutes. Then, it leads to the conclusion that most of the polymer is distributed over all the particles.
3.5 Model
The set of experimental observations described in the previous section enables us to propose a model linking the aggregation of C–S–H driven by polymers and the seeding effect. This model is based on two main observations:(a) C–S–H particles precipitated during the first few minutes are inefficient as seeding material, whereas the polymer adsorption per unit of surface area of particles is the highest. This leads to the conclusion that polymer stabilized C–S–H surfaces are not active anymore for the seeding process in cement. An active C–S–H surface is probably a surface devoid of polymer.
(b) The higher the dimensionality of the aggregation of C–S–H particles at the beginning of the synthesis, the higher the efficiency of the C–S–H suspensions at the end. The pure C–S–H suspension not stabilized by polymers has to be naturally excluded from this observation.
The polymer driven aggregation of C–S–H particles either along a line, or in a plane or as a single particle determines the connection among particles and the degree of freedom of each particle. A single particle has the maximum degree of freedom, i.e. it can move in any direction. If fewer polymer molecules are adsorbed or if the interactions between the C–S–H platelets and polymer molecules become specific to any type of adsorption site, aggregated structures are realized (i.e. 1D or 2D aggregations). The more interconnected a particle is, the fewer degrees of freedom it has.
We concluded above that, in order to obtain active seeding surfaces, the polymer covering the first C–S–H structures precipitated at the beginning of the syntheses and making the C–S–H particles inert for the seeding has to desorb. The driving force for desorption is the precipitation of new C–S–H particles. Therefore, during desorption the structures will be less and less stabilized. This phenomenon will tend to provoke the collapse of the structures since the polymer cannot function as a stabilizer anymore and particles are likely to attract each other. Then, the stability of the structure, lacking polymer, is highly dependent on the interconnection among particles. The more deformable the initial structure, the more the structure is prone to collapse. The collapse of structures leads to the decrease in the acceleration efficiencies visible in Fig. 6 after ∼60 minutes. Fig. 17 presents the different scenarios which could happen after the stabilization of (b) perfectly dispersed particles, (a) linear chains of particles and (c) planes of particles. These cases (a, b and c) correspond to the stabilization by Polymers 1, 2 and 3 respectively. The more interconnected a particle is in the beginning, i.e. the more its degree of freedom is reduced, the more robust the structure will be during the desorption of polymer. With this schematic model we give an explanation of why the 2D dimensional aggregation (planes) performs better than the 1D aggregation (chains) and even better than the well-dispersed particles. In other words, the 2D aggregation is a good way to produce a high surface area of C–S–H with little coverage of polymer on the C–S–H surface.
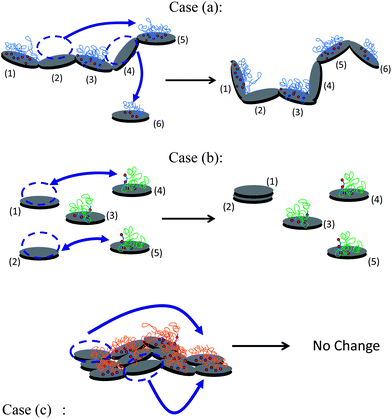 | ||
| Fig. 17 Sketch of the structural changes during polymer desorption according to three possible initial structures corresponding to syntheses with Polymers 1, 2 and 3 respectively. In case (a), a polymer adsorbed on particles (2) and (3) has desorbed and re-adsorbed on newly formed particles (5) and (6). Particle (6) has been attached to the chain which has partially collapsed due to lack of polymer. In case (b), a polymer adsorbed on particles (2) and (3) has desorbed and re-adsorbed on newly formed particles (4) and (5). Particles (1) and (2), being no longer stabilized, aggregate. In case (c), in spite of the desorption of polymer which re-adsorbs on two new particles, the flat structure remains unchanged, i.e. does not shrink, since the two particles lacking polymer are locked-in. | ||
4 Conclusions
The use of polyelectrolytes is a prerequisite in numerous systems in which the stabilization and/or the dispersion of small particles are desired. This is also true for C–S–H and the achievement of stable colloidal suspensions of C–S–H is only possible by the addition of polymers. Polymer stabilization leads to C–S–H fractal structures as it has been observed in other systems. It is clear that the type of structure formed determines the “open” spaces between the particles and therefore the surface properties of C–S–H suspensions. One of these properties is the seeding activity, desired for the acceleration of cement hydration. We demonstrated that the more loosely packed the C–S–H aggregates, the more efficient the C–S–H is as a seeding material. Interestingly, the aggregation need not necessarily be a disadvantage in this respect since it was demonstrated that 2D-aggregation is a good way to create a large, stable and polymer-free C–S–H surface. In this respect, in spite of an apparent contradiction, it has been demonstrated that a controlled aggregation can be used for synthesizing materials with high active surface areas, which could also be used advantageously in applications such as catalysts.Acknowledgements
We are thankful to Harald Grassl for his support with the adsorption testing.Notes and references
- C. Geffroy, J. Persello, A. Foissy, P. Lixon, F. Tournillac and B. Cabane, Colloids Surf., A, 2000, 162, 107 CrossRef CAS.
- J. Loiseau, N. Doërr, J. M. Suau, J. B. Egraz, M. F. Llauro, C. Lavadière and J. Claverie, Macromolecules, 2003, 36, 3066 CrossRef CAS.
- F. Winnefeld, S. Becker, J. Pakusch and T. Götz, Cem. Concr. Compos., 2007, 29, 251 CrossRef CAS.
- J. Rieger, T. Frechen, G. Cox, W. Heckmann, C. Schmidt and J. Thieme, Faraday Discuss., 2007, 136, 265 RSC.
- Y. D. Yan, S. M. Glover, G. J. Jameson and S. Biggs, Int. J. Miner. Process., 2004, 73, 161 CrossRef CAS.
- D. Gebauer, H. Cölfen, A. Verch and M. Antonietti, Adv. Mater., 2009, 21, 435 CrossRef CAS.
- S. C. Huang, K. Naka and Y. Chujo, Langmuir, 2007, 23, 12086 CrossRef CAS.
- A. S. Schenk, I. Zlotnikov, B. Pokroy, N. Gierlinger, A. Masic, P. Lasansky, A. Fitch, O. Paris, T. H. Metzger, H. Cölfen, P. Frazl and B. Aichmayer, Adv. Funct. Mater., 2012, 22, 4668 CrossRef CAS.
- A. N. Kulak, P. Iddon, Y. Li, S. Armes, H. Cölfen, O. Paris, R. M. Wilson and F. C. Meldrum, J. Am. Chem. Soc., 2007, 129, 3729 CrossRef CAS.
- L. Nicoleau, G. Albrecht, et al., Plasticizer-containing hardening accelerator composition, Patent EP08163468.5, 2009.
- K. Yamada, T. Takahashi, S. Hanehara and M. Matsuhisa, Cem. Concr. Res., 2000, 30, 197 CrossRef CAS.
- A. Kraus, H. Grassl, A. Hartl and M. Brandl, Phosphor-haltige Copolymere, Verfahren zu ihrer Herstellung und deren Verwendung, Patent WO2006/089/59, 2006.
- H. F. W. Taylor, Cement chemistry, Thomas Telford Edition, 2nd edn, 1997 Search PubMed.
- J. F. Thomas, H. M. Jennings and J. J. Chen, J. Phys. Chem. C, 2009, 113, 4327 CAS.
- S. Garrault and A. Nonat, Langmuir, 2001, 17, 8131 CrossRef CAS.
- R. T. Bruintjes, Bull. Am. Meteorol. Soc., 1999, 80, 805 CrossRef.
- J. B. Rawlings, S. M. Miller and W. R. Witkowski, Ind. Eng. Chem. Res., 1993, 32, 1275 CrossRef CAS.
- R. Alizadeh, L. Raki, J. M. Makar, J. J. Beaudoin and I. Moudrkovski, J. Mater. Chem., 2009, 19, 7937 RSC.
- M. H. Hubler, J. J. Thomas and H. M. Jennings, Cem. Concr. Res., 2011, 41, 842 CrossRef CAS.
- C. Labbez, B. Jönsson, I. Pochard, A. Nonat and B. Cabane, J. Phys. Chem. B, 2006, 110, 9219 CrossRef CAS.
- C. Plassard, E. Lesniewska, I. Pochard and A. Nonat, Langmuir, 2005, 21, 7263 CrossRef CAS.
- B. Jönsson, H. Wennerström, A. Nonat and B. Cabane, Langmuir, 2004, 20, 6702 CrossRef.
- S. Gauffinet, E. Finot, E. Lesniewska and A. Nonat, Compte-Rendu de l'Académie des Sciences Série IIA, 1998, vol. 327, p. 231 Search PubMed.
- G. Albrecht, C. Hübsch, H. Leitner, H. Grassl and A. Kern, Copolymers based on unsaturated mono- or dicarboxylic acid derivatives and oxyalkylene glycol alkenyl ethers, method for the product and use thereof, Patent EP1189955, 2000.
- S. T. Gouveia, F. V. Silva, L. M. Costa, A. R. A. Nogueira and J. A. Nóbrega, Anal. Chim. Acta, 2001, 445, 269 CrossRef CAS.
- N. N. Herrera, J.-M. Letoffe, J.-L. Puteaux, L. David and E. Bourgeat-Lami, Langmuir, 2004, 20, 1564 CrossRef CAS.
- I. G. Richardson, Cem. Concr. Res., 2004, 34, 1733 CrossRef CAS.
- P. E. Stutzman, Materials Science of Concrete Special Volume: Calcium Hydroxide in Concrete, The American Ceramic Society, 2001, p. 59 Search PubMed.
- M. Morvan, D. Espinat, J. Lambard and T. Zemb, Colloids Surf., A, 1994, 82, 193 CrossRef CAS.
- T. Pernyeszi and I. Dékány, Colloid Polym. Sci., 2003, 281, 73 CAS.
- R. Wengeler, F. Wolf, N. Dingenouts and H. Nirschl, Langmuir, 2007, 23, 4158 CrossRef.
- T. P. Rieker, S. Misono and F. Ehrburger-Dolle, Langmuir, 1999, 15, 914 CrossRef CAS.
- J. Kohlbrecher, Software package SASfit for fitting small-angle scattering curves, Paul Scherrer Institut, Villigen, Switzerland, 2010 Search PubMed.
- L. Nachbaur, P.-C. Nkinamubanzi, A. Nonat and J.-C. Mutin, J. Colloid Interface Sci., 1998, 202, 261 CrossRef CAS.
- K. Rastoul, H. Van Damme, F. Lafuma, F. Lequeux, P. Collombet, S. Mansoutre and M. Pasquier, Polym. Int., 2003, 52, 633 CrossRef CAS.
- M. Bellotto, Proceedings of 10th International Conference on Superplasticizers and Other Chemical Admixtures in Concrete, Prague, 2012, p. 193 Search PubMed.
- S. Tang, C. M. McFarlane, G. C. Paul and C. R. Thomas, Colloid Polym. Sci., 1999, 277, 325 CAS.
- D. A. Weitz and M. Oliveira, Phys. Rev. Lett., 1984, 52, 1433 CrossRef CAS.
- R. F. Voss, R. B. Laibowitz and E. I. Allessandrini, Phys. Rev. Lett., 1982, 49, 1441 CrossRef CAS.
- F. Bartoli, R. Philippy, M. Doirisse, S. Niquet and M. Dubuit, J. Soil Sci., 1991, 42, 167 CrossRef.
- G. V. Andrievsky, V. K. Klochkov, E. L. Karykina and N. O. Mchedlov-Petrossyan, Chem. Phys. Lett., 1999, 300, 392 CrossRef CAS.
- I. G. Richardson, The calcium silicate hydrates, Cem. Concr. Res., 2008, 38, 137 CrossRef CAS.
- J. Zhang and J. Buffle, Colloids Surf., A, 1996, 107, 175 CrossRef CAS.
- E. Dickinson, J. Colloid Interface Sci., 2000, 225, 2 CrossRef CAS.
- F.-J.- Ulm and H. M. Jennings, Cem. Concr. Res., 2008, 38, 1126 CrossRef CAS.
- A. C. Johnsson, M. C. Camerani and Z. Abbas, J. Phys. Chem. B, 2011, 115, 765 CrossRef CAS.
Footnotes |
| † Electronic supplementary information (ESI) available. See DOI: 10.1039/c3sm00022b |
| ‡ X-SEED®100 is a suspension of calcium silicate hydrates stabilized by comb-polymers and commercialized by BASF, the concentration of C–S–H is 7.2%. |
| § To make sure that sample preparation and imaging are not corrupted by drying artifacts, cryo-sampling and microscopy were also performed on different samples. Similar aggregated structures were always observed. |
| ¶ The procedure for this analysis is to count the number of black pixels M(ε) in a ε × ε pixel2 box centered around any black pixel over the entire ε length range. Then, the fractal dimension is defined as M(ε) = L × εd and can be obtained by linear logarithmic regression after plotting the curve log M(ε) = L + dlog ε. M(ε) is averaged over the whole picture. |
| This journal is © The Royal Society of Chemistry 2013 |
