Research-based design and development of a simulation of liquid–vapor equilibrium
Sevil
Akaygun
*a and
Loretta L.
Jones
b
aBogazici University, Istanbul, Turkey. E-mail: sevil.akaygun@boun.edu.tr
bUniversity of Northern Colorado, Greeley, CO, USA
First published on 29th May 2013
Abstract
Helping learners to visualize the structures and dynamics of particles through the use of technology is challenging. Animations and simulations can be difficult for learners to interpret and can even lead to new misconceptions. A systematic approach to development based on the findings of cognitive science was used to design, develop, and evaluate a simulation of physical equilibrium that addresses learner needs and misconceptions. Findings from a research study involving 45 chemistry instructors and 94 students were used to design and develop a dynamic computer simulation of liquid–vapor equilibrium that can be viewed at both macroscopic and submicroscopic levels. In the first stage of the process, mental models of the instructors and students were elicited by an open-ended questionnaire. Next, a selected group of participants were interviewed while viewing two dynamic animations of physical equilibrium. Based on these research findings, a dynamic simulation of liquid–vapor equilibrium was designed and developed. The simulation underwent several evaluation and revision steps that involved both experts and students. The final version of the simulation was implemented with a new group of 191 students. It was found to be effective in improving students' understanding of dynamic equilibrium and was well received by them.
Introduction
It is challenging for many students to visualize the behavior of atoms and molecules, because they cannot be seen. It is also difficult for them to relate molecular behavior to observable phenomena (Nakhleh, 1992). To understand chemistry conceptually, phenomena must be related at observable, symbolic and particulate levels (Johnstone, 1993, Taber, 2013). In this triplet, symbolic level, which is the level of symbols, equations and formulas, forms a bridge between observable and particulate concepts because symbols are used to explain the observable phenomena and represent individual particles (Taber, 2013). Instructors have used various strategies including physical models, analogies, and computer visualizations to help students visualize the particulate level (Williamson, 2008). Well designed particulate level visualizations are a promising means to help students relate the three levels of chemical and physical phenomena while minimizing the introduction of new misconceptions. However, many animations and simulations of these phenomena are constructed according to generic design principles such as those of Mayer (2009), without a systematic process for discovering learner preconceptions and without a clear understanding of how learners interpret images (Sumfleth et al., 1996). The purpose of this study was to design and develop an effective particulate-level simulation of dynamic liquid–vapor equilibrium through a research-based process. The significance of this study is the process leading to the design of the simulation because it was conducted by adapting the design strategy outlined by Tversky et al. (2006), which involves eliciting the mental models of experts and novices before developing and testing the visualization.Theoretical background
Computer animations and simulations of the particulate level
A number of computer visualizations, in particular, animations and simulations, have been developed for teaching and learning chemistry (Akaygun and Jones, 2013a). Computer animations are defined as a series of visual images shown rapidly one after the other on a computer screen creating the sense of motion (Burke et al., 1998). According to Oakes and Rengarajan (2002), an animation presents graphics and sound in a multimedia environment, but is not interactive, whereas simulations are interactive representations that present learners with an environment that enables them to experience and understand the environment through their interactions and explorations within it. Visualizations involving the structure and dynamics of particles have been considered especially important in the learning of chemistry because physicochemical phenomena can fully be explained only by the collective behavior of particles, which can never be observed by the naked eye and thus are hard to visualize (Jones et al., 2005).Akaygun and Jones (2013a) reviewed research on dynamic computer visualizations (animations and simulations) used in the teaching and learning chemistry. It has been found that animations of the structure and dynamics of atoms and molecules can help students better visualize the particulate nature of matter (Reiber, 1991), improve conceptual understanding (Williamson and Abraham, 1995; Sanger et al., 2000; Ebenezer, 2001; Ardac and Akaygun, 2004; Tasker and Dalton, 2006), and help them overcome their misconceptions (Sanger and Greenbowe, 1997; Burke et al., 1998).
Computer animations are also used in combination with observable phenomena such as demonstrations and laboratory work to highlight connections between the macroscopic and particulate levels. When particulate-level animations were combined with observable phenomena on topics such as gas behavior (Sanger et al., 2000; Abraham et al., 2001; Velázquez-Marcano et al., 2004), and organic extractions (Supasorn et al., 2008), students were better able to understand the concepts and processes.
Interactive computer simulations have also been used to teach chemistry topics, including the use of laboratory instruments (Jones, 1988), chemical kinetics (Steffen and Holt, 1993), atomic structure and periodic properties (Martin, 2002), chemical reactions (Xie and Tinker, 2006), solubility equilibrium (Gil and Paiva, 2006), acids and bases (Winberg and Berg, 2007), gas laws (Abdullah and Shariff, 2008), and general chemistry concepts and laboratory procedures (Jones and Tasker, 2002). Research studies of the effects of simulations on chemistry learning have shown that simulations may have positive effects, such as promoting discovery learning (Jong and Joolingen, 1998), understanding interactions at the particulate level (Stieff and Wilensky, 2003), conceptual understanding (Gil and Paiva, 2006; Abdullah and Shariff, 2008), making connections between the symbolic and particulate levels (Xie and Tinker, 2006), and exhibiting more complex and correct use of chemistry knowledge (Winberg and Berg, 2007). Such studies show that both computer animations and simulations of the particulate level can be effective in teaching and learning the structural and dynamic aspects of chemical concepts.
However, not all animations have been found to be effective means of enhancing the learning of chemistry. Sanger and Greenbowe (2000) reported that narrated computer-based animations of an electrochemical cell did not enhance the conceptual understanding of college students compared to a conceptual change unit that included demonstrations. Vermaat et al. (2003) reported that students who were exposed to particulate-level animations and information about applications of the reactions being studied in society rarely included the particulate level in their concept maps. Even after using well designed animations, some students retain misconceptions (Kelly and Jones, 2007; Rosenthal and Sanger, 2012); Tasker (1998) argued that computer animations can even cause misconceptions and thus should be systematically designed.
Designing visualizations
Designing effective visualizations can be challenging. Tasker and Dalton (2008) suggest that animations of chemistry should be designed carefully to balance the demands of scientific accuracy, technical constraints, and clarity of communication. Different approaches for designing computer visualizations have been suggested by various researchers (Steinberg, 1984; Soloway et al., 1994; Foley, 1998; Tversky et al., 2006; Kali and Linn, 2008; Mayer, 2009).Some researchers have suggested that the focus of designing visualizations should be the learners (Soloway et al., 1994; Foley, 1998). Foley (1998) claims that educational visualizations should be designed ‘with the students in mind’; the interface should be easy to interact with and the visualization should help students to visualize the scientific content. Soloway et al. (1994) also emphasize the importance of moving from ‘user-centered’ to ‘learner-centered’ design for developing richer and deeper understanding of the content. In this approach, visualizations should include scaffolding for learners' needs, diverse tools, modeling and coaching, and different modes of expression to help learners develop comprehension and expertise. The importance of scaffolding when designing software tools that enable learners to succeed in scientific inquiry has been reported in various studies (Luchini et al., 2004; Quintana et al., 2004).
Developing design principles for visualizations and technology-based learning environments often requires collaborative work (Kali, 2002; Jones et al., 2005). Kali (2002) reported on a collaboration of researchers and designers that proposed to explore the roles of different types of visualization tools, students' needs, and instructional frameworks, leading to identification of general design principles. As a continuation of this study, Kali and Linn (2008) describe four principles to design effective visualizations that could be incorporated into science curricula. These principles include reducing visual complexity, scaffolding students' explanations, supporting students' modeling of science, and using multiple representations.
Cognitive load, which is the amount of mental activity performed by the working memory while dealing with a specific task (Sweller, 1988), has been another important construct to be considered in learning and instruction. While designing effective learning environments for novice learners the cognitive load imposed by the design should be reduced (Paas et al., 2003; Moreno, 2004) because the learner may experience cognitive overload when processing complex verbal and pictorial representations (Mayer and Moreno, 2003). Hence, in designing the liquid–vapor simulation, the aim was to create a learning environment with reduced cognitive load for students.
In addition to using the design principles identified in different studies, a methodological approach could provide direction for the designer. The cognitive design principles outlined by Tversky et al. (2006) involve the following steps:
1. Determine the mental representations of people for a given domain.
2. Develop algorithms for creating effective visualizations.
3. Finally, test the resulting visualizations to insure that they convey the desired aspects.
This approach, which has been adapted for use in developing molecular visualizations for learning chemistry (Jones et al., 2008) and that was used in this study, allows the development of visualizations within a systematic framework and research-based environment. The cognitive design principles outlined by Tversky and colleagues were chosen as the basis for this study because of their focus on revealing differences in how experts and novices understand concepts.
Purpose of the study
The original purpose of this study was to develop a research-based computer animation of liquid–vapor equilibrium by using the Tversky cognitive design principles (2006), subject the animation to formative evaluation, and revise it for final use by examining the macroscopic and particulate visualizations produced by novices and experts. However, as data were collected it became apparent that it would be difficult to address some student misconceptions with an animation and so it was decided to develop a simulation that allows some user control of variables. The goal of the project became to develop a simulation of liquid–vapor equilibrium and evaluate its effectiveness in helping students better visualize and understand the nature of dynamic liquid–vapor equilibrium. Specifically, the research questions were:1. What aspects of the mental models of a given physicochemical phenomenon can be obtained from the drawings and written explanations of experts and novices?
2. Is the developed liquid–vapor equilibrium simulation effective in helping students better understand the dynamic nature of liquid–vapor equilibrium?
Method
The method for this study was based on a design strategy outlined by Tversky et al. (2006). In this method, the first step is eliciting mental models of instructors and students through an open-ended questionnaire and semi-structured interviews, the second step is developing algorithms to design a visualization based on the research findings in the first step, then using them to develop the visualization, and the final step is to evaluate how well the visualization achieves the desired purpose. The procedure followed in the study can be summarized as follows:Stage 1 – Elicit mental models of liquid–vapor equilibrium held by instructors & students.
Stage 2 – Generate design principles, develop the visualization, pilot and revise the visualization.
Stage 3 – Test the effectiveness of the visualization.
The study included both quantitative and qualitative data collection procedures. In Stage 1, in order to discover student and instructor mental models of liquid–vapor equilibrium, participants were asked to answer questions by providing either a written or a pictorial explanation (Akaygun and Jones, 2013b). Writings and drawings were collected separately to help determine what elements of the simulation should appear in the visuals and which in the associated text or narration. The responses were then coded, categorized, and evaluated. Some participants were interviewed while using an animation (Stage 1), or after working with the developed simulation (Stages 2 and 3). Finally, the developed simulation was evaluated using a pretest-posttest design (Stage 3).
Stage 1
Stage 1 – Participants
Participants in this part of the study were 45 instructors and 94 chemistry students; 47 from a university and 47 from a high school. Instructors were volunteer chemistry or biology university instructors, high school chemistry teachers and graduate teaching assistants (chemistry or biology graduate students who had taught general chemistry). When the presence or absence of specific features they provided in their responses in the open-ended questionnaire were compared, no significant difference (p > 0.05) between these groups was found. Therefore, they were grouped together as experts. The novices were volunteers enrolled in a first year college chemistry course and in a high school chemistry course. Their responses were also not found to be significantly different (p > 0.05); thus, they were classified as novices. All the participants were randomly assigned to answer the questions by providing either a written or a pictorial explanation. Volunteer participants from each group were asked to explain their answers orally.In order to discover differences in how experts and novices interpreted the same visualizations 20 chemistry instructors (6 professors, 5 high school teachers, and 9 graduate teaching assistants), and 20 students (7 first year college students and 13 high school students) were interviewed individually or in groups of 2 or 3 while they watched 2 animations of liquid–vapor equilibrium.
Stage 1 – Instruments and processes
At each stage of the study, participants were first asked to complete a demographic form, then an Open-ended Conceptual Questionnaire (OCQ) on liquid–vapor equilibrium. The instructors were asked about their teaching experience and the students were asked about their expected chemistry grade. Questions on the OCQ were designed to reveal the mental models of the participants on dynamic equilibrium both at the macroscopic and particulate levels because both need to be connected to understand chemical and physical phenomena. The questionnaire was designed to get answers in two forms: written or pictorial, to help distinguish what aspects of the concepts are emphasized in each format. This information would then be used to understand what people see when visualizing a concept and what words are best to explain the concept. Participants were randomly assigned to answer questions on liquid–vapor equilibrium either by writing or drawing their explanations. Fig. 1 shows an example question from the OCQ. Demographic forms and the OCQ were both administered to the instructors at individually scheduled times in a separate room at their convenience. They were administered to students during the first half of their chemistry class or laboratory session.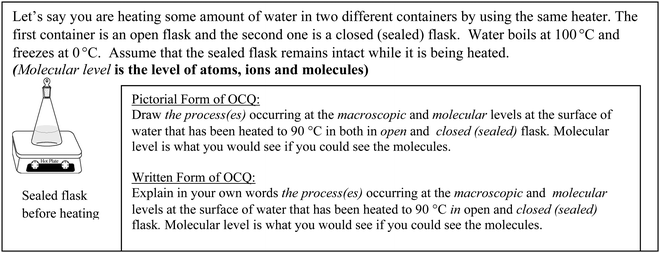 | ||
| Fig. 1 Pictorial and textual forms of an OCQ question on liquid–vapor equilibrium. | ||
In Stage 1 of the study, the interviews were conducted by using existing animations, either individually or in groups of 2 or 3, due to time constraints. During the semi-structured interviews, instructors were questioned about the accuracy, strengths, weaknesses, and misleading parts of the two animations, and suggestions for improving the animations were solicited. Participants were also asked if they considered the animation a useful tool they could use in their teaching. The procedure differed somewhat for student participants. Before watching the animation, students were first asked to describe their understanding of liquid–vapor equilibrium. While viewing the animation, they were asked to explain what that particular animation was trying to show, important features of the animation, and whether they noticed anything interesting. They were also allowed to amend or add to their initial explanations. After watching each animation, students were asked to draw a representation of the animation, describe its strengths and weaknesses, indicate new understandings they got from the animation, and make suggestions for improvement. The specific interview protocols for instructors and students are given in the Appendix A. Interviews were audio and video recorded. The recorded interviews were transcribed, and the transcriptions were checked and coordinated with the video by the researchers.
The interviewees watched two already existing freely available animations of liquid–vapor animation during the interview. Both of the animations were open source, so freely available. They were selected because they were reasonably accurate visualizations that focused on important concepts. The first one was a macroscopic-level animation showing an open and a closed flask placed side by side. By clicking on the open flask, evaporation and a decrease in the level of water was observed, whereas by clicking on the closed flask evaporation and condensation were observed as the level of water in the flask remained the same. Evaporation was indicated by the upward movement of small circles that could be taken to represent bubbles or molecules. Downward movement indicated condensation. Textual information describing what was happening in the flasks was given below the animations. An error present in this animation occurs in the explanation posted below the figure of the closed flask (on the right): two opposite reactions are mentioned. However, in liquid–gas equilibrium, no chemical reactions, only physical processes take place. The animation, which is no longer available, was posted by the Centre for Learning Innovation at the New South Wales Department of Education and Training (Centre for Learning Innovation, 2002).
Fig. 2 shows a snapshot from the first (macroscopic level) animation.
 | ||
| Fig. 2 A snapshot from the first (macroscopic level) liquid–vapor animation shown during the interviews. | ||
The second animation was a particulate-level animation showing water molecules evaporating and condensing back to the liquid, reaching an equilibrium condition. This animation zoomed in and out, giving a three-dimensional effect. Vacuum (or possibly air) was represented by a black background. The animation was available at http://bcs.whfreeman.com/chemicalprinciples3e/. A snapshot from the second (particulate level) animation is given in Fig. 3.
 | ||
| Fig. 3 A snapshot from the second (particulate level) liquid–vapor animation shown during the interviews. | ||
Stage 1—Data analysis
First the mental models of chemistry instructors and students were elicited through the open-ended questionnaire of liquid–vapor equilibrium. In this process, all the responses of the participants were listed, then coded by open-coding, and then categorized according to the common features emphasized. A detailed description of the analysis is given in Akaygun and Jones (2013b). The aspects or features emphasized by the majority of the instructors and students were identified. Interviews were first transcribed, then coded by open-coding, and specific themes were identified. These themes revealed the features or characteristics of the animations on which instructors and students focused.Stage 1—Results and discussion
Some examples of macroscopic and particulate-level explanations are given below. In Fig. 4, which is representative of the differences between expert and novice explanations, particulate-level views of liquid–vapor equilibrium are represented pictorially by an expert and a novice. In the expert drawing, water molecules were drawn in both liquid and gas phases with little lines representing the less restricted motion of the gas phase; whereas in the novice drawing, wavy lines were used to indicate the motion of gaseous water molecules and the molecules were shown in the flask. Findings such as this showed that while experts could easily visualize molecular processes in the abstract, learners preferred to visualize them in a setting. In addition, while this expert showed motion in random directions and molecules in random orientations, the novice showed motion only in an upward or downward direction and gas molecules all having the same orientation. Note that the expert also drew two images to emphasize that while there was no overall change over time the dynamic processes continued to occur.
 | ||
| Fig. 4 Particulate level pictorial representation of liquid–vapor equilibrium by (a) an expert, and (b) a novice. | ||
In order to address such differences in mental models, the simulation was designed to show molecules in a variety of orientations and moving in random directions. It was decided that the image of the flask would always be present, but that the molecules would be visible only in a molecule-viewing window, so that students would not become confused about the relative sizes of molecules and flasks.
In the particulate-level explanations below an expert mentions the processes of evaporation and condensation as well as the liquid and gas phases and the concept of energy, whereas a novice refers only to the motion of molecules. Note that the novice reveals a misconception, that liquid molecules are not moving. To address these findings, the simulation was designed to show equal rates of evaporation and condensation at equilibrium and molecules in motion in both liquid and vapor phases.
‘In a closed flask, you would have as many molecules overcoming vapor pressure to escape into gas phase as you would have gaseous water molecules losing energy and returning to liquid state’ (expert statement).
‘The molecules would be standing still then they would be moving rapidly’ (novice statement).
These findings served as the basis for the design of the simulation. First, the macroscopic and particulate-level features emphasized by both experts and novices were listed. Many of the macroscopic features were emphasized by both experts and novices. Therefore, these features were included when generating the algorithms for the simulation. Specifically, bubbles, vapor or steam, water or condensation drops, wavy surface were the features selected to be shown in the macroscopic part of the simulation. For the particulate-level, experts emphasized hydrogen-bonding, faster motion as temperature increases, dynamic processes, and the equilibrium condition, whereas novices were more likely to include space-filled representations and an increase in temperature and pressure. These features were also selected to be included in the simulation.
During the interviews instructors were asked to evaluate the accuracy, strengths, weaknesses, and misleading parts of the animations as well as their suggestions for the improvement of the animations. In addition, they were also asked if they would consider the animation as a useful tool to be used in chemistry instruction. This information was collected to guide the development of the simulation.
The codes or categories that appeared in the expert interviews for the macroscopic animation were the structure, and process of molecules and the animation design, both in terms of positive aspects, negative aspects and their suggestions (Appendix Table 9). While most of the instructors found the animation accurate and a good tool to be used in an online course or during class or laboratory instruction, they pointed out specific aspects they saw as strengths or weaknesses. They also listed their suggestions for the improvement of the animation.
A sample quote from an interview of an expert for the macroscopic animation is given below.
Researcher: … . Okay, are there any strengths considering these animations?
Instructor P: Um, the students can see that a closed system is different from an open system and so then they can think about the effects of pressure on a system. Um, I think they can get the idea that there is some sort of equilibrium going on in the, the one on the right. Well, but, I don't know that they would understand the true equilibrium because, again, it looks like just the same molecules bouncing off the surface and so there's no way to distinguish between a molecule that was a gas phase and one that was a liquid phase, and so I think that's a problem.
Researcher: Uh hah, yah, okay. Ah, are there any other weaknesses or misleading aspects, other than what you said, for these animations?
Instructor P: The molecules look too floaty, too carefree. And, you don't see any interactions between the molecules, which is the whole point of, you know, why some are still liquid, and why some are gas.
Most of the instructors found the second animation, which focused on the particulate-level, scientifically accurate, useful, valuable, and a good tool for class and laboratory instruction, because they felt it would stimulate a rich class discussion and create curiosity about the formation of vapor. They also listed positive and negative aspects of the animation, as well as their suggestions for a better design of an animation (Appendix Table 10).
A sample quote from an interview with an instructor for the particulate-level animation is given below.
Researcher: … Well, I'm going to ask you a few questions about the animation – specifically, are there any strengths?
Instructor T: The idea that this really is, um, a more appropriate designation of what a molecule looks like, a water molecule, I think that is a strength. And another strength of this animation is that even though they're attracted, they do move past each other, so I think that there's the idea that we really do have a liquid that looks similar and not all of a sudden down to, to something that is just in a shape that's stopped, that there is continual movement. I think that's a great strength.
Researcher: Uh huh. And, any weaknesses?
Instructor T: It's, there's too much in that picture – you need to be able to see what's going on. I mean even if you played it twice and could follow that hit the wall and come back down. Right now it just goes off into space and you never know where it goes, so you really don't know, and there's way too many to even count to see if there would be any type of an equilibrium, so, if you're trying to get across the idea of an equilibrium, I think we've got a problem.
The interview protocol was slightly different for students. They were first asked to explain their understanding of liquid vapor equilibrium prior to watching the animation. Next, they were asked to view the animation as many times as they liked, and then they were asked to explain what that particular animation was trying to show, crucial features of the animation, and whether they noticed anything interesting or not. At this stage, they were allowed to make additions to or change their initial explanations. Finally, after watching the animation, they were asked to draw a representation of the animation, list its strengths and weaknesses, describe new ideas they got from the animation, and suggest improvements. Appendix Table 11 summarizes the comments student participants made about the macroscopic animation.
Students were also interviewed while they watched the particulate-level animation. The procedure and the interview protocol were exactly the same as for the first animation. Appendix Table 12 shows a list of the aspects students considered to be positive and negative, their comments on the structure and process of molecules, and their suggestions for the design of the animation.
In order to discover how these animations might affect students' conceptualizations they were asked to represent their understandings of the chemical and physical processes. Thus, during the interview, students were asked to make changes in their initial drawings or explanations by using a different colored pen before and after viewing the animations. One of the high school students drew a different representation for open and closed flasks after viewing the macroscopic animation, as seen in Fig. 5. Initially, this student had represented the motion of particles in open and closed flasks by drawing a random path representing random motion (black-pen drawing). Flasks were represented by simple rectangles. After seeing the macroscopic animation, he changed his drawing to show motion taking place only in the vertical direction, up and down, instead of in random directions (blue-pen drawing). Thus, because this student changed the representation of motion from more accurate, random motion to less accurate, linear motion, the macroscopic animation may have had a negative effect on his understanding.
 | ||
| Fig. 5 A high school general chemistry student's representations of motion in (a) an open flask, and (b) a closed flask before and after viewing the first animation. | ||
Some misconceptions were corrected while students viewed the animations. One of the college general chemistry students demonstrated the common misconception of water molecules breaking into H2 and O2 molecules when water evaporates (Bodner, 1991; Nakhleh, 1992), as shown in Fig. 6(a). After working with the particulate-level animation this student corrected his misconception by showing H2O molecules evaporating as intact molecules, as shown in Fig. 6(b). Thus, this student may have become aware of his initial misconception while viewing the animation.
 | ||
| Fig. 6 A college-level general chemistry student's representations of evaporation (a) before and (b) after viewing the particulate-level animation. | ||
Stage 2
Stage 2—Participants
A formative evaluation of a preliminary version of the simulation was conducted by interviewing a chemistry professor, a high school teacher, 5 first year college students, and a high school student while they worked through the simulation.Stage 2—Instruments and processes
The simulation was designed and a storyboard created. A mockup of the simulation was then created by Saksri Supasorn to show the computer programmers how the simulation should look. The simulation was produced by the CADRE team at the University of Western Sydney. It was then piloted with instructors and students, who were interviewed while working on the simulation, and subsequently revised. The interview protocols used were the same as the ones used in Stage 1.Stage 2—Data analysis
As in Stage 1 the interviews were first transcribed, then coded by open-coding, and specific themes were identified.Stage 2—Results and discussion
Considering the probable conceptual difficulties students might experience in understanding dynamic equilibrium, a scaffolding strategy intended to enable students to succeed in scientific inquiry (Quintana et al., 2004) was included. To this end, a molecule-counter that shows the relative number of molecules evaporating and condensing at the surface was added to help students visualize the dynamic nature of equilibrium. For the same purpose the ‘Track a molecule’ and ‘Link hot plates’ buttons were included so that students could better observe what happens to an individual molecule and compare different conditions, such as how sealing the flask affects molecular behavior. In addition, an introductory section and a help button were added to provide the level of guidance recommended for computer simulations (Steinberg, 1984).
For the macroscopic view, as highlighted by the participants, open and closed flasks, vapor, water drops condensing on the sides of the flask, pressure readouts, and the surface of water were included. For the particulate view, both molecular structure and processes were considered. For structure, it was decided that the water molecules should be colored, with shading to provide a 3-D effect, and in different orientations. In addition, students' preferences were considered and the molecules were represented as space-filled, because students had used this type of representations significantly (p < 0.05) more often than the instructors. For the processes of particles, random motion, collisions, evaporation and condensation, and molecular interactions were included because the interviews with the students and instructors showed the necessity of the inclusion of these dynamics. It was also desired to display as accurate a representation of molecular dynamics at the particulate level as possible.
Based on these desired design features (Table 1), a rough story board was generated to guide the designers. Appendix Fig. 10 shows a screen from the draft storyboard created in Stage 2. From the initial storyboards a Powerpoint presentation simulating a screen-by-screen view of the simulation was developed.
| Overall design: The simulation was planned to include: | ✓ Simultaneous view of macroscopic and particulate levels | |
| ✓ Conditions at two different temperatures (25 °C and 60 °C), to be selected by the user | ||
| ✓ Pressure readings from inside and outside the flasks | ||
| ✓ Molecular level view of the liquid and gas phases and at the surface, when selected by the user | ||
| ✓ The phases selected become highlighted | ||
| ✓ View of the walls of the container at the molecular level to observe condensation at the particulate level | ||
| ✓ Text describing the content and the limitations due to being a model | ||
| ✓ ‘Track a molecule’ option, to allow students to follow a single molecule through the processes of evaporation and condensation. | ||
| ✓ A molecule counter to count the number of molecules evaporating and condensing. | ||
| ✓ An option of ‘Linking hot plates’ so that both flasks are kept at the same temperature. | ||
| ✓ At the particulate level, air molecules will first be shown, and then faded away, to help students understand that air molecules are present, but not shown. | ||
| Macroscopic view: This view would include: | ✓ Side-by-side view of open and closed flasks placed on hot plates | |
| ✓ Vapor/steam/bubbles forming | ||
| ✓ Water drops condensing on the sides of the flask | ||
| ✓ Relative levels of water in the two flasks to emphasize evaporation in the open flask | ||
| ✓ Hot plate, temperature and pressure gauges. | ||
| Particulate view: This view would include: | Structure of molecules: Water molecules would: | ✓ Be space-filled |
| ✓ Be colored | ||
| ✓ Have 3-D effect | ||
| ✓ Be shown in different orientations | ||
| ✓ Be shown colliding with the glass, with glass particles displayed as grey spheres. | ||
| Process of molecules: Water molecules would: | ✓ Move at different speeds in straight lines in random directions | |
| ✓ Collide with one another and with the walls | ||
| ✓ Move in convection currents in the liquid | ||
| ✓ Evaporate and condense both in open and closed flasks | ||
| ✓ Display formation of equilibrium | ||
| ✓ Interact with one another and form transient hydrogen bonds | ||
| ✓ Move faster at the higher temperature, using a ratio calculated from actual data. | ||
The CADRE design group at the University of Western Sydney was selected to produce the simulation. This group was also involved in the development of the particulate-level animation used in Stage 1 of this research project. However, both the programs used to generate animations and the personnel were new, so the product was not expected to be similar to the particulate-level animation. It was decided to produce a Shockwave Flash animation to allow the desired student interaction. Because the CADRE programmers were not chemists and it was difficult to communicate ideas such as molecular interaction at a distance and the function of the molecule counter, a simple Flash animation was generated by Saksri Supasorn, a chemical education graduate student now at Ubonratchathani University, Thailand, as a guide for programmers (see Appendix Fig. 11). An initial mockup of the new simulation was created by the CADRE programmers and reviewed by the researchers. The simulation plan was revised and a succession of versions were then generated and reviewed by the researchers and a group of local chemical education and instructional technology experts until a version of the simulation was deemed ready for a pilot study.
As seen in Fig. 7, the simulation shows both macroscopic and particulate views of water in an open and a closed flask placed on hot plates and displayed side by side. In the beginning of the simulation, first all the molecules were shown, and then a small number of them stay on the screen as the others fade away. The simulation allows users to observe the molecular processes occurring in the liquid, at the surface, and in the vapor by selecting these parts in the flasks. The particulate-level view for the surface includes a counter counting the number of evaporating and condensing molecules, which was designed to help students visualize the dynamic nature of the equilibrium. The particulate view for the vapor displays another counter displaying the number of molecules condensing on the wall of the flask, so that the rates of evaporation and condensation in the open and closed flasks can be compared. In addition, the simulation was designed to show the processes at two different temperatures: 25 °C and 60 °C to help students visualize the effect of increasing temperature on the rates and processes. Fig. 7 shows two flasks at different temperatures, and with different regions selected. For the system on the left the particulate view of the surface at 25 °C was selected; for the one on the right, the gas phase particulate view at 60 °C was selected. The simulation is available online at: http://artsci.drake.edu/honts/molviz/animation/page1.html.
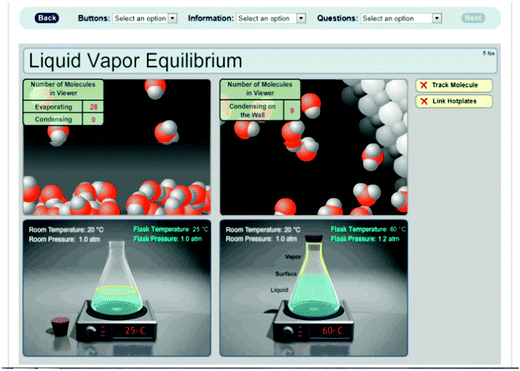 | ||
| Fig. 7 A screen shot from the liquid–vapor equilibrium simulation, which shows simultaneous processes in the open and closed flasks when different regions, in this case, the surface in the open flask and the vapor in the closed flask, are selected at two different temperatures. | ||
Student interviewees generally focused on what they understood and what they liked about the simulation. Some of them were observed to have misconceptions that the simulation helped them confront and correct. For instance, Student 4 had said she would not expect to see any condensation in the closed flask. The same student also had the misconception of water breaking into hydrogen and oxygen molecules during evaporation. The simulation helped her to visualize a more accurate picture. Sample quotes from the interviews are given below.
Instructor 1: It was a little bit difficult for them to understand which molecules were in the liquid phase, which ones were in the gas phase. It might be difficult for them to understand the difference between the number of molecules evaporating and condensing and the rates. Instructor should definitely clarify those and might lead students by asking some guiding questions.
Instructor 2: Students could easily see the connection between an equilibrium and unequilibrium conditions. Also, this animation could be used when teaching phase changes.
College Student 1: Macroscopic and particulate views, different flasks were helpful. As a suggestion, have a bigger view, narration can be an option and worksheets can be given.
College Student 2: I would think the molecules would go faster in the closed flask, because it is a smaller area and they have no place to go. I was wrong! I figured they move at the same speed. It is a representation of what is happening, so I trust it. Also, it was important to interact with it and go back.
College Student 3: I found the aspect of seeing evaporation in the closed flask surprising. I think people associate evaporation with the air. But that was closed, nothing went to air.
College Student 4: I would not expect to see any condensation in the open flask. I thought all will evaporate. I increased the temperature to 60 °C, molecules moved a little bit faster. They didn't move as fast as I was expecting them to move… . Also, it was interesting that in the water molecules, still hydrogen and oxygen were stuck together, they didn't separate at all. I expected to see a mingle of hydrogens and oxygens (gases).
College Student 5: There is equilibrium in the closed flask. The rates of evaporation and condensation were the same. As it is moving it is gaining back. In the closed flask, the vapor looked move faster, was it the software?
After analysis of the interview data, a few changes were made to the simulation, such as making the rates of random motion of molecules in the liquid and gas phases obviously different at two different temperatures. Then, the simulation was ready to be tested in a bigger study.
Stage 3
Stage 3—Participants
The participants in the quantitative component of Stage 3 were 191 first-semester college students at a medium-size public research university in the western United States. Students were in 11 different laboratory sections taught by 6 different teaching assistants. In the qualitative part of this stage a professor, a high school teacher, and 4 first-year college students were interviewed.Stage 3—Instruments and processes
The same instruments used in Stage 1 (demographic form, open-ended questionnaire, and interview protocols) were used in this stage. However, the visualization shown during the interviews was the simulation developed instead of the ones used in Stage 1.In addition to the OCQ, another instrument, Conceptual Liquid–vapor Equilibrium Test (CLVT), was given to students before and after they worked on the simulation. This test included true/false and multiple choice questions on the topic of liquid–vapor equilibrium (see the Appendix). The questions on the CLVT were prepared based on literature reports of student misconceptions and the Stage 1 findings. The instrument was validated by a group composed of two chemical educators and two chemists, and was found to be reliable (r = 0.75), based on pilot testing with 24 students.
Finally, the Personal Evaluation Questionnaire (PEQ), which contained open-ended questions to evaluate the effectiveness of the study through personal comments, was completed by students.
Stage 3—Data analysis
The mental models of chemistry instructors and students were again elicited through the open-ended questionnaire of liquid–vapor equilibrium as in Stage 1 and compared to the models obtained in Stage 1. The aspects or features emphasized by the majority of the instructors and students were identified. The conceptual liquid–vapor equilibrium test (CLVT) was scored by using its answer key. The scores of the pre-test (CLVT-pre), obtained before the implementation, and those of the post-test (CLVT-post), given after the implementation were compared by using a paired sample t-test.As in previous stages interviews were first transcribed, then coded by open-coding, and specific themes were identified. These themes revealed the features or characteristics of the animations on which instructors and students focused.
Stage 3—Results and discussion
In Stage 3, 191 first-semester college students from 11 different laboratory sections worked on the simulation during their 3 hour laboratory session during the 10th week of the semester. Students were asked to fill in demographic forms before starting to work with the simulation, and to complete the open-ended content questionnaire of liquid–vapor equilibrium (OCQ) and the conceptual liquid–vapor equilibrium test (CLVT) before and after the implementation. In addition, students completed the personal evaluation questionnaire (PEQ) at the end of the implementation.Thirty-nine percent of the participants were male and 63% female. The average reported age was 19. For their career goals, 47% of the students reported that they were pursuing a medical career, 29% of the students said their goals were studying natural sciences, 11% selected social sciences, and 13% did not declare a career goal. The majority (78%) of the participants had familiarity with computer visualizations used in chemistry.
The coding and analysis of the OCQ was carried out as described in Stage 1 and the macroscopic and particulate level aspects emphasized by students in OCQ before and after the implementation were determined. Then these aspects were compared by running a Chi-square analysis to determine the features that appeared at significantly different rates in pre- and post-mental models. The results of the comparison of key features of the dynamic nature of equilibrium in the pre- and post-mental models revealed significance differences (p < 0.01) in macroscopic descriptions, macroscopic features, molecular features, vapor, bubbles, motion, and process at the macroscopic level. It was observed that students were more likely to use structural descriptions such as vapor, bubbles, and steam in their pre-assessment; and more likely to refer to process features such as boiling, evaporation, and condensation on the OCQ post-test. In addition, students described the processes in terms of the two opposing processes of evaporation and condensation in their post-test, whereas in the pre-test, they were focused on only one type of process, evaporation or condensation, instead of both. They were also more likely to include molecular features such as water molecules, rapid molecular movement, and increase in pressure, even though they were asked to give macroscopic descriptions in the post-test. Similarly, the key features of description of structures and the processes at the particulate level were significantly different (p < 0.01) in the pre- and post-assessment of mental models. It was observed that in the post-assessment students were more likely to use terms to describe molecular structures, such as molecules, water molecules or particles, and less likely to use incorrect terminology, such as referring to water molecules as atoms. For process features, it was noticed that students were more likely to describe processes such as evaporation and condensation in the post-assessment than they were in the pre-assessment of their mental models. The features found to appear at significantly different frequencies in the pre- and post-mental models of the students are summarized in Table 2.
| Level | Category | Pre-mental models | Post-mental models |
|---|---|---|---|
| Macroscopic level | Macroscopic features | 59.7.4% vapor/steam/bubble | 41.3% vapor/steam/bubble |
| 1.0% condensation | 6.5% condensation | ||
| Molecular features | 0% bouncing molecules | 2.5% bouncing molecules | |
| 0% molecules | 2.5% molecules | ||
| Vapor/steam/gas | 16.9% vapor/steam/ | 10.4% vapor/steam | |
| 9.5% formation of steam | 6.9% formation of steam | ||
| Bubbles | 32.8% bubbles | 9.9% bubbles | |
| 19.9% bubbling | 13.4% bubbling | ||
| Motion | 0.5% fast/quick | 4.5% fast/quick | |
| 4.0% move around | 3.0% move around | ||
| Process | 18.4% bubbling | 16.7% bubbling | |
| 3.5% condensation | 7.0% condensation | ||
| Particulate level | Structure | 32.8% molecules | 64.2% molecules |
| 5.0% drawing of H2O | 2.0% drawing of H2O | ||
| Process | 3.0% evaporation & condensation | 31.8% evaporation & condensation | |
| 24.9% evaporation | 34.8% evaporation | ||
When the significant changes (Table 2) observed in expressed mental models of the particulate level after implementation were considered, it was noticed that new descriptions for process features emerged, such as evaporation and condensation. This change implies that students had refined their mental models for the dynamic nature of the equilibrium. For instance, one of the students changed his explanation from ‘molecules are breaking apart’ to ‘evaporation and condensation’.
In Stage 1 students were not scored on the accuracy of their responses, only on the features they invoked. Therefore, to develop further understanding of how the quality of student mental models might have been affected by working with the simulation, a five-point scale, the Mental Model of Equilibrium Scale (MMES), was developed by the researchers (Akaygun and Jones, 2013c). The coding rubric of this scale is based on specific key themes as shown in Table 3. For instance, ‘5’ represents an accurate/expert-level understanding, with two opposing processes occurring at equal rates, ‘4’ one level below accurate understanding, stating motion and one type of process, ‘3’ moderate understanding with missing parts, including only one kind of process, ‘2’ poor understanding, no indication of any processes, and ‘1’ inaccurate understanding, only macroscopic features included or a misconception demonstrated for the particulate level. A similar rubric was developed and used by Akaygun and Jones (2013c) in another study investigating the effects of interactivity, students used an interactive simulation of solubility equilibria and its animated version. In this study, students' mental models were evaluated by using a similar version of MMES before and after working with the visualization.
| Scale | Description of dynamic equilibrium |
|---|---|
| 5 | – Movement and two processes (Evaporation & condensation) |
| – Evaporation & condensation | |
| 4 | – Wrong terminology and two processes |
| – Movement and one process | |
| – Equilibrium and one process | |
| 3 | – Wrong terminology and one process |
| – One kind of process | |
| – Equilibrium but no description of processes | |
| – Vague descriptions (for example, interaction between water molecules) | |
| 2 | – Movement statements |
| – Only description of macroscopic and molecular | |
| – Molecular structures only | |
| – No dynamic features | |
| 1 | – Macroscopic statements only |
| – Macroscopic and movement | |
| – Misconception about chemical reactions | |
| – Chemical reactions and wrong terminology | |
| – Unrelated concepts | |
All written and pictorial OCQ responses of students were scored by using the MMES and labeled as MMES-Pr and MMES-Po, for responses given before and after the implementation, respectively. Table 4 shows sample quotes and scoring of sample written responses. The MMES scoring scheme was validated by two chemical education experts and found to be reliable by reaching 95% inter-rater agreement.
| Pre-OCQ quotes | MMES-Pr score | Post-OCQ quotes | MMES-Po score |
|---|---|---|---|
| “Molecules bumping into each other” | 2 | “Movement and evaporation” | 4 |
| “Bubbles” | 1 | “Liquid separates into gas” | 3 |
Students' pictorial responses were also scored by using MMES before and after the implementation. For instance, a student demonstrated poor understanding by separating water molecules into hydrogen and oxygen gas molecules on evaporation, as seen in Fig. 8(a), and so was given a MMES-Pr score of 1. After the implementation, the same student showed evaporation and condensation by using arrows with intact molecules, as shown in Fig. 8(b), and thus achieved a MMES-Po score of 5.
 | ||
| Fig. 8 Sample drawings of students on OCQ (a) before and (b) after the implementation. | ||
After the students' mental models were assessed before and after the implementation, the Wilcoxon Signed Ranks Test was run because the nature of data was ordinal. The understandings of dynamic nature of equilibrium before and after working with the simulation were found to be significantly different (p < 0.05). The results of the analysis show that there was a significant increase (p = 0.000) in understanding of the dynamic nature of liquid–vapor equilibrium (Table 5). This result suggests that the computer simulation had a positive effect on student understanding of liquid–vapor equilibrium.
| N | Mean | Z | Sig (2-tailed) | |
|---|---|---|---|---|
| MMES-Pr | 191 | 2.14 | –6.131 | 0.000 |
| MMES-Po | 191 | 2.92 |
In addition, the scores on the conceptual pre- (CLVT-Pr) and post- (CLVT-Po) test on liquid–vapor equilibrium were compared by a paired-samples t-test. The results of the analysis showed that post-test scores were significantly higher than pre-test scores (p = 0.000), as shown in Table 6. This result suggests that the simulation may have had an effect on student understanding of liquid–vapor equilibrium.
| N | Mean | t | df | Sig (2-tailed) | |
|---|---|---|---|---|---|
| CLVPrT | 191 | 14.41 | –8.150 | 190 | 0.000 |
| CLVPoT | 191 | 16.53 |
The personal evaluations of the students aimed to assess the opinions of the students about the interactive simulation in terms of being helpful, the aspects they liked or disliked, the most challenging part of the simulation, and suggestions for improvement. The responses of the students were coded and a frequency analysis was performed.
The majority of the students (74%) indicated that they found the simulation helpful. The most commonly liked aspects were visualization of molecules (38%), interactivity (35%), a particular feature of the simulation (5%), and simplicity, which could refer either to ease of use or to the simple, basic appearance of the visualization (4%). The most commonly disliked aspects were features such as length of the lesson (16%), a particular feature of the simulation (8%), complexity (7%), graphics (5%), simplicity (3%), being bored (3%), and limited interactivity (2%). Students listed various parts, liquid region, surface, and vapor as being challenging.
During Stage 3, four first-year college students, one university professor, and one high school teacher were interviewed. The interviewees described how they worked through the simulation of liquid–vapor equilibrium, answered questions about the positive and negative aspects of the visualization, and made suggestions for the improvement of the visualization. The responses of the students were grouped with respect to the categories (knowledge emphasized, positive and negative aspects, suggestions) given above and the number of interviewees who gave a specific response were determined. The chief aspects emphasized by the novice interviewees are shown in Table 7.
| Category | Aspects emphasized | Number of novices |
|---|---|---|
| Chemistry content | – Evaporation & condensation in both flasks | 4 |
| – Effect of temperatures on speed of molecules | 4 | |
| – Change in motion of molecules in both flasks | 3 | |
| – Equilibrium in the closed flask | 3 | |
| – Change in pressure in the closed flask | 1 | |
| – Decomposition of water into molecules of H2 and O2 (misconception) | 1 | |
| Positive aspects | – Visual representation | 4 |
| – Option of “track a molecule” | 3 | |
| – Visualization of the molecules | 2 | |
| – Being able to compare & change the temperature | 2 | |
| – Helpful in conceptual understanding | 1 | |
| – Molecular & macroscopic views of different flasks | 1 | |
| – Option of “linking the hot plates” | 1 | |
| Negative aspects | – Reading the guidelines was not easy to understand | 1 |
| Suggestions | – Add narration | 4 |
| – Add different temperatures | 2 | |
| – More interactivity | 1 | |
| – Have a bigger view | 1 | |
In general, it was observed that the students had an acceptable understanding of the concepts of evaporation and condensation, effect of temperature on the speed of molecules, motion of molecules, and equilibrium. On the other hand, even though three interviewees used the term ‘equilibrium’ to describe the processes in the closed flask, only one appeared to have a good understanding of the concept of equilibrium. One of the novices exhibited the misconception that water decomposes into hydrogen and oxygen molecules on evaporating, and did not change it after working with the simulation. Recognizing a misconception and overcoming it by means of a visualization is not an easy task and thus may require additional reinforcement from an instructor or worksheet. Two of the others said that the system was at equilibrium because no molecules were allowed to escape. The interviewees emphasized the visual representation of the simulation, the “track a molecule” option, visualization of the molecules, and being able to compare and change temperatures as the positive aspects of the simulation. The majority of the interviewees did not mention any negative aspects of the simulation, but did suggest adding a narration and including different temperatures in the simulation.
When the interviewees were asked to draw a representation for the simulation, they generated representations either for a closed flask or for both an open and closed flask. A sample drawing for the representations generated by the interviewees is shown in Fig. 9. This student, Novice 10, drew both flasks in order to compare the processes under the different conditions. She also mentioned having equilibrium in the closed flask.
 | ||
| Fig. 9 A pictorial representation of phase changes generated by the interviewee, Novice 10. | ||
The simulation used in this study was also viewed by two experts, one from the university where the study was conducted and one from a local high school, during the interviews. They were asked to evaluate the simulation in terms of its strengths, weaknesses and their suggestions for improvement. The responses of the experts were grouped with respect to the categories of questions they were asked, and the percentages of expert interviewees who gave a particular response were determined. The aspects emphasized by the expert interviewees are shown in Table 8.
| Category | Aspects emphasized | Number of experts |
|---|---|---|
| Strengths | – Demonstration of evaporation and condensation | 2 |
| – Demonstration of dynamic equilibrium | 2 | |
| – Scientifically accurate | 2 | |
| – Macroscopic and molecular levels | 1 | |
| – Different temperatures | 1 | |
| – Demonstration of random motion | 1 | |
| – Helps conceptual understanding | 1 | |
| – Molecule counter | 1 | |
| – Option of “track a molecule” | 1 | |
| – Option of “link the hot plates” | 1 | |
| Weaknesses | – Difficult for students to understand which molecules were in the liquid and which were in the vapor phase. | 1 |
| – Hard to notice the three areas to be clicked. | 1 | |
| Suggestions | – Instructors should explain some concepts in the beginning. | 1 |
| – Different temperatures showing gradual increase in the speed of molecules. | 1 | |
| – Make the regions to be clicked more apparent | 1 | |
The results of the interviews showed that these two experts agreed that the simulation was successful in demonstrating the processes of evaporation and condensation, dynamic equilibrium, and random motion of molecules accurately. Having macroscopic and molecular levels together, showing different temperatures and having the options of a molecule counter, ‘track a molecule’, and ‘link the hot plates’ were the strengths of the simulation that the experts felt would help students have conceptual understanding. They thought that it might be difficult for students to understand which molecules were in the liquid and which were in the vapor phase and to notice the three areas that could be clicked on. They suggested that the simulation could be accompanied by a worksheet including conceptual questions and instructors might give some introductory explanations. They also said that the simulation could be improved by adding the option of selecting additional temperatures.
Limitations
The research-based design strategy was useful for the development of this simulation, but it has not been thoroughly tested with other concepts. The simulation developed has limited interactivity. Due to this limited interaction, some of the students might have become bored and may not have answered adequately. The conceptual questionnaires given before and after working with the simulation, in Stage 3, were identical. Having identical questionnaires might have affected the responses of students.Conclusions
In this study, a computer simulation of physical equilibrium at both macroscopic and particulate levels was designed, developed, and tested, by using the cognitive design principles outlined by Tversky and Colleagues (2006). In this three-stage approach, initially, in Stage 1, the mental models or representations of people were determined for a given phenomenon, then in Stage 2 algorithms were developed for creating an effective visualization, and in Stage 3 the visualization was tested to assure that it effectively conveys the ideas desired. The significance of this study is that a computer visualization for teaching and learning a challenging physicochemical concept, equilibrium, was designed and developed based on this research strategy. In other words, research findings about how students and instructors visualize dynamic liquid–vapor equilibrium and how they perceive and interpret existing animations helped researchers design a simulation and test its effectiveness on learning about the dynamic nature of equilibrium.In Stage 1 initial data were collected through an open-ended conceptual questionnaire. Instructors' views provided the scientific accuracy for the concept displayed; students' views conveyed important aspects in terms of their preferences and misconceptions. For instance, instructors highlighted the opposing processes of evaporation and condensation and mentioned that they were occurring at the same rate at the particulate level, whereas students focused on features such as steam at the macroscopic level. The results of the analysis revealed the features that needed to be included in the visualization at the macroscopic and particulate levels. For instance, bubbles, vapor, condensation drops, and a wavy surface for the liquid were selected for the macroscopic part of the simulation. For the particulate level, hydrogen-bonding, the increase in molecular motion as temperature increases, dynamic processes, and the equilibrium condition, as emphasized by experts, were selected for inclusion in the simulation design. Features highlighted by novices, such as space-filled representation of molecules and showing the increase in temperature and pressure, were also included.
In Stage 1 selected students and instructors were interviewed while they were watching two animations of liquid–vapor equilibrium. Both instructors and students evaluated these animations with respect to the accuracy, strengths, weaknesses, and misleading parts of the animations as well as making suggestions for improving the design of each animation. Instructors were also asked to judge the scientific accuracy of the animations.
Students, on the other hand, were asked to explain the equilibrium situation before viewing the animation, to discuss what was happening in the animations, and to make changes in their initial representations if they needed to do so. The animations were observed both to improve student understanding and, in a few instances, to introduce a misconception.
In Stage 2, it was decided that the visualization would be learner-centered (Soloway et al., 1994; Foley, 1998), in other words a simulation, where students could select the parts they want to explore and elaborate by themselves. By making the key regions, surface, liquid, gas, interactive, the concept of dynamic equilibrium could be more effectively conveyed.
Based on the quantitative and qualitative research findings of Stage 1, design principles for a new computer visualization were devised. It was decided that the new visualization would show both macroscopic and particulate levels simultaneously and allow students to compare an open and closed system by displaying an open and a closed flask at the same time.
In Stage 3, the effectiveness of the animation was tested. The responses on an open-ended conceptual questionnaire were compared in terms of features emphasized and conceptual understanding. The analysis of the results showed that students achieved significantly better conceptual understanding of the dynamic nature of liquid–vapor equilibrium. This finding is parallel with previous literature reports (Williamson and Abraham, 1995; Sanger et al., 2000; Ebenezer, 2001; Ardac and Akaygun, 2004; Tasker and Dalton, 2006). Students' responses on the personal evaluation questionnaire and in the interviews showed that they found the simulation helpful in terms of visualization, interactivity, making comparisons, and ease of use. On the other hand, some of the students did not like the length of the lesson, graphics, lack of explanations, and limited interactivity. Instructors who viewed the simulation reported that the strengths of the simulation were its accurate representation of dynamic equilibrium and specific tools such as the molecule-counter that would help students better visualize and understand the particulate level.
Implications for teaching and learning
The developed simulation is free and available online at http://artsci.drake.edu/honts/molviz/animation/page1.html for the use of educators and students. It is appropriate for use in chemistry and physical science classes for teaching dynamic equilibrium, as well as phase changes. The simulation can be used at college, high school, and even middle school levels because it represents a very fundamental concept. More specifically, at college and high school levels, it could be used while teaching dynamic nature of equilibrium, how the rates of two opposite changes are related. At the middle school level, it could be used when teaching phase changes and the conditions needed for evaporation and condensation, to show what is happening at the molecular level while evaporation and condensation are taking place.If needed, the simulation can be supported by supplementary materials such as worksheets that might provide further scaffolding or challenges for students. For example, at the college level students can be asked to keep track of the relative numbers of molecules evaporating and condensing and to decide when equilibrium has been reached. At the middle school level students can be asked to pay attention to the differences in the gaseous and liquid states at the molecular level and to draw pictures representing their understandings of those differences. The simulation has been used with worksheets providing two different levels of guidance (more and less guided), at the college level, and the results of the study suggested that regardless of the type of guidance given by the worksheets students were able to correct their understanding as they interact with the simulation (Akaygun and Jones, 2013d). It could also be used during pre- and post-laboratory instructions because for a better conceptual understanding of physical and chemical phenomena it is important to connect macroscopic and particulate levels of representations (Johnstone, 1993; Taber, 2013).
Implications for development of visualizations for teaching chemistry
Simulations and animations for other chemistry topics can be developed by using the strategy described in this article; that is, by collecting information on the mental models of experts and novices, using that information to design the simulation or animation, subjecting it to formative evaluation, and then testing it with students. Besides chemistry, this strategy can be used to design and develop dynamic visualizations in the other fields such as physics, or biology. The research background of this strategy will not only help designers understand instructors' and students' mental models before developing a visualization for them, but also make it more effective by revealing specific student needs.Appendix: interview protocol for instructors
Thank you for your participation.You are going to view two animations on “Evaporation/Condensation” and two animations on “Solutions”. After each animation you need to answer 4 questions about that particular animation.
Evaporation—condensation animation I
http://www.lmpc.edu.au/Resources/Science/water_animations/equilibrium1.htmQuestions:
(1) Does this animation appear scientifically accurate? In what ways is it not?
(2) What do you think are the strengths of this animation?
(3) What are its weaknesses and misleading aspects, if any?
(4) Do you think the animation is a good tool to be used during instruction?
(5) Does the animation raise any questions? If yes, what are they?
(6) Do you think the animation can be improved? If yes, what do you suggest to animation designers?
Evaporation—condensation animation II (Chapter 8)
http://bcs.whfreeman.com/chemicalprinciples3e/Questions:
(1) Does this animation appear scientifically accurate? In what ways is it not?
(2) What do you think are the strengths of this animation?
(3) What are its weaknesses and misleading aspects, if any?
(4) Do you think the animation is a good tool to be used during instruction?
(5) Does the animation raise any questions? If yes, what are they?
(6) Do you think the animation can be improved? If yes, what do you suggest to animation designers?
Interview protocol for students
Prior to animation• Explain what you drew or wrote.
• Make changes if you need by using a color pen.
While viewing an animation
(oral responses, but paper provided for drawings and students can view the animation many times.
1. Watch the animation a couple of times. [pause] Now describe what you see.
2. If you feel you have learned something from this animation that you would like to incorporate into your explanations, please do that now, using a different color pen.
3. Explain what you think this animation is trying to show.
4. What are the important features of this animation for you?
5. Have you noticed anything interesting in the animation?
After viewing the animations:
1. Draw a picture of what you think happened during the animation. Explain your picture to me.
2. What aspects of the animation were helpful in enhancing your understanding of chemistry concepts?
3. What aspects of the animation may have hindered your understanding?
4. Did you find any aspect of the animation surprising? Describe what surprised you.
5. Does the animation raise any questions? If yes, what are they?
6. What new ideas or understandings about chemistry did you get from the animation?
7. What else do you wish had been included in this animation? That is, how would you like to see it extended?
8. How important to you would it be to have the animation narrated?
| Positive aspects | Negative aspects | Suggestions |
|---|---|---|
| Structure of molecules: | Structure of molecules: | Structure of molecules: |
| Good number of molecules | Circular representation of water molecules | Show liquid as combination of lots of molecules |
| Representation at the molecular level | Molecules look too floaty, carefree | Change the representation of water |
| Water molecules still left behind | Molecules are a little too big | Make them colored |
| The speed of molecules | Molecules are bouncy | Make all the molecules of the same shape |
| Molecules have energy | 2 – Dimensional | Process of molecules: |
| Process of molecules: | Process of molecules: | Show the condensation |
| Decrease in water level in open flask | Level of water decreases quickly in open flask | Slow down the rate of motion |
| The view of gas phase – motion | No motion of molecules in liquid | Have mol. occasionally come back |
| Evaporation and condensation | No condensation is shown in open flask | Show more than 1 particle getting out |
| Escaping of molecules | No collision between molecules and container | Molecules should act the same way |
| Rotation of molecules | Molecules can enter back after they escape | Show collision of mol. with walls |
| Showing equilibrium condition | Looks like a loop | Include the rates |
| Molecules leave the surface | No interaction between the molecules | Include vapor pressures |
| No net change in the closed flask | H-bonding is not shown | Design of animation: |
| Design of animation: | Molecules are spending less time in con. | State ‘the temperature’ |
| Scientifically accurate | No motion of molecules in the liquid | State ‘low boiling point’ compared to other liquids |
| Having the screens side by side | Design of animation: | Include vapor pressure |
| Showing the cap for the open flask | Not scientifically accurate | Put the label of ‘evaporation’ and ‘condensation’ |
| Connects macroscopic and molecular | Heating/temperature is not shown | Use zooming from macroscopic to molecular |
| Simplified largely | Change the color of the flask | |
| Time consuming | Have it in vacuum or leave some liquid | |
| Show them outside the bottle | ||
| Make the edge of the container darker | ||
| Add arrows for the processes | ||
| Use larger picture or screen | ||
| Add narration |
| Positive aspects | Negative aspects | Suggestions |
|---|---|---|
| Structure of molecules: | Structure of molecules: | Structure of molecules: |
| Representation of water molecules | Too many water molecules | Have less molecules |
| Shows many molecules making up the liquid | Molecules are very close together | Make the molecules a little smaller |
| You can see the boundary/surface | It does not define the surface well | Do not have so much organization down below in the liquid |
| Structure for the liquid water | Hectic | Process of molecules: |
| Shows different phases of water (gas, liquid) | Too much of a cluster | Have gas phase move/ vibrate faster |
| Process of molecules: | Too much organization in liquid – like ice | Have more molecules above the surface |
| Random movement of all molecules | Process of molecules: | Show hydrogen bonding |
| Movement at the surface | Looks like same molecule comes up and down | Show what happens above the surface |
| Hydrogen-bonding/interactions | So much going on (up and down), hard to follow | Give more emphasis to the interface between the gas and the liquid |
| Different molecules leave & come back | Hydrogen bonding/interaction aren't shown clearly | Show the differences between high and low temperature |
| Shows molecular collisions | Gas phase molecules look like they are floating | Show condensation along the walls |
| Shows turbulence | All the molecules move at the same rate | Show similar rate changes |
| Shows energy difference from top to bottom | Unequal number of molecules coming up & down | Show bouncing apart when red hits red |
| Design of animation: | It is not clear if it has reached equilibrium | Design of animation: |
| Focuses just one aspect | No collisions outside the surface | Zoom-out |
| Shows the inside of the liquid | No condensation along the walls | Have a larger view |
| Starts out under water and then move up | No vibrational energy | Combine the two animations: start with a macroscopic image, then zoom into |
| Not including air bubbles | Very small number of molecules go into the vapor | Space-out |
| It's not easy to observe the condensation | Show a container | |
| So much turmoil in the liquid | Add a temperature gage | |
| Hard to see what's going on in the vapor | Add in air bubbles | |
| Red bumping into red | ‘Describe’ the animation prior to using | |
| There should be more traffic at the interface | Include ‘stop’s at various points | |
| Doesn't show what happens to reduce the energy or fall back. | Put some arrows on things to illustrate as molecules leave, come back. | |
| Design of animation: | Add narration | |
| Zoomed-in view | Use pause | |
| Doesn't show the container (open/closed), walls | Label processes as ‘evaporation’ and ‘condensation’ | |
| Too small of a view | Have an extension animation where the students who understood the basic idea could explore more | |
| It bothers the eyes to go from bottom to up | Make sure students understand that oxygen is not really red | |
| No indication about temperature | ||
| No labels |
| Positive aspects | Negative aspects | Suggestions |
|---|---|---|
| Structure of molecules: | Structure of molecules: | Structure of molecules: |
| Easy to see where the liquid starts | Circular representation of molecules | Show the names/formula of molecules |
| Easy to see evaporated water | Water is a flat surface at the bottom | Show the molecules in liquid |
| Using little circles for steam | Water looks like milk | Color the liquid and molecules |
| Process of molecules: | Process of molecules: | Change the representation of molecules |
| Water/bubbles going out (at constant rate) | Whole bunch of molecules are rising | State the nature of liquid |
| Direction of molecules | Floating around | Process of molecules: |
| Decease/no change in the level of water | It doesn't show any change in pressure | Show the processes inside the liquid |
| Reaction of water and heat | Design of animation: | Design of animation: |
| Evaporation and condensation | No narration | Add narration |
| Building up of gas | No text for total time of evaporation | Add a hot plate |
| Design of animation: | No text for pressure | Add directional arrows where the molecules are moving |
| Simple | Show 3-D molecules | |
| Having them side by side | Add temperature and pressure | |
| Text/Explanation | ||
| Good diagrams | ||
| To be able to see the molecules | ||
| Text and animation coincide |
| Positive aspects | Negative aspects | Suggestions |
|---|---|---|
| Structure of molecules: | Structure of molecules: | Structure of molecules: |
| Representation of water molecules | Hard to distinguish between gas and liquid | Keep the molecules same size |
| Colors | Black background | Distinguish between liquid and gas |
| Water is a bunch of molecules | Process of molecules: | Keep the molecules the same |
| Different colors | It doesn't show where the molecules go? | Have the molecules change color when they evaporate/condense |
| Surface of water | No hydrogen bonding | Show less molecules |
| Process of molecules: | It focuses more on the interaction rather than evaporation/condensation | Process of molecules: |
| No change during evaporation | It doesn't show what's causing reactions. | Show hydrogen bonding |
| Evaporation and condensation | Floating around | Design of animation: |
| Molecules don't disappear | Design of animation: | Make the scope bigger |
| Showing what each molecule is doing | Hard to follow/understand | Show the container |
| Interaction of molecules | Not having a larger scope | Add narration |
| Movement molecules | A little bit vague/not clear | Narration is not needed |
| Effect of heat | Actual container is not shown | State whether it is an open/closed container |
| Design of animation: | Perspective it gives – like you are there | Add sound |
| It helps to visualize | Can't see the big picture | Give a different perspective – not like you are there |
| Not boring | Camera movements | Show the heat source |
| It moves through the molecules | Small, zoomed-in view | Show the container, then Zoom in |
| You feel like you are there | Very close | Simplify the situation |
| It shows a clear picture | Like a video game | Use label |
| 3-D | Looks like space | Break it down into steps |
| Zoom-in and zoom out | Heat source is not shown | Add an explanation |
| So much going on |
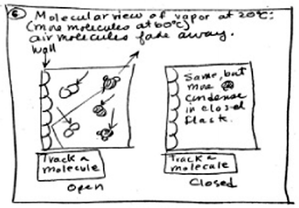 | ||
| Fig. 10 A particulate-level page from the draft storyboard created in Stage 2. | ||
 | ||
| Fig. 11 A screen from the preliminary animation created from the storyboard to guide the programmers. In this animation the molecular and macroscopic view were separate. | ||
Conceptual liquid–vapor equilibrium test
(1) Circle True or False for each of the following explanations of what happens when liquid water evaporates to form a gas.True/False: Water molecules separate into H and O atoms
True/False: Water molecules expand in size
True/False: Molecules move further apart.
True/False: Attractions between individual water molecules are broken.
(2) Assume that water is being heated from 25 °C to 90 °C in a closed flask. Circle True or False for each of the following statements about this process.
True/False: When the temperature stabilizes at 90 °C, the rate of evaporation equals the rate of condensation.
True/False: The high pressure in the closed flask keeps the water molecules from moving much.
True/False: More boiling occurs in a closed flask than an open flask because the closed flask has more heat content.
True/False: Steam molecules get smaller in size since they get trapped.
(3) Which of the following processes occur in the vapor phase when molecules of water vapor condense in a closed flask? Circle True or False for each of the following statements.
True/False: The oxygen is formed by the heat and combines with hydrogen to form liquid water.
True/False: Hydrogen is pushed down, forming water.
True/False: Water molecules in the vapor rise straight to the top of the flask, and then fall back to liquid.
True/False: When molecules in the gas phase hit the cooler walls of the flask they adhere together, becoming liquid.
(4) Assume that some water is being heated from 25 °C to 90 °C in an open flask. Which of the following statements correctly describes what is happening to the water in the flask at 90 °C? Circle True or False for each of the following statements, which describe what happens as the temperature rises:
True/False: The oxygen formed by the heat will combine with water to form steam.
True/False: Hydrogen turns into gas.
True/False: The molecules move more slowly.
True/False: The molecules move faster and the more energetic molecules move to the gas phase.
(5) Consider an open and a closed flask that contain equal amounts of water; they are both being heated from 25 °C to 90 °C. Which of the following statements about these two situations is/are correct? Circle True or False for each statement.
True/False: No condensation occurs in the open flask.
True/False: No evaporation occurs in the closed flask.
True/False: The rate of evaporation of liquid water in the two flasks is the same at 90 °C.
True/False: The rate of condensation of water vapor in the two flasks is the same at 90 °C.
True/False: It takes longer for the water in the closed flask to boil.
(6) The following closed flasks contain some water at 25 °C. State whether the following representations are correct or incorrect. Why? H2O molecule =

(7) Select the best molecular representation for water in a closed flask at 90 °C if we are able to see the molecules.
H2O molecule = 
O atom = 
H atom = 

Acknowledgements
The authors would like to acknowledge support from the National Science Foundation (NSF) award number REC-0440103, Design Principles for Effective Molecular Animations. They would also like to thank CADRE for developing the Liquid–vapor Equilibrium Simulation, Saksri Supasorn for his valuable contribution during the design stage of the simulation, and Barbara Tversky for her inspiration and guidance in the use of cognitive science research strategies. Gratitude is also due to Roy Tasker, Jerry Honts, Jerry Suits, David Falvo, Resa Kelly, Jackie Hilsenbeck-Fajardo, and the University of Northern Colorado Chemical Education Research Group for their willingness to review and comment on all aspects of this study.References
- Abdullah S. and Shariff A., (2008), The effects of inquiry-based computer simulation with cooperative learning on scientific thinking and conceptual understanding of gas laws, Eur. J. Math. Sci. Technol. Educ., 4(4), 387–398.
- Abraham M. R., Gelder J. L. and Haines K., (2001), A web-based molecular-level inquiry laboratory activity, Chem. Educ., 6, 307–308.
- Akaygun S. and Jones L., (2013a), Dynamic visualizations: tools for understanding particulate nature of matter, in Tsaparlis G. and Sevian H. (ed.), Concepts of Matter in Science Education, Vol. 19 in Innovations in Science Education and Technology, Dordrecht: Springer, pp. 279–298, DOI: 10.1007/978-94-007-5914-5.
- Akaygun S. and Jones L., (2013b), Words or pictures: a comparison of written and pictorial explanations of physical and chemical equilibrium, Int. J. Sci. Educ., accepted.
- Akaygun S. and Jones L., (2013c), Animation or simulation: investigating the importance of interactivity for learning solubility equilibria, in Suits J. P. and Sanger M. J. (ed.), Pedagogic Roles of Animations and Simulations in Chemistry Courses, ACS Symposium Series, American Chemical Society: Washington, DC, in press.
- Akaygun S. and Jones L. L., (2013d), How Does Level of Guidance Affect Understanding When Students Use a Dynamic Simulation of Liquid–Vapor Equilibrium? in Devetak I. and Glazar S. A. (ed.), Active learning and understanding in the chemistry classroom, Springer, in press.
- Ardac D. and Akaygun S., (2004), Effectiveness of multimedia-based instruction that emphasizes molecular representations on students' understanding of chemical change, J. Res. Sci. Teach., 40(4), 317–337.
- Bodner G., (1991), I have found you an argument: the conceptual knowledge of beginning chemistry graduate students, J. Chem. Educ., 68(5), 385–388.
- Burke K., Greenbowe T. and Windschitl M., (1998), Developing and using conceptual computer animations for chemistry instruction, J. Chem. Educ., 75(12), 1658–1661.
- Centre for Learning Innovation (CLI), (2002), Learning resources, water, part 4: equilibrium animations: evaporation and condensation. New South Wales Department of Education and Training. Animation formerly available on the internet, accessed 2008.
- Ebenezer J., (2001), A hypermedia environment to explore and negotiate students' conceptions: animation of the solution process of table salt, J. Sci. Educ. Technol., 10, 73–91.
- Foley B. J.(1998), Designing Visualization Tools for Learning. Proceedings CHI'98: Conference Summary on Human Factors in Computing Systems, pp. 309–310.
- Gil V. M. S. and Paiva J. C. M., (2006), Using Computer Simulations To Teach Salt Solubility. The Role of Entropy in Solubility Equilibrium, J. Chem. Educ., 83, 170–172.
- Johnstone A. H., (1993), The development of chemistry teaching: a changing response to changing demand, J. Chem. Educ., 70(9), 701–704.
- Jones L., Honts J., Tasker R., Tversky B., Suits J., Falvo D. and Kelly R., (2008), Designing Effective Visualizations of Molecular Structure and Dynamics. Available at http://artsci.drake.edu/honts/molviz/assets/ConfChem08-MolAni.pdf, accessed 09 Dec 2012.
- Jones L. L., (1988), Enhancing Instruction in the Practice of Chemistry with the Computer-assisted Interactive Videodisc, Trends Anal. Chem., 7, 273–276.
- Jones L. L., Jordan K. D. and Stillings N. A., (2005), Molecular visualization in chemistry education: the role of multidisciplinary collaboration, Chem. Educ. Res. Pract.,6(3), 136–149.
- Jones L. L. and Tasker R., (2002), Bridging to the Lab: Media Connecting Chemistry Concepts with Practice, New York: W.H. Freeman and Company.
- Jong D. T. and Joolingen V., (1998), Scientific discovery learning with computer simulations of conceptual domains, Rev. Educ. Res., 68, 179–201.
- Kali Y., (2002), CILT2000: Visualization and Modeling, J. Sci. Educ. Technol., 11(3), 305–310.
- Kali Y. and Linn M. C., (2008), Designing Effective Visualizations for Elementary School Science, Elem. Sch. J., 109(2), 181–198.
- Kelly R. M. and Jones L. L., (2007), Exploring how different features of animations of sodium chloride dissolving affect students' explanations, J. Sci. Educ. Technol., 16(5), 413–429.
- Luchini K., Quintana C. and Soloway E., (2004), Design Guidelines for Learner-Centered Handheld Tools. Proceedings CHI'04: Proceedings of the SIGCHI Conference on Human Factors in Computing Systems, pp. 135–142.
- Martin J. S., (2002), SIRs: Simulations and Interactive Resources for Windows, J. Chem. Educ., 79, 639.
- Mayer R., (2009), Multimedia learning, 2nd edn, New York, NY: Cambridge University Press.
- Mayer R. E. and Moreno R., (2003), Nine ways to reduce cognitive load in multimedia learning, Educ. Psychol., 38, 43–52.
- Moreno R., (2004), Decreasing cognitive load in novice students: effects of explanatory versus corrective feedback in discovery-based multimedia, Instruct. Sci., 32, 99–113.
- Nakhleh M. B., (1992), Why some students don't learn chemistry, J. Chem. Educ., 69(3), 19–196.
- Oakes K. and Rengarajan R., (2002), Practice makes perfect – E-learning – simulation in training, http://www.accessmylibrary.com/coms2/summary_0286-26666464_ITM, accessed on 08/10/2012.
- Paas F., Renkl A. and Sweller J., (2003), Cognitive load theory and instructional design: recent developments, Educ. Psychol., 38, 1–4.
- Quintana C., Reiser B. J., Davis E. A., Krajcik J., Fretz E., Duncan R. G., Kyza E., Edelson D. and Soloway E., (2004), A scaffolding design framework for software to support science inquiry, J. Learn. Sci., 13(3), 337–386.
- Reiber L., (1991), Animation, incidental learning and continuing motivation, J. Educ. Psychol., 83(3), 318–328.
- Rosenthal D. P. and Sanger M. J., (2012), Student misinterpretations and misconceptions based on their explanations of two computer animations of varying complexity depicting the same oxidation–reduction reaction, Chem. Educ. Res. Pract., 13, 471–483.
- Sanger M. J. and Greenbowe T. J, (2000), Addressing student misconceptions concerning electron flow in aqueous solutions with instruction including computer animations and conceptual change strategies. Int. J. Sci. Educ., 22, 521–537.
- Sanger M. and Greenbowe T., (1997), Students' misconceptions in electrochemistry: current flow in electrolyte solutions and the salt bridge, J. Chem. Educ., 74(7), 819–823.
- Sanger M., Phelps A. and Fienhold J., (2000), Using a computer animation to improve students' conceptual understanding of a can-crushing demonstration, J. Chem. Educ., 77(11), 1517–1520.
- Soloway E., Guzdial M. and Hay K. E., (1994), Learner-centered design: the challenge for HCI in the 21st century, Interactions, 1(2), 36–48.
- Steffen L. K. and Holt P. L., (1993), Computer simulations of chemical kinetics (CS), J. Chem. Educ., 70, 991–992.
- Steinberg E. R., (1984), Teaching Computers to Teach, Hillsdale, NJ: Lawrence Erlbaum.
- Stieff M. and Wilensky U., (2003), Connected Chemistry – Incorporating Interactive Simulations into the Chemistry Classroom, J. Sci. Educ. Technol., 12(3), 285–302.
- Sumfleth E., Körner H.-D. and Gnoyke A., (1996), Imagery of information: prerequisites and consequences, in Welford G., Osborne J. and Scott P. (ed.), Research in Science Education in Europe, London: Falmer Press.
- Supasorn S., Suits J. P., Jones L. L. and Vibuljan S., (2008), Impact of a pre-laboratory organic-extraction simulation on comprehension and attitudes of undergraduate chemistry students, Chem. Educ. Res. Pract., 9, 169–181.
- Sweller J., (1988), Cognitive load during problem solving: effects on learning, Cognit. Sci., 12(1), 257–285.
- Taber K. S., (2013), Revisiting the chemistry triplet: drawing upon the nature of chemical knowledge and the psychology of learning to inform chemistry education, Chem. Educ. Res. Pract.,14, 156–168.
- Tasker R., (1998), The VisChem project: molecular level animations in chemistry – potential and caution. UniServe Science News, 9. Available at http://science.uniserve.edu.au/newsletter/vol9/tasker.html (retrieved on October 19th 2012).
- Tasker R. and Dalton R., (2006), Research into practice: visualisation of the molecular world using animations, Chem. Educ. Res. Pract., 7(2), 141–159.
- Tasker R. and Dalton R., (2008), Visualizing the Molecular World – Design, Evaluation, and Use of Animations, in Gilbert J. K., Reiner M. and Nakhleh M. (ed.), Visualization: theory and practice in science education, Dordrecht: Springer, pp. 103–131.
- Tversky B., Agrawala M., Heiser J., Lee P. U., Hanrahan P., Phan D., Stolte C. and Daniele M., (2006), Cognitive design principles for automated generation of visualizations, in Allen G. (ed.), Applied spatial cognition: from research to cognitive technology. Mahwah, NJ: Erlbaum, pp. 53–74.
- Velázquez-Marcano A., Williamson V., Ashkenazi G., Tasker R. and Williamson K., (2004), The use of video demonstrations and particulate animation in general chemistry, J. Sci. Educ. Technol., 13, 315–323.
- Vermaat J. H., Terlouw C. and Dijkstra S., (2003), Multiple representations in web-based learning of chemistry concepts. A paper presented at the 84th Annual Meeting of the American Educational Research Association, Special Interest Group Technology, Instruction, Cognition and Learning; Chicago IL, USA.
- Williamson V., (2008), The particulate nature of matter: an example of how theory-based research can impact the field, in Bunce D. and Cole R. S. (ed.), Nuts and Bolts of Chemical Education Research, Washington DC: American Chemical Society, pp. 67–78.
- Williamson V. M. and Abraham M. R., (1995), The effects of computer animation on the particulate mental models of college chemistry students, J. Res. Sci. Teach.32(5), 521–534.
- Winberg M. T. and Berg C. A. R., (2007), Students' cognitive focus during a chemistry laboratory exercise: effects of a computer-simulated prelab, J. Res. Sci. Teach., 44(8), 1108–1133.
- Xie Q. and Tinker R., (2006), Molecular Dynamics Simulations of Chemical Reactions for Use in Education, J. Chem. Educ., 83, 77–83.
| This journal is © The Royal Society of Chemistry 2013 |