Synthesis of mesh-like Fe2O3/C nanocomposite via greener route for high performance supercapacitors

Balasubramanian Sethuramana, Kamatchi Kamaraj Purushothaman*a and Gopalan Muralidharanb
aDepartment of Physics, TRP Engineering College (SRM group), Irungalur- 621105, Tamilnadu, India. E-mail: purushoth_gri@yahoo.co.in; Fax: +91431-3058951; Tel: +91431 2908050
bDepartment of Physics, Gandhigram Rural Institute, Gandhigram-624302, Tamilnadu, India

Received 11th September 2013 , Accepted 1st November 2013

First published on 1st November 2013


Abstract

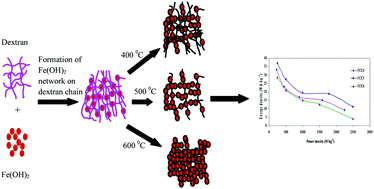
A facile and template free greener route is used to fabricate natural polysaccharide based biocompatible mesh-like Fe2O3/C nanocomposites for supercapacitor application. Thermal, structural and morphological properties of iron oxide–carbon composites prepared at different annealing temperature have been analyzed and the electrochemical properties of composites are evaluated. The nanocomposite prepared at 500 °C with mesh-like structure reveals maximum specific capacitance of 315 F g−1 in 2 M KOH solution at a scan rate of 2 mV s−1 and good capacity retention (88.9%) after 1500 continues charge–discharge cycles with energy density of 37 W h kg−1, indicating that the Fe2O3/C composite can be a promising electroactive material for a supercapacitor.


1. Introduction

Increasing energy demand, uncertainties in energy supply and global warming necessitate the development of sustainable energy conversion and energy storage systems, such as solar cells, batteries, fuel cells and supercapacitors. Moreover the new market applications i.e., portable electronic devices, hybrid electric vehicles, renewable energy systems, large industrial equipment and memory back-up devices require compact, low mass and efficient electrical power devices such as supercapacitors.1–4 Supercapacitors (SCs) are one of the most promising high performance energy storage devices and are also referred to as electrochemical capacitors or ultracapacitors.4,5 SCs bridge the power–energy gap between conventional capacitors and batteries/fuel cells.6,7 SCs can also boost the performance of batteries or fuel cells by complementing power backup against power disruptions and provide power for acceleration in hybrid electric vehicles. SCs exhibit significant characteristics such as, low equivalent series resistance, fast power delivery or uptake (1–30 s), high-power density (1000–2000 W kg−1), high cycle efficiency (0.90–0.95) and long life cycle (>100[thin space (1/6-em)]000).8–10

Based on the energy storage mechanisms, SCs are classified into Electric Double Layer Capacitors (EDLCs) and pseudocapacitors. EDLCs store energy through accumulation of charges at electrode and electrolyte interface.11 Carbonaceous materials are suitable candidates for EDLCs due to their high specific surface area, high thermal stability, high conductivity and excellent corrosion resistance to electrolyte.12 However, the energy density (3–5 W h kg−1) of commercially available EDLCs are much lower than electrochemical batteries with limited specific capacitance.13 On the other hand, pseudocapacitors store the energy through Faradaic redox reaction.14 Materials undergoing such redox reactions include conducting polymers and various metal oxides such as RuO2, MnO2, NiO, Fe2O3, etc. These materials exhibit larger capacitance (10–100 times) and higher energy density than EDLCs due to their reversible multielectron redox Faradaic reactions.15,16 However, pseudocapacitors suffer from low conductivity, lower power density17 because of slower Faradaic processes than non-Faradaic processes and lack of stability due to the occurrence of reactions at the electrode. To overcome this issue, recent research focuses on hybridizing electrode materials i.e. composite electrode containing both carbon and transition metal oxide. The high electronic conductivity, surface area of carbon and the pseudocapacitive behavior of metal oxides mitigate the shortcomings of both the components and contribute to high specific capacitance, high energy density and good cyclic stability.11

Among the various transition metal oxides, Fe2O3 offers high theoretical capacitance, low cost, environmental friendliness and abundance.18–21 As a result it has emerged as a potentially promising electrode material for supercapacitors. However, the poor electronic conductivity and rapid capacity decay of Fe2O3 restricts its applications.22–24 To solve this issue, an attempt has been made to synthesise iron oxide–carbon composites. Generation of hazardous byproducts during the synthesis of nanomaterials via conventional methods lead to environmental issues. In order to eliminate/minimize the hazardous byproducts, natural and modified polysaccharides have been used to derive highly crystalline, non-toxic, biocompatible and highly functionalized environmentally benign nanoscale materials. For the first time Fe2O3/C has been synthesized via a greener route using dextran (C6H10O5)n as surfactant as well as the carbon source for SC application. Further, the material was annealed at various temperatures to obtain Fe2O3/C composite and the effect of annealing temperatures on the structural, morphological and electrochemical behavior was studied to assess the potential of Fe2O3/C composite as an active electrode material for a supercapacitor.

2. Experimental section

2.1. Green synthesis of Fe2O3/C nanocomposites

Analytical grade ferric nitrate, dextran (10[thin space (1/6-em)]000 MW) and ammonia solution were purchased and used without any further purification. 10 mM of Fe(NO3)3·9H2O and 0.4 mM of dextran were dissolved separately in 50 ml and 150 ml of triple distilled water, respectively. A clear solution of dextran was added slowly into ferric nitrate solution under constant stirring at room temperature. In order to maintain the pH at 10, ammonia solution was added dropwise and the solution was stirred vigorously for 4 h. The resultant homogeneous solution was allowed to precipitate at room temperature. Finally, the dark brown powder was collected by centrifugation and washed several times with distilled water and then dried at 80 °C for 24 h. The obtained powder was annealed at 400, 500 and 600 °C for 2 h to obtain the final product of Fe2O3/C nanocomposite (denoted as FCC4, FCC5 and FCC6 respectively).

2.2. Characterization techniques

The surface morphology and the elemental compositions of the Fe2O3/C nanocomposites have been investigated using field emission scanning electron microscope (SEM FEI Quanta FEG 200) and energy dispersive X-ray spectroscopy (EDS – Bruker). X-Ray diffraction analysis (XRD) was performed using PANalytical X'pert-PRO diffractometer equipped with a Cu-Kα sealed tube (λ = 1.5406 Å) to identify the crystalline phases of materials. The Raman spectra were recorded from 50 to 2000 cm−1 using a Bruker RFS 27 spectrometer. The thermal behavior of the samples was analyzed by a TA instrument (SDT Q600) under air atmosphere at a scan rate of 20 °C min−1. The specific surface area was calculated by the Brunauer–Emmett–Teller (BET) method and pore size distribution was obtained from the desorption plot by Barrett–Joyner–Halenda (BJH) Analysis using a Micromeritics (ASAP 2020 V3.00 H) system.

2.3. Fabrication of electrode and electrochemical measurements

Electrochemical measurements such as cyclic voltammetry (CV), galvanostatic charge–discharge analysis (GCD) and electrochemical impedance spectroscopy (EIS) were carried out using three-electrode cell systems (CHI 660 D, CH Instruments), which consist of the prepared Fe2O3/C electrode as the working electrode, platinum wire as counter electrode and Ag/AgCl as the reference electrode. The slurry of working electrode was prepared by mixing 85 wt% of Fe2O3/C nanocomposite, 10 wt% of activated carbon and 5 wt% of polytetrafluoroethylene (PTFE) with a few drops of ethanol. This slurry was coated on to a 1 cm2 graphite sheet and it was followed by drying at 80 °C for 12 h. The electrochemical analysis was performed in 2 M KOH aqueous electrolyte at room temperature.

3. Results and discussion

3.1. Structural, thermal, morphological, elemental and surface analysis

The crystallinity and phase purity of the prepared iron oxide–carbon nanocomposite materials were examined by X-ray diffraction analysis. Fig. 1 shows the XRD patterns of FCC4, FCC5 and FCC6. The diffraction peaks are observed at 24.30, 33.30, 35.60, 40.80, 49.50, 54.30, 57.50, 62.50 and 64.00° for all the materials, which are perfectly indexed as (012), (104), (110), (113), (024), (116), (018), (214) and (300) planes. Additionally two further diffraction peaks with lesser intensity have been identified in FCC6 at 72.30 and 75.40° that correspond to (119) and (220) planes. These planes confirm that the FCC4, FCC5 and FCC6 materials are crystalline in nature with orthorhombic structure of hematite Fe2O3 (JCPDS file no. 89-8103).25 The absence of any peak related to carbon in the diffraction patterns confirms that the carbon is present in the composite in the amorphous state. The intensity and sharpness of the diffraction peaks increases with increase in annealing temperature. The average particle size is 18, 20 and 22 nm for FCC4, FCC5 and FCC6, respectively, as calculated using the Debye–Scherrer equation. This result shows that the crystallinity increases when the annealing temperature is increased from 400 to 600 °C.
image file: c3ra45025b-f1.tif
Fig. 1 X-Ray diffraction patterns of FCC4, FCC5 and FCC6.

The thermal studies were carried out (TG-DTA) from room temperature to 1000 °C at a heating rate of 20 °C min−1 in air atmosphere (ESI – Fig. S1) to understand the effect of temperature on the as-prepared material. Weight loss could be observed in three stages, room temperature to 211 °C, 211–304 °C and 304–1000 °C. In the first stage evaporation of intercalated and absorbed water molecules lead to ∼15% weight loss.26 In the second stage, weight loss of about 40% occurs due to dehydration of iron hydroxide. The formation of iron oxide at 300 °C is confirmed by XRD analysis (ESI – Fig. S2) and the organic breakdown of the polysaccharide dextran chain.27 The weight loss during the last stage may be attributed to the burn off of carbon. Exothermic peaks have also been observed at 293 and 486 °C associated with weight loss due to evaporation of physically adsorbed water, simultaneous oxidation and decomposition of dextran.28,29

Raman analysis has been made to gain the information about the structure of Fe2O3/C nanocomposites and the Raman spectra of FCC4, FCC5 and FCC6 are shown the Fig. 2. The peaks observed at 225 and 495 cm−1 correspond to Fe–O symmetric stretching vibration (A1g mode) while Fe–O symmetric bending of Fe2O3 is observed around 290, 410 and 615 cm−1 (Eg mode).30 Raman peaks observed around 1360 and 1585 cm−1 correspond to the D and G-band of carbon, respectively.31 The peaks around the region of 1600–1700, 1200–1500 and 1100 cm−1 belong to aromatic C[double bond, length as m-dash]C bond, C–O stretching vibration and C–O–C symmetric and asymmetric vibrations respectively. Raman analysis confirms the formation of Fe2O3/C composite.


image file: c3ra45025b-f2.tif
Fig. 2 FT-Raman spectra of FCC4, FCC5 and FCC6.

Fig. 3 shows FESEM images of FCC4, FCC5 and FCC6. FCC4 shows the formation of a network like structure with limited pores while porosity increases upon increasing the annealing temperature to 500 °C (FCC5) and leads to a mesh-like network. FCC6 exhibits an uneven and rough surface due to collapse of small pore walls, which effectively reduce the useful surface area for ion intercalation/deintercalation. Scheme 1 shows the mechanism of formation of the mesh-like structure. The chain like structure of dextran initiates the formation of iron hydroxide chains in the initial stages. During the annealing process, dextran decomposes into carbon and forms the Fe2O3/C nanocomposite. The burnt off carbon varies with annealing temperatures, which lead to changes in the morphology of the material. Energy dispersive X-ray spectroscopy analysis was employed to determine the elemental composition of Fe2O3/C nanocomposites. Fig. 4 shows EDX spectra with atomic % of elements of FCC4, FCC5 and FCC6. Three major peaks and one weak peak are observed which indicate the existence of oxygen, iron and carbon. When the annealing temperature is increased from 400 to 600 °C, the atomic percentage of carbon decreased from 3.4 to 2.3% due to burning off of carbon.


image file: c3ra45025b-f3.tif
Fig. 3 FESEM images of Fe2O3/C composite (a) prepared at 400 °C; (b1 & b2) prepared at 500 °C and (c) prepared at 600 °C.

image file: c3ra45025b-s1.tif
Scheme 1 Formation mechanism of Fe2O3/C nanocomposite at different annealing temperature.

image file: c3ra45025b-f4.tif
Fig. 4 EDX Spectra and presence of elements (atomic %) of (a) FCC4, (b) FCC5 and (c) FCC6.

Fig. 5 shows the textural characteristics of the surface of FCC4, FCC5 and FCC6, evaluated by BET analysis using nitrogen sorption isotherms. The isotherms of all three samples displayed type IV characteristics with a H4 hysteresis loop.32 Hysteresis loops are associated with capillary condensation in the p/p0 range of 0.45–0.99 for FCC4, 0.15–0.99 for FCC5 and 0.55–0.99 for FCC6, which indicate a high textural porosity in the samples.33 Pore size distribution of the samples is shown in the inset of Fig. 5, which confirms that all samples contain mesopores and they are in the range 2.9–14.9, 8.2–40.9 and 9.1–43.6 nm, respectively, for FCC4, FCC5 and FCC6. The measured BET specific surface area of FCC4, FCC5 and FCC6 were 64.4, 34.4 and 19.8 m2 g−1 and the pore volumes were 0.163, 0.177 and 0.153 cm3 g−1, respectively. At higher temperatures (500 and 600 °C), the surface area was reduced drastically due to collapse of small pore walls and the pore size became larger due to expansion of pores,34 and the evaporation of carbon at higher temperatures also plays a significant role.


image file: c3ra45025b-f5.tif
Fig. 5 Nitrogen adsorption–desorption isotherms with corresponding pore size (inset) distribution of FCC4, FCC5 and FCC6.

3.2. Electrochemical studies of Fe2O3/C composites

3.2.1. Cyclic voltammetry study. The electrochemical behavior of the Fe2O3/C nanocomposites was investigated by cyclic voltammetry analysis in the potential range of −0.7 to 0.2 V. Fig. 6 shows the CV curves of FCC4, FCC5 and FCC6 at different scan rates (2 to 25 mV s−1). Well resolved redox peaks are observed, which reveals that the pseudocapacitive behaviour is dominant in these electrodes while EDLCs show ideal rectangular curves. Specific capacitance has been calculated using the relation
 
image file: c3ra45025b-t1.tif(1)
where, I is the average current during anodic and cathodic scan (A), m is the mass of the electrode (g) and v is the scan rate (V). FCC4, FCC5 and FCC6 exhibit specific capacitances of 302, 315 and 268 F g−1 at 2 mV s−1 respectively. FCC5 shows the maximum specific capacitance due to the formation of mesh-like structure with excellent porosity and the best pore volume. These pores probably act as a passage for ions to intercalate with inner active sites and enhance the electrochemical reaction and storage capacity of the electrode. Xifeng et al.35 have reported a specific capacitance of 33 F g−1 for Fe2O3 and 96 F g−1 for graphene/Fe2O3 in 1 M KOH at a scan rate of 1 mV s−1. In the present study, the specific capacitance of nanocomposites is much higher than the reported values. Fig. 7 shows the specific capacitance as a function of scan rate. The specific capacitance values are found to decrease with increase in scan rate. The specific capacitance is heavily dependent on the ion diffusion in the electrolyte, the surface adsorption of ions on the electrode materials and the charge transfer in the electrode.36–38 At higher scan rate, any of the three processes may be relatively slow, which lowers the specific capacitance.

image file: c3ra45025b-f6.tif
Fig. 6 Cyclic voltammograms of FCC4, FCC5 and FCC6 electrodes at different scan rates in 2 M KOH electrolyte.

image file: c3ra45025b-f7.tif
Fig. 7 Specific capacitance of working electrode as a function of scan rate.
3.2.2. Galvanostatic charge–discharge study. Galvanostatic charge–discharge (GCD) analysis were performed in the potential range of −0.4 to 0.5 V at different current densities (0.5, 1, 2, 3 and 5 A g−1) to estimate the specific capacitance and cyclic stability of Fe2O3/C nanocomposites. Fig. 8 shows the charge–discharge curves of FCC4, FCC5 and FCC6. The specific capacitance was calculated using the following equation
 
image file: c3ra45025b-t2.tif(2)
where I is the discharge current (A), m is the mass (g) of the active materials, ΔV represents the potential difference (V), Δt is the discharge time (s). FCC4, FCC5 and FCC6 exhibit specific capacitances of 294, 295 and 228 F g−1 at 0.5 A g−1, respectively. Specific capacitances at different current densities are shown in Fig. 9. The specific capacitance decreases with increase in current density. This is due to a high IR drop and slow rate of redox reactions at higher current densities.39

image file: c3ra45025b-f8.tif
Fig. 8 Charge and discharge curves of FCC4, FCC5 and FCC6 at different current densities.

image file: c3ra45025b-f9.tif
Fig. 9 Specific capacitance of Fe2O3/C composites as a function of current densities.

The cyclic stability of the electrode is the crucial factor towards the practical implementation of SC devices. The cyclic stability of FCC5 has been investigated at a current density of 5 A g−1. Fig. 10 shows the retention of specific capacitance over 1500 cycles of FCC5. The specific capacitance is stable up to 400 cycles and 5.6% of loss has been observed between 400 and 600 cycles and retains the same up to 1100 cycles. It retains 88.9% of the initial capacitance after 1500 cycles. The fading in the capacitance may due to irreversible reaction between electrode and electrolyte.40 Sassin et al.24 have reported the specific capacitance retention of about 80% after 1000 cycles for FeOx/C composite. Capacitance retention of 70% after 500 cycles was reported by Wu et al.41,42 for α-Fe2O3 nanosheets prepared via an electrodeposition method. Wang et al.43 have reported capacitance retention of 74% after 1000 cycles for mesoporous hematite nanostructures. Compared to these results our material has shown better cyclic performance. Mechanical stress developed during continuous ion insertion and deinsertion may also lead to capacitance fading. The presence of carbon may lead to withstanding from structural change and increase in cycle life.


image file: c3ra45025b-f10.tif
Fig. 10 Cyclic behaviour of FCC5 at constant current density of 5 A g−1.

The specific energy density and power density is evaluated from charge–discharge curves by using the following formulae.

 
image file: c3ra45025b-t3.tif(3)
 
image file: c3ra45025b-t4.tif(4)
Here C – specific capacitance (F g−1), V – potential window (V) and Δt – discharge time (h).

Ragone plots of FCC4, FCC5 and FCC6 are shown in Fig. 11. Fe2O3/C nanocomposites showed significant energy density and power density. FCC4, FCC5 and FCC6 exhibit energy density of 33, 37 and 29 W h kg−1 with a power density of 225, 250 and 250 W kg−1 at a current density of 0.5 A g−1, respectively. FCC5 exhibits the maximum energy density, almost equal to the energy density of an electrochemical battery13 (30–40 W h kg−1). The energy density of Fe2O3/C composites decreases gradually from 37 to 11 W h kg−1 as the power density increases from 250 to 2500 W kg−1 with increase of current density from 0.5 to 5 A g−1.


image file: c3ra45025b-f11.tif
Fig. 11 Ragone plot of FCC4, FCC5 & FCC6 electrodes.
3.2.3. Electrochemical impedance study. Electrochemical impedance measurements were carried out to obtain the information about the conductivity of the electrode materials. The typical Nyquist plot for FCC4, FCC5 and FCC6 in the frequency range of 0.01 Hz to 1 × 10⁵ Hz is shown in the Fig. 12. The Nyquist plot represents the plot of imaginary component (Z′′) against the real component (Z′) of impedance and shows the frequency response of the electrode/electrolyte system. The plot can be resolved into two portions, (i) a semicircle at high-frequency region and (ii) a straight line at low-frequency region. The Nyquist plot can be fitted with an equivalent circuit for impedance analysis (inset in Fig. 12), where Rs is the solution resistance of the electrochemical system, Cdl is double layer capacitor, Cp is the pseudocapacitance, W is the Warburg impedance and Rct is Faradaic interfacial charge transfer resistance. Rs and Rct both can be obtained from the Nyquist plot, where the high-frequency semicircle intercepts the real axis at Rs and Rs + Rct, respectively. FCC4, FCC5 and FCC6 show solution resistances of 1.26, 1.83 and 1.12 Ω with charge transfer resistances of 7.06, 6.13 and 7.22 Ω, respectively. The presence of a semicircle in the high frequency range corresponds to the charge transfer resistance (Rct) of the electrode. Rct is the Faraday resistance and related to electroactive surface area of the electrode. The Faradaic interfacial charge transfer resistance of the FCC5 is very low, which can considerably improve the power density.44 The reduced charge transfer resistance of the composites results in better rate capability because the charge transfer resistance acts as a limiting factor for fast charge and discharge of SC.45
image file: c3ra45025b-f12.tif
Fig. 12 Nyquist plot of FCC4, FCC5 and FCC6 at 0.3 V. The inset shows the equivalent fitting circuit.

4. Conclusion

We have reported a simple and template free green method to synthesise nanostructured Fe2O3/C composites. Raman and EDS analysis confirms the formation of carbon due to decomposition of dextran at higher temperatures. The porous structure of the nanocomposites provides more active sites for redox reaction, which enhance the supercapacitor performance. The mesh-like Fe2O3/C nanocomposite (FCC5) exhibits maximum specific capacitance of 315 F g−1 and power density of 250 W kg−1 with good cyclic stability. The lower interfacial charge transfer resistance results in higher specific capacitance. These results suggested that Fe2O3/C nanocomposites are very promising candidates for future development of safe and cost-effective electrochemical supercapacitors.

Acknowledgements

The authors wish to thank the Nano Research Center, SRM University, Chennai, Tamilnadu, India for providing the FESEM facility.

References

  1. J. T. Zhang and X. S. Zhao, ChemSusChem, 2012, 5, 818–841 CrossRef CAS PubMed.
  2. U. Eberle and R. Von Helmolt, Energy Environ. Sci., 2010, 3, 689–699 CAS.
  3. G. P. Wang, L. Zhang and J. J. Zhang, Chem. Soc. Rev., 2012, 41, 797–828 RSC.
  4. M. Winter and R. J. Brodd, Chem. Rev., 2004, 104, 4245–4269 CrossRef CAS.
  5. L. H. Bao, J. F. Zang and X. D. Li, ACS Nano, 2011, 11, 1215–1220 CAS.
  6. C. Largeot, C. Portet, J. Chmiola, P. Taberna, Y. Gogotsi and P. Simon, J. Am. Chem. Soc., 2008, 130, 2730–2731 CrossRef CAS PubMed.
  7. S. Kandalkar, D. Dhawale, C. Kim and C. Lokhande, Synth. Met., 2010, 160, 1299–1302 CrossRef CAS PubMed.
  8. P. Simon and Y. Gogotsi, Nat. Mater., 2008, 7, 845–854 CrossRef CAS PubMed.
  9. J. R. Miller and P. Simon, Science, 2008, 321, 651–652 CrossRef CAS PubMed.
  10. E. Faggioli, P. Rena, V. Danel, X. Andrieu, R. Mallant and H. Khalen, J. Power Sources, 1999, 84, 261–269 CrossRef CAS.
  11. B. E. Conway, Electrochemical Supercapacitors: Scientific fundamentals and Technological Applications, Kluwer Academic/Plenum Publishers, New York, 1999 Search PubMed.
  12. L. L. Zhang and X. S. Zho, Chem. Soc. Rev., 2009, 38, 2520–2531 RSC.
  13. A. Bruke, J. Power Sources, 2000, 91, 37–50 CrossRef.
  14. K. Zhang, L. L. Zhang, X. S. Zhao and J. Wu, Chem. Mater., 2010, 22, 1392–1401 CrossRef CAS.
  15. Y. F. Ke, Y. S. Tsai and Y. S. Huang, J. Mater. Chem., 2005, 15, 2122–2127 RSC.
  16. J. Chen, K. Huang and S. Liu, Electrochim. Acta, 2009, 193, 935–938 Search PubMed.
  17. C. M. Chaung, C. W. Huang, H. Tng and J. M. Ting, Energy Fuels, 2010, 24, 6463–6467 CrossRef.
  18. P. G. Bruce, B. Scrosati and J. M. Tarascon, Angew. Chem., Int. Ed., 2008, 47, 2930–2946 CrossRef CAS PubMed.
  19. P. Poizot, S. Lauruelle, S. Grugeon, L. Dupont and J. M. Tarascon, Nature, 2000, 407, 496–499 CrossRef CAS PubMed.
  20. J. Chen, L. N. Xu, W. Y. Li and X. L. Gou, Adv. Mater., 2005, 17, 582–586 CrossRef CAS.
  21. W. Y. Li, L. N. Xu and J. Chen, Adv. Funct. Mater., 2005, 15, 851–857 CrossRef CAS.
  22. X. Zhao, C. Johnston and P. S. Grant, J. Mater. Chem., 2009, 19, 8755–8760 RSC.
  23. K. Xie, J. Li, Y. Lai, W. Lu, Z. Zhang, Y. Liu, L. Zhou and H. Huang, Electrochem. Commun., 2011, 13, 657–660 CrossRef CAS PubMed.
  24. M. B. Sassin, A. N. Mansour, K. A. Pettigrew, D. R. Rolison and J. W. Long, ACS Nano, 2010, 4, 4505–4514 CrossRef CAS PubMed.
  25. S. C. Yu, J. S. Lee, S. F. Tung and C. L. Lan, J. Geol. Soc. China, 1999, 42, 349–358 CAS.
  26. V. Srinivasan and J. W. Weidner, J. Electrochem. Soc., 2000, 147, 880–885 CrossRef CAS PubMed.
  27. S. K. Meher and G. R. Rao, ACS Appl. Mater. Interfaces, 2011, 3, 2063–2073 CAS.
  28. R. Y. Hong, B. Feng, L. L. Chen, G. H. Liu, H. Z. Li, Y. Zheng and D. G. Wei, Biochem. Eng. J., 2008, 42, 290–300 CrossRef CAS PubMed.
  29. A. Carpov and G. G. Bumbu, Cellulose Chem. Technol., 2000, 34, 451–455 Search PubMed.
  30. D. L. A. de Faria, S. Venauncio Silva and M. T. de Oliveira, J. Raman Spectrosc., 1997, 28, 873–878 CrossRef CAS.
  31. A. C. Ferrari, J. C. Meyer, V. Scardaci, C. Casiraghi, M. Lazzeri, F. Mauri, S. Piscanec, D. Jiang, K. S. Novoselov, S. Roth and A. K. Geim, Phys. Rev. Lett., 2006, 97, 187401–187404 CrossRef CAS.
  32. K. S. W. Sing, Pure Appl. Chem., 1982, 54, 2201–22l8 CrossRef.
  33. F. Rouquerol, J. Rouquerol and K. Sing, Adsorption by powders and porous solids: Principles, Methodology and Application, Academic Press, London, 1999 Search PubMed.
  34. J. W. Lee, T. Ahn, J. H. Kim, J. M. Ko and J. D. Kim, Electrochim. Acta, 2011, 56, 4849–4857 CrossRef CAS PubMed.
  35. X. Xia, Q. Hao, W. Lei, W. Wang, D. Sun and X. Wang, J. Mater. Chem., 2012, 22, 16844–16850 RSC.
  36. R. Shah, X. F. Zhang and S. Talapatra, Nanotechnology, 2009, 20, 395202–395204 CrossRef PubMed.
  37. J. Li, W. Zhao, F. Huang, A. Manivannan and N. Q. Wu, Nanoscale, 2011, 3, 5103–5109 RSC.
  38. Y. Zhang, G. Li, Y. Lv, L. Wang, A. Zhang, Y. Song and B. Huang, Int. J. Hydrogen Energy, 2011, 36, 11760–11766 CrossRef CAS PubMed.
  39. T. Morishita, Y. Soneda, H. Hatori and M. Inagaki, Electrochim. Acta, 2007, 52, 2478–2484 CrossRef CAS PubMed.
  40. Y. G. Wang and Y. Y. Xia, J. Electrochem. Soc., 2006, 153, A450–454 CrossRef CAS PubMed.
  41. M. S. Wu, R. H. Lee, J. J. Jow, W. D. Yang, C. Y. Hsieh and B. J. Weng, Electrochem. Solid-State Lett., 2009, 12, A1–A4 CrossRef CAS PubMed.
  42. M. S. Wu and R. H. Lee, J. Electrochem. Soc., 2009, 156, A737–A743 CrossRef CAS PubMed.
  43. D. Wang, Q. Wang and T. Wang, Nanotechnology, 2011, 22, 135604–135615 CrossRef PubMed.
  44. J. F. Zang, S. J. Bao, C. M. Li, H. J. Bian, X. Q. Cui, Q. L. Bao, C. Q. Sun, J. Guo and K. Lian, J. Phys. Chem. C, 2008, 112, 14843–14847 CAS.
  45. D. Liu, Q. Wang, L. Qiao, F. Li, D. Wang, Z. Yang and D. He, J. Mater. Chem., 2012, 22, 483–487 RSC.

Footnote

Electronic supplementary information (ESI) available: TG-DTA curve of as prepared sample (Fig. S1) and XRD pattern of Fe2O3/C composite prepared at 300 °C (Fig. S2). See DOI: 10.1039/c3ra45025b

This journal is © The Royal Society of Chemistry 2014
Click here to see how this site uses Cookies. View our privacy policy here.