DOI:
10.1039/C3RA43787F
(Paper)
RSC Adv., 2013,
3, 20800-20810
Chemical modification, characterization, and application of chicken feathers as novel biosorbents
Received
19th July 2013
, Accepted 20th August 2013
First published on 21st August 2013
Abstract
The current work exclusively pertains to preparing arsenic removing biosorbents using chicken feathers (CF) as a raw material. CF consist of keratinous proteins with many functional groups, and this paper contributes to the debate on how functional groups, especially –COOH, –NH2 and –S–S–, interact with arsenic species before and after their modification through sorption phenomena. Chemically modified CF biosorbents were investigated regarding their ability to remove As(III) from water. The modification results suggest that reactions occur mainly on the surface with noticeable changes on reactive sites in the interior of the modified chicken feathers (MCF). To prepare the modifications labelled as MCF-I and MCF-II, the feathers were treated with aqueous NaOH and sodium sulfite, respectively, to change their structure and morphology. Then, maleimide terminated poly(N-isopropylacrylamide) (PNIPAM) was added to the reaction mixture to enhance the mass and reactivity of the biosorbents. However, MCF-I and MCF-II displayed a relatively low sorption capacity (≥25–50%) for the removal of arsenic, but a higher capacity than raw CF. The methyl alcohol supported modification MCF-III, on the other hand, exhibited a significant performance in segregating negatively charged arsenic species from water. Therefore, esterified carboxylic groups (–COOH) in keratin were identified as particularly effective promoters of the arsenic uptake. Around 80–90% sorption capacity was observed within the first hour of contact between the MCF-III biosorbent and arsenic polluted water. Characterizations such as FTIR, XRD, DSC, TGA and SEM supported the modification of chicken feathers and the subsequent effect of this modification on the sorption, particularly when MCF-III was applied as a biosorbent. The role of pH was highly significant for changing the surface behaviour, and high uptake was observed at low pH for MCF-I, MCF-II and MCF-III. The kinetics of the biosorption capacities of CF, MCF-I, MCF-II and MCF-III were also evaluated and compared at different pH. The experimental kinetic data for MCF-III at variable pH followed pseudo second order model fits and are typical for chemisorption. Similarly, the Freundlich isotherm model supports our data with a high correlation value (R2) and demonstrates both monolayer and multilayer biosorption.
Introduction
Arsenic and its compounds are extremely fatal and carcinogenic to all living organisms. Arsenic in exceeding amounts, once ingested, can cause severe nausea and gastrointestinal symptoms, and thus, the toxicity of arsenic is an established and scientific fact.1,2 During glycolysis, due to the chemical analogy with phosphate, arsenate As(V) reacts with glyceraldehyde 3-phosphate, eliminating 1,3-diphosphoglycerate formation and preventing ATP generation, leading to several adverse effects to living organisms.2–4 As(III), on the other hand, has a tendency to bind to the sulfhydryl (–SH) groups of dehydrogenase enzymes, i.e. pyruvate, dihydrolipoate and α-ketoglutarate, causing severe metabolic complications, and at times, cellular mutagenesis.5 Arsenic is naturally found on the Earth's crust, mostly in the common mineral arsenopyrite (FeAsS).3 The arsenic concentration in soil may vary from 1.0 mg kg−1 (apatite, calcite and fluorite samples) to 77 000–126 000 mg kg−1 (pyrite or arsenopyrite samples).6 Chemical industries, especially those related to electronic devices,7,8 use small amounts of arsenic and its compounds to manufacture components for cosmetics, wood preservatives, laser equipment, pesticides and glasses. Mineral and metallurgical industries contribute to arsenic containing wastes. The contaminated solid and liquid waste is a potential source of surface and groundwater pollution. Arsenic contaminated groundwater has been reported worldwide, and especially Canada, the USA, Chile, Argentina, India and Bangladesh are places where the natural leaching of As-enriched soil and rock has been the main cause of arsenic contamination.3,6,7 India and Bangladesh are worst in terms of high levels of arsenic contamination affecting thousands of people in South Asia.9–11 Statistical data show that more than 25 million people have been exposed to water with elevated arsenic concentrations, i.e. ≥50 μg L−1 in Bangladesh and the West Bengal province of India.12 The variable oxidation state of arsenic species influences its stability and immobilization in natural environments or under rectifying measures. It mainly exists in two water soluble oxidation states of As(III) and As(V) derived from arsenous acid (H3AsO3) and arsenic acid (H3AsO4), respectively. Of these two states, As(III) not only shows considerably higher toxicity and solubility in water but is also important with regard to its increased mobility in soils. Arsenical mobility in natural waters is dependent on the pH, Eh conditions and presence of other chemical species.6 It has been determined experimentally that the oxidation of As(III) to As(V) is kinetically very slow, which results in the co-existence of both species even under oxic conditions.13 Bacterial activity causes the reduction of As(V) species, which causes toxicity in biological environments.1,14 Apart from inorganic forms, arsenic also exists as organic species such as dimethyl arsenic acid at very low concentrations in natural waters.15
Over the years, conventional technologies based on coagulation, flocculation, reverse osmosis, ion exchange, precipitation and surfactant enhanced ultrafiltration have been developed to remove arsenic from natural waters.16–23 These processes have, however, numerous drawbacks, which include selective or partial metal removal, and high capital and operational cost with increased disposal of residual metal sludge, making them unsuitable and unsustainable for small scale industries. Adsorption techniques have long been used in water and waste water industries, but the real challenge in such techniques is the employment of inexpensive, excessively available and effective adsorbents. More commonly, powdered or granular activated charcoal or alumina (Al2O3), and more recently nanoscale zero-valent iron particles, have been employed as adsorbents to remove arsenic species from an aqueous stream.24–27 However, the high price for the preparation and regeneration of these adsorbents encouraged the application of biosorbents for arsenic removal from water. An unspecific ion exchange reaction mechanism is usually involved in the biosorption uptake. For instance, negatively charged arsenate or arsenite species are potentially attracted by reactive sites of amino groups to form adsorptive complexes.28 The continuous and sustainable growth of the poultry industry and an ever increasing demand for poultry consumption is leading to an oversupply of byproducts. The efficient utilization of byproducts is a challenge, but one which is extremely important to overcome with this crucial worldwide industrial waste. It is estimated that over 65 million tonnes of feather waste are produced worldwide.29–31 Poultry feathers contain about 90% protein (keratin) and are a cheap and renewable source of protein fibers. There is very limited use of feathers in industrial applications. At present, in addition to animal feed32 and a few applications in composites and other products,33,34 the majority of the poultry feathers are disposed of in landfills. Recently, researchers employed chicken feathers to remove organic dyes and heavy metal ions from wastewaters on account of their high surface area and several reactive functional groups.35–40 Adsorption results show that after chemical modification, CF have a higher dye/ion uptake as compared to their unmodified form.38 We studied structural changes during modification and exclusively extended the use of modified CF by designing arsenic removal filters. Chemically, several modifications of CF were generated by treatment with different doping agents. The extent of modification of the filter containing material was evaluated by characterization techniques such as SEM, FTIR, DSC, TGA and XRD, and the adsorption efficiency was evaluated using kinetic and isothermal studies of the biosorption.
Experimental section
Materials
The analytical grade reagents sodium arsenite solution (Fluka, 0.05 M), sodium sulphite (Sigma-Aldrich, ≥98%, MW = 125.04 g mol−1), hydrochloric acid (Sigma-Aldrich, 37%), sodium hydroxide (Sigma-Aldrich, ≥97% pellets, MW = 40 g mol−1), ethylenediaminetetra-acetic acid (EDTA, Sigma-Aldrich, 99%, MW = 292.24 g mol−1), urea (Fisher, 99% assay, FW = 60.06), tris (hydroxymethyl) aminomethane base (Fisher, FW = 121.14 white crystals), and maleimide terminated poly(N-isopropylacrylamide) (M-PNIPAM, Sigma-Aldrich, Mn ∼ 5000) were used as received.
Feather processing
The CF supplied by the Poultry Research Center of the University of Alberta were washed several times with soapy hot water. The washed feathers were dried by spreading them in a closed fume hood for one week to evaporate the water and thereafter, they were kept in a ventilated oven for 24 h at 50 °C to completely remove the remaining moisture. The hollow shaft, calamus, was trimmed from the vane of the CF with a pair of scissors. The processed CF were ground using a Fritsch cutting mill (Pulverisette 15, Laval Lab. Inc., Laval Canada) with a sieve insert size of 0.25 mm. The batches of ground CF (30 g each) were further treated in a Soxhlet (extraction tube with 50 mm internal diameter) for 5 h with 250 mL of petroleum ether. After evaporating the petroleum ether, the dried CF were stored in a desiccator at room temperature until they were used for the experimental work.
Modification of chicken feathers
The chemical modification of the CF was carried out by keeping in mind three important functional groups in keratinous protein such as sulfhydryl (SH) groups from reduced disulfide (–S–S–) linkages, amino groups (–NH2) and carboxylic groups (–COOH), and accordingly, we divided our experimental work into three types of modifications i.e. MCF-I, MCF-II, MCF-III.
Treatment with alkaline aqueous solution (MCF-I)
The CF (10 g) were added to 100 mL of a 0.1 M L−1 aqueous NaOH solution and the mixture was stirred at 200 rpm at 70 °C for four hours. After cooling the mixture to room temp, the pH was maintained at 7.5 and then the desired amount of NIPAM was added to the reaction mixture in an inert atmosphere under a stream of N2 gas. The reaction mixture was left overnight. The modified material was filtered, washed with distilled water, dialysed for 48 hours using a dialysis membrane with a molecular weight cut off (MWCO) at 8000 to remove any unreactive contents, and then freeze dried to remove the water.
Sodium sulfite supported modification (MCF-II)
0.5 g of Na2SO3 were added to a mixture of 100 mL water containing 10 g CF, 10% by volume of each EDTA and tris base in the presence of urea in a double necked flask equipped with a magnetic stirring bar. The reaction mixture was stirred for about 4 hours at 40 °C. The mixture was cooled to room temperature and the pH was maintained at 9.00. NIPAM was added slowly to the flask after deoxygenating it with nitrogen gas. The reaction mixture was left for 24 hours at room temperature and constant stirring at 100 rpm. The CF solution was washed with water and submitted to dialysis. The dialysis was performed at room temperature over 48 hours using a dialysis membrane (MWCO 8000) and freeze dried.
Treatment with methyl alcohol (MCF-III)
In this modification, we used 10 g CF, 6% (v/v) CH3OH and 2% (v/v) HCl in a 250 mL closed double necked flask and placed it on a heating plate at 80 °C with a 150 rpm stirring rate for five hours. The reaction mixture was filtered, washed with distilled water and subjected to dialysis followed by lyophilisation for three days.
Characterizations
FTIR spectra of both the modified and unmodified samples of solid feathers in KBr pellets were recorded with a Thermo Nicolet 750, Madison, WI, USA. All spectra were collected over a frequency range of 4000–650 cm−1, 32 scans and 4 cm−1 resolution by averaging of two replicate measurements for each sample. The Thermo Scientific OMNIC software package (version 7.1), and second derivative spectra were obtained to support the initial identification of band positions. The band positions obtained from the above steps were then used as the initial guess for curve-fitting of the original spectra with Gaussian bands. DSC analysis of all samples was carried out under a continuous nitrogen purge on a Perkin-Elmer (Pyris 1, Norwalk, CT, USA) calorimetric apparatus. A sample of pure indium was used for the heat flow and temperature calibration of the instruments. A temperature range of 25–250 °C at 10 °C was set for the DSC analysis of all samples. TGA was performed on a Perkin-Elmer (Pyris 1, Waltham, MA, USA) thermogravimetric analyzer in a temperature range of 25–600 °C, at heating rate of 10 °C min −1 under a nitrogen atmosphere. X-ray powder diffraction patterns were recorded using a Rigaku Ultima IV, Geigerflex Powder Diffractometer with Cu-Kα radiation (λ = 0.154 nm). Scanning electron microscopy (SEM) images were scanned with a Philips-FEI model Quanta 20. For easier comparison, intensities were normalized in all spectra at 10°, and the spectra are offset.
Batch sorption experiments
In a batch process, each modified biosorbent (MCF-I, MCF-II and MCF-III) was employed besides the untreated chicken feathers (CF) to assess the “As(III)†removal efficiency of the prepared material. Aqueous arsenic solutions with concentrations in the range of 100–800 μg L−1 were prepared by diluting 0.05 M NaAsO2. The tests were conducted by using 1.0 g of each modified biosorbent in a flask containing 100 mL of an aqueous solution of arsenic with a predetermined concentration. Each sorption experiment was run for ten minutes and the suspensions were agitated in a shaker at 20 °C and finally filtered. Untreated chicken feathers were tested in the batch experiments as well. The residual arsenic concentrations in the filtrates were determined by a Perkin Elmer Elan 6000 quadrupole ICP-MS. The instrumental conditions were as follows: RF power of 1200 W, dual detector mode, blank subtraction applied subsequent to internal standard correction, measurement units cps (counts per second), auto lens on, four points calibration curve (0, 0.005, 0.010, and 0.020 ppm for As), typical count rate for a 10 ppb arsenic (As) solution: 150 000–200 000 cps. The sample uptake rate was approximately 1 mL min−1 with 35 sweeps per reading, 1 reading per replicate and 3 replicates. The dwell times were 100 ms for As. The relative standard deviation for As is between 5 and 10% of the reading.
The sorption capacity (q) (μg g−1) of the biosorbents was calculated from the initial concentration (Ci) (μg L−1), and the final concentration (Cf) (μg L−1) of the arsenic metalloid in solution was calculated according to the following equation:41
where “
V†is the volume of the solution (L) and “
m†is the dry mass of the biosorbent (g).
Adsorption kinetics
The anticipation of the kinetics is essential for designing sorption systems and determining factors responsible for the rate of reaction. The nature of the sorption process depends on the physicochemical properties of the sorbent, the experimental conditions, and the solution pH. In batch sorption phenomena, the adsorbate molecules diffuse into the interior of porous biosorbents. We studied the pseudo first and second order models of kinetics. The pseudo first order equation gives the adsorption in solid–liquid systems depending on the sorption capacity of solids.42 In this model, it is assumed that one arsenic species, i.e. the adsorbate, occupies one sorption site of the tested MCF:| |
 | (2) |
where A represents an unoccupied adsorption site on CF or the MCFs and k1 is the rate constant in the pseudo first order kinetic model whose linear form can be expressed as:| |
 | (3) |
where qe, qt (μg g−1) are the sorption capacities of the biosorbents at equilibrium and time t (h), respectively. Similarly, the pseudo second order rate expression which is applied to assess the chemisorption kinetics from liquid solution43,44 and its mathematical linear form equation is as follows:| |
 | (4) |
where k2 (g μg−1 h−1) is the rate constant for the pseudo second order adsorption and k2qe2 or h (μg g−1 h−1) is the initial adsorption rate. In this model, it is assumed that each sorbate species covers two sorption sites at the surface of the biosorbent:| |
 | (5) |
Adsorption isotherm models
An adsorption isotherm model describes the partitioning of sorbate molecules between the liquid and solid phases at equilibrium. The adsorption of an arsenic metalloid by CF and the MCFs was justified according to the Freundlich and Langmuir models in this study. The Freundlich model is applicable to both monolayer (chemisorption) and multilayer adsorption (physisorption), assuming that the surface of the biosorbents is heterogeneous.45 The linear form of this model is expressed as:| |
 | (6) |
where “KF†and “n†are Freundlich isotherm constants pertaining to the sorption capacity and intensity, respectively, whereas Ce (μg L−1) is the equilibrium concentration of the sorbed As(III) species.
The Langmuir adsorption model, on the other hand, assumes monolayer adsorption on a uniform surface with a finite number of adsorption sites. According to this model, once the surface site is filled, no further sorption can take place at that specific site, leading to a surface saturation phenomenon. The linear form of this model is described as:
| |
 | (7) |
where “
KL†is the Langmuir constant related to the sorption energy and
qm (μg g
−1) is the maximum adsorption capacity.
46
Results and discussion
The chemical modification of chicken feathers was carried out with PNIPAM under different reaction conditions and with methanol as shown in Scheme 1. Reactions of maleimides with thiols47,48 and amines49,50 are well known. The double bonds of maleimide react specifically with thiols in the pH range of 6.5–7.5, resulting in the formation of a stable thioether linkage that is not reversible. However, at more alkaline pH values (pH > 8.5), its reaction with amines becomes more evident and also increases the rate of hydrolysis of the maleimide group.51,52
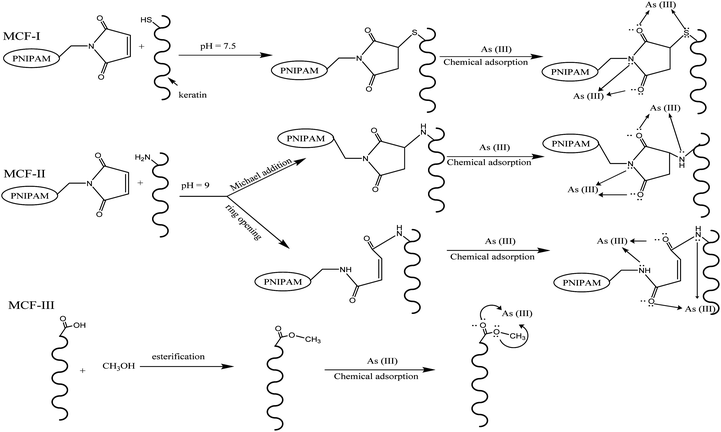 |
| | Scheme 1 General routes of possible reactions for different modifications (MCF-I, MCF-II, and MCF-III) of feather keratin and the adsorption of As(III). | |
X-ray diffraction analysis
To investigate the crystallinity, XRD-patterns of untreated CF and modified chicken feathers were studied. As shown in Fig. 1, the CF have a typical pattern with a prominent 2θ peak at 9.9° that corresponds to the α-helix configuration, and the more intense band at 19° is indexed to its strand secondary structure.8 The modifications prepared with NaOH and Na2SO3 and then jointly reacted with NIPAM give peaks with reduced intensity and a mild shift in values of 2θ. The decrease in intensity at 19° is attributed to the decrease in the β sheet content as compared to neat feathers. In addition, the decrease of intensity in the peak at 9.9° and the appearance of a shoulder at 10.70 also suggests the fracture of the α-helix network. This strengthens the idea of the disruption of both the α-helix and the β-sheet content in the modified keratin material. However, there is a noticeable difference between the untreated chicken feathers and the MCFs, especially the appearance of new crystallinity peaks suggesting the formation of other crystalline patterns at a greater angle, e.g. at 2θ = 28.2° in the sample that was chemically treated with methyl alcohol.
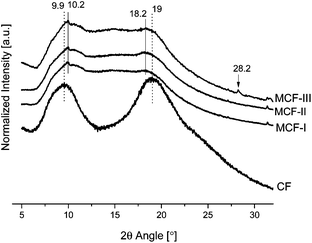 |
| | Fig. 1 XRD patterns of CF, MCF-I, MCF-II, and MCF-III. | |
Fourier transform infrared spectroscopy (FTIR)
In Fig. 2, the IR spectra of NIPAM, neat feathers and the modified biosorbents are presented. The neat feathers and the biosorbents exhibit typical amide vibrations including amide A (N–H stretching), amide I (Cî€O stretching, with a minor contribution from N–H bending and C–N stretching, 1600–1700 cm−1), amide II and amide III (N–H bending and C–N stretching, at around 1540 and 1240 cm−1, respectively). Significant changes can be seen in the amide A region of the modified feathers. A broad absorption band of neat chicken fiber keratin (CF) appearing at 3416 cm−1 is mainly due to hydrogen bonded N–H stretching vibrations,53 as the peptide N–H groups form hydrogen bonds with amide Cî€O groups in the native secondary structure. A shift in this band towards lower wavenumbers in the modified materials (MCF-I, MCF-II, and MCF-III) was observed. This shift to lower wavenumbers can be attributed to the disruption of the hydrogen bonds of the amide groups by the modifications. In addition, the appearance of the peak at 936 cm−1 is assigned to the C–S bond stretching vibration in MCF-I. In MCF-II, the disappearance of the peak intensity at 1133 and 1367 cm−1 is generally assigned to the asymmetric and symmetric C–N–C stretching of maleimide,54,55 which indicates the ring opening of the maleimide group.
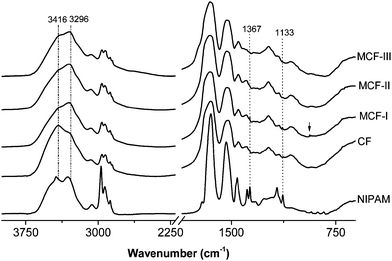 |
| | Fig. 2 FTIR spectra of CF, MCF-I, MCF-II and MCF-III. For CF, MCF-I, MCF-II and MCF-III, the intensities are normalized at 3200 cm−1. The spectra are offset, and curves are shifted vertically for clarity. | |
The modifications were further confirmed by the changes in the amide I region of the FTIR spectrum (Fig. 3). Among all the amide bands of the backbone peptide groups in the proteins, the most intense and the most widely used one is the amide I band. This band arises mainly from the Cî€O stretching vibration of the amide carbonyl group, which is weakly coupled with the in-plane N–H bending and the C–N stretching vibration and appears in the region between ≈1700 and 1600 cm−1. Significant changes can be seen in the amide I region of the neat feathers and modified materials. A shift in the peak at 1642 cm−1 (assigned to the β-sheet structure)56 towards higher wavenumbers was observed in all modifications, suggesting the disruption of the β-sheet structure. Particularly, in the case of the modification with alcohol (MCF-III), the peak becomes sharp at 1653 cm−1, suggesting the formation of random coils57 at the expense of the α-helices and β-sheets present in the native feathers. In addition to significant changes in the amide I region, the appearance of a distinct peak at 1738 cm−1 in the methanol modified (MCF-III) material is due to the Cî€O stretching absorption of the carbonyl group, in the characteristic absorption range (1750–1735 cm−1) for aliphatic esters.
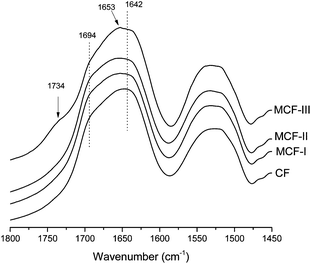 |
| | Fig. 3 FTIR spectra of the amide I region for CF, MCF-I, MCF-II and MCF-III. For easier comparison, intensities are normalized in all spectra at 1640 cm−1. The spectra are offset, and curves are shifted vertically for clarity. | |
The amide I region is most often used for secondary structure characterizations. However, due to overlapping peaks and interference of water vibrational bands, the use of the amide III vibration is suggested for more accurate analysis of the protein secondary structure.58 Therefore, to further elucidate the secondary structure of modified keratin, the amide III region (1350–1200 cm−1) was employed. For the enhancement of the resolution, techniques such as the second derivative can be used to locate the positions of individual amide III bands. This technique can be used as a sensitive diagnostic tool in locating the positions of bands in the secondary structure. We used the second derivative technique to locate the exact position of different peaks in the amide III region. The amide III peaks of neat feather keratin and modified keratin identified by the 2nd derivative were further resolved by fitting of Gaussian bands (Fig. 4A–D). The secondary structures were assigned according to the literature as α-helix (1330–1295 cm−1), β-turn (1295–1270 cm−1), random coil (1270–1250 cm−1) and β-sheet (1250–1220 cm−1).8,58 Clear differences in the resolved amide III bands of the modified keratins MCF-I, MCF-II and MCF-III (Fig. 4B–D, respectively) and native feather keratin CF (Fig. 4A) can be seen. Both β-sheet and α-helix contents decreased, and the unordered structures (random coils) increased after modification, particularly in the MCF-III modification (Fig. 4D), in agreement with the X-ray diffraction observations.
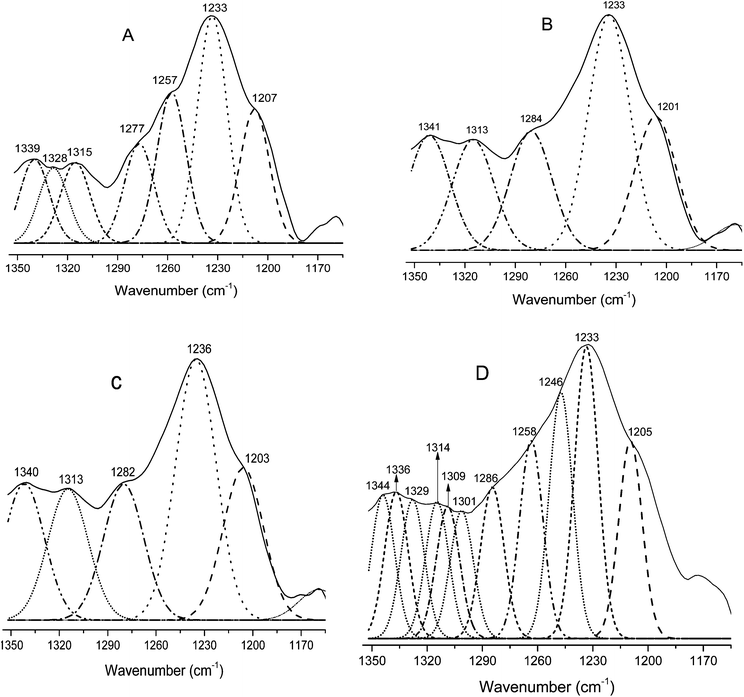 |
| | Fig. 4 Resolved amide III regions of pure feather keratin CF (A) and the modified keratins MCF-I (B), MCF-II (C) and MCF-III (D). | |
Differential scanning calorimetry (DSC)
The phase behavior of the prepared material was studied by DSC. The DSC trace for raw CF has higher heat flow values as compared to MCF. Typical heat flow curves are shown in Fig. 5 for all four samples labelled as CF, MCF-I, MCF-II and MCF-III. A low temperature broad peak near 100 °C is indicative for the evaporation of residual moisture/denaturation of the protein. A significant change in both denaturation curves can be seen after modification, particularly for MCF-III, which shows a distinctively different behavior with broader denaturation, suggesting a wide range of structural changes due to modification. The DSC of untreated CF shows an exothermic peak at <230 °C, which is usually assigned to α-helix disordering and decomposition. However, in the modified chicken feather materials, particularly MCF-I and MCF-III, this peak was broadened and shifted to comparatively lower temperatures.59 These observations suggest the loss of α-helix structures and gain of amorphous behavior in all modified material, especially MCF-III, marked with a broadened melting curve trend.
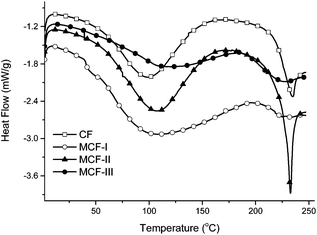 |
| | Fig. 5 DSC heat flow signals of CF, MCF-I, MCF-II, and MCF-III. | |
Thermogravimetric analysis (TGA)
The thermal properties of untreated CF and MCF were investigated by TGA as shown in Fig. 6. The TGA curves as a function of temperature of the CF and MCF show decomposition in the temperature range of 250–380 °C. The curves for untreated CF and MCF-I,II show virtually identical behavior of decomposition in contrast to the methanolic modification MCF-III, indicating that the esterification of the protein has taken place, which brought thermal stability. At this juncture, a total weight loss of ca. 90% was observed. The absorbed water decomposed below 130 °C for CF and MCF-I,II with an observable difference in the case of MCF-III. Obviously, it indicates that the alkaline and sodium sulfite treated modifications did not improve the thermal stability of the composed material and followed the TGA trend of untreated CF. Nevertheless, distinctively different TGA behavior of MCF-III in terms of decomposition and weight loss is useful for the sorption phenomenon. The chemical changes on the surface of the developed material MCF-III is consistent with our high arsenic uptake as discussed in this sorption study.
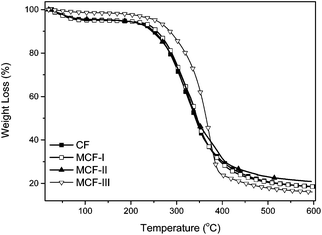 |
| | Fig. 6 TGA curves of CF, MCF-I, MCF-II, and MCF-III. | |
Adsorption of arsenic As(III) by MCFs
The pH effect on the arsenic uptake. We modified three types of biosorbents such as MCF-I, MCF-II and MCF-III and conducted their kinetic study at variable pH i.e. 4, 7 and 12. As shown in Fig. 7, the change in pH during the course of modification has a significant effect on the arsenic uptake. The maximum uptake was obtained at an acidic pH of 4 for all types of modifications, MCF-I, MCF-II, MCF-III, and untreated CF. The keratin used in this study consists of amines and carboxyl groups which are protonated or deprotonated depending on the pH of the solution. The surface complexation theory suggests that a low pH is responsible for increasing the positive charge of the surface whose impact can be seen in terms of high sorption of negatively charged arsenic species such as H2AsO4−, HAsO42−, H2AsO3−, HAsO32− and AsO33− in our case. Thus, it is estimated that the biosorption of arsenic involves an ion-exchange process in which arsenic oxyanions tend to approach positively charged active sites of the biosorbent. With greater pH, the number of positive sites decreases with an increase in the number of negatively charged arsenic species, and thus, a low uptake is observed as shown in Fig. 7. Moreover, the increase in sorption capacity for arsenic at low pH can also be explained by changes in the nature of arsenic complexation, charge density, solubility and degree of hydrolysis.60,61 The order of higher arsenic uptake regarding the pH for different modifications is: acidic > neutral > basic.
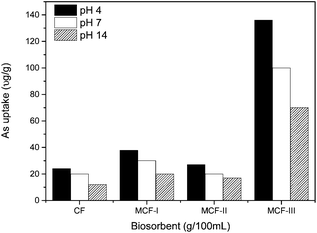 |
| | Fig. 7 As(III) uptake of CF, MCF-I, MCF-II, and MCF-III at different pH values and at 20 °C temperature. | |
Effect of modification on the arsenic uptake. We chemically modified different functional groups of keratin protein extracted from CF and examined the arsenic uptake. It was determined experimentally that MCF-III, as a result of the esterification of –COOH functional groups, had a maximum arsenic uptake of 85–90% at an acidic pH 4 compared to MCF-I, MCF-II and CF. The high arsenic uptake of MCF-III suggests that ionized carboxyl groups in keratin protein play an inhibitory role in As(III) and As(V) adsorption.62 Another biosorbent, MCF-I treated with NaOH, showed lower levels of arsenic uptake of 54% at pH 4. This indicates that the disulfide in cysteine protein was not fully reduced and thus remained unreactive with dopant PNIPAM which was added to perform a click reaction between the double bond of the PNIPAM ring and the reduced thiol (–SH) of the disulfide (–S–S–) peptide linkage in the cysteine molecule. The observed uptake i.e. 54% is due to the surface as well as the chemical modification of the protein. Similarly, the uptake of the sodium sulfite treated modification (MCF-II) is not significantly high on account of poor reduction, and thereby the low availability of reactive sites for added PNIPAM to make a larger molecule for efficient sorption. Thus, MCF-I performed an arsenic uptake of merely 24% under acidic conditions of the sorption process. The arsenic uptake profile of untreated CF and MCF is shown in Fig. 8.
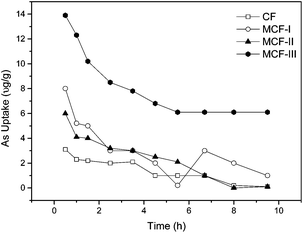 |
| | Fig. 8 The As(III) sorption kinetics of 0.1 g L−1 of CF, MCF-I, MCF-II, MCF-III for concentrations of 200 μg L−1 of sodium arsenite solution at 20 °C. | |
Kinetics of arsenic adsorption. The adsorption kinetics of arsenic were studied for both the modified chicken feathers (MCF) and untreated CF at neutral pH 7 with initial concentrations of 200 μg L−1 As(III) metalloid. However, kinetic data modelling was performed using our most effective modified material, MCF-III, at three variable pH values of 4, 7 and 12. As illustrated in Fig. 8, within the first 30–40 minutes, MCF-III followed by MCF-I, MCF-II and untreated CF attained equilibrium quickly. Thereafter, in all cases, the uptake decreases gradually, and finally, a steady trend was observed after 8–10 hours at the adjusted pH of 4. The rapid attainment of the equilibrium and its smooth fall suggest that the exposed functional groups, particularly the carboxylic sites of MCF, are esterified, causing the depression of negative charges on the surface that favors quick uptake. Due to low pH, more hydrogen ions in solution, nonetheless, promote the protonation of negatively charged arsenic species, resulting in low uptake i.e. (H2AsO3− + H+ → H3AsO3; H2AsO4 + H+ → H3AsO4).62 To evaluate the kinetics of the adsorption process, the pseudo first order and pseudo second order models were tested for interpreting the experimental data.
Pseudo first order kinetics. The rate constant k1 and qe were calculated using the slope and intercept of plots of log(qe − qt) versus the time t (Table 1). The best fit lines at each pH value yielded relatively low correlation coefficients R2. A close inspection of the experimental observation and the model fit in Fig. 9(A) suggests that eqn (3) is not appropriate because of a non-linear trend of the experimental data. In addition, a poor agreement between the experimentally observed equilibrium and that derived using eqn (4) is another reason that the biosorption of arsenic does not follow pseudo first order kinetics. It further implies that, in the sorption phenomenon, one arsenic species covers more than one sorbent site of the modified material.
Table 1 Adsorption kinetic model rate constants for As(III) adsorption on MCF-III at 20 °C
| pH |
Pseudo first order |
Pseudo second order |
| k 1 (h−1) |
q e.cal (μg g−1) |
R 2 |
k 2 (g μ−1 h−1) |
q e.cal (μg g−1) |
h (μg g−1 h−1) |
R 2 |
| 4 |
0.138 |
2.89 |
0.76 |
0.25 |
5.58 |
7.81 |
1.00 |
| 7 |
0.124 |
2.03 |
0.82 |
0.17 |
6.12 |
6.53 |
0.99 |
| 12 |
0.111 |
1.59 |
0.86 |
0.13 |
6.58 |
5.71 |
0.98 |
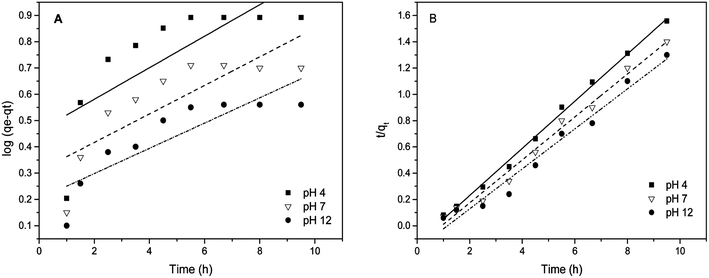 |
| | Fig. 9 (A) pseudo first order kinetic fit and (B) pseudo second order kinetic fit for As(III) sorption on MCF-III at various pH values (4, 7, 12). | |
Pseudo second order kinetics. The pseudo second order parameters qe and k2 were determined from the slope and intercept of the plot of t/qtversus time (t) in eqn (4). The results of the kinetic data modelling reveal that the pseudo second order model explains the rate of biosorption better than the pseudo first order model (see Fig. 9(B)). The correlation coefficients (R2) at pH 4, 7, and 12 for the pseudo second order kinetic model fits are 1.0, 0.99 and 0.98 respectively. These R2 values are higher than for the pseudo first order model fits. Given the good agreement between the experimentally observed biosorption capacity and the model fit besides high values of R2, this suggests that the arsenic biosorption follows pseudo second order kinetics. This type of kinetics, as expected, favors chemisorption46 involving the interaction between trapped arsenic species and exposed functional groups of MCF, especially –COOH, which is consistent with our other characterization results.
Adsorption isotherms. Two famous Freundlich and Langmuir models were selected to fit the experimental data. The equilibrium isotherms for the sorption of As(III) species by MCF-III at pH 4, 7 and 12 were studied at an initial arsenic concentration range of 200–800 μg L−1. The Freundlich isotherm constants KF and n are determined from the intercept and slope of a plot of log qeversus log Ce (Fig. 10A). In this study, the n values are greater than unity giving idea of chemisorption.63 For the tested pH values of 4, 7 and 12, the linear values of R2 ≥ 97 attained by the Freundlich model equation make it the best fit for our experimental data as shown in Table 2. The slope and intercept of the plot of Ce/qeversus Ce at three different pH values were used to calculate qm and KL (Fig. 10B). The Langmuir isotherm parameter fits (Table 2) for the adsorption of arsenic on MCF-III yielded isotherms are in poor agreement with the observed trend (R2 ≤ 97) for pH 4, 7 and 12. The inclination of our isotherm data towards the Freundlich model is indicative of a heterogeneous surface of MCF-III with activated functional groups responsible for both the monolayer (chemisorption) and multilayer (physisorption) type of adsorption in our study. Apart from our study, the Freundlich model also produced a favourable fit to the data compared to the Langmuir model in the adsorption study of N2 gas, nanosilica, nanodiamonds and protein.64
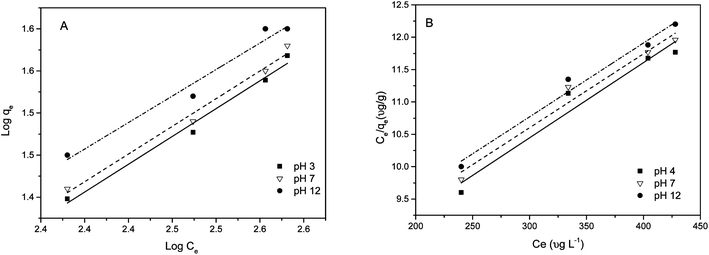 |
| | Fig. 10 Linearized (A) Freundlich and (B) Langmuir isotherms for the arsenic adsorption on MCF-III at different pH at 20 °C. | |
Table 2 Freundlich and Langmuir isotherm model parameters and correlation coefficients for the adsorption of As(III)
| Isotherm |
pH |
Parameters |
| K F |
n |
R 2 |
| Freundlich |
4 |
0.66 |
1.59 |
0.98 |
| 7 |
0.69 |
1.52 |
0.97 |
| 12 |
0.89 |
1.51 |
0.97 |
| Isotherm |
pH |
Parameters |
| K L |
q m |
R 2 |
| Langmuir |
4 |
0.002 |
90.6 |
0.93 |
| 7 |
0.002 |
90.7 |
0.96 |
| 12 |
0.001 |
90.9 |
0.97 |
SEM analysis
Both shape and size of the adsorbent leave an impact on its adsorption capacity.46 The SEM images of the CF and the most effective chemically modified chicken feathers (MCF-III) were studied and are represented in Fig. 11A and C, respectively. As illustrated in Fig. 11A, the untreated feathers have long shafts and barbs and a smooth surface, which is evident in the magnified image of the CF (Fig. 11B). Interestingly, the surface of MCF-III (Fig. 11C) shows shiny patches with higher levels of modification, leading to a completely amorphous structure as shown in the magnified image of MCF-III (Fig. 11E), where the shafts and barbs of the feathers have disappeared and the original structure of the feather could not be identified. In addition, there are some regions where the surface of the feather remains intact with some levels of modification only on the surface. There are some regions of intermediate modification where the feathers have not completely lost their structural integrity but the surface of the feathers have become damaged and rough (Fig. 11D). These observations are in agreement with the changes as evidenced by FTIR and XRD. The structural changes after the modifications may have contributed to the higher sorption properties of the MCF-III in this study. These observations further strengthen and support the theory that the increased arsenic sorption capacity of the biosorbents in contrast to untreated CF may be attributed to heterogeneous microstructures developed after modification. Upon modification, the surface becomes brighter and causes roughness that is the characteristic of increased surface activity compared to CF. These structural changes after modification may have contributed to the higher sorption properties of MCF-III in this study.
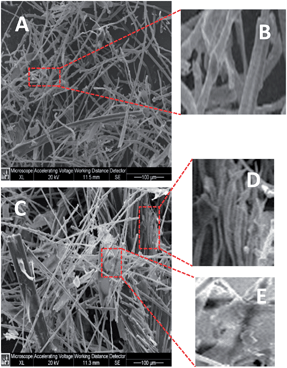 |
| | Fig. 11 SEM Images of pure feather keratin CF (A) with a magnified region (B) and the modified keratin MCF-III (C) with magnifications (D) and (E). | |
Conclusion
Modified chicken feathers can effectively be employed for removing arsenite As(III) species from contaminated water sources. The modification involving esterification showed the highest As(III) uptake on account of the overall anionic charge depression on the surface of the modified feathers. Arsenic oxyanion–biopolymer interaction leads to a rapid equilibrium within the first hour of the biosorption reaction. At the acidic pH 4, the arsenic uptake is increased as a result of protonation making the surface positive overall which facilitates arsenic sorption. The pseudo second order kinetics model accurately described the adsorption and justified our characterization data supporting the fact that chemisorption and physisorption mechanisms are involved. The Freundlich isotherm showed a better fit than the Langmuir isotherm, thus indicating the applicability of multilayer coverage of arsenic species. Results from this study recommend that MCF-III is a very suitable and cost-effective biosorbent for arsenic removal, as anticipated.
Acknowledgements
The financial support of the current work by Grand Challenges Canada (GCC) is gratefully acknowledged.
Notes and references
- F. C. Knowles and A. A. Benson, Trends Biochem. Sci., 1983, 8, 178 CrossRef CAS.
- M. F. Hughes, Toxicol. Lett., 2002, 133, 1–16 CrossRef CAS.
- B. K. Mandal and K. T. Suzuki, Talanta, 2002, 58, 201 CrossRef CAS.
- D. H. Nies, Appl. Microbiol. Biotechnol., 1999, 51, 730–750 CrossRef CAS.
- M. C. Teixeira and V. S. T. Ciminelli, Environ. Sci. Technol., 2004, 39, 895–900 CrossRef.
- P. L. Smedley and D. G. Kinniburgh, Appl. Geochem., 2002, 17, 517–568 CrossRef CAS.
- X. Zhang, X. Liu, M. Zhang, R. A. Dahlgren and M. Eitzel, J. Environ. Qual., 2010, 39, 76–84 CrossRef CAS PubMed.
- W. Zhao, R. Yang, Y. Zhang and L. Wu, Green Chem., 2012, 14, 3352 RSC.
- S. K. Acharyya, P. Chakraborty, S. Lahiri, B. C. Raymahashay, S. Guha and A. Bhowmik, Nature, 1999, 401, 545 CrossRef CAS PubMed.
- R. Nickson, J. McArthur, W. Burgess, K. M. Ahmed, P. Ravenscroft and M. Rahman, Nature, 1998, 395, 338 CrossRef CAS PubMed.
- T. R. Chowdhury, G. K. Basu, B. K. Mandal, B. K. Biswas, G. Samanta, U. K. Chowdhury, C. R. Chanda, D. Lodh, S. L. Roy, K. C. Saha, S. Roy, S. Kabir, Q. Quamruzzaman and D. Chakraborti, Nature, 1999, 401, 545 CAS.
- D. Chakraborti, M. M. Rahman, K. Paul, U. K. Chowdhury, M. K. Sengupta, D. Lodh, C. R. Chanda, K. C. Saha and S. C. Mukherjee, Talanta, 2002, 58, 3 CrossRef CAS.
- R. Weerasooriya, H. J. Tobschall, H. K. D. K. Wijesekara, E. K. I. A. U. K. Arachchige and K. A. S. Pathirathne, Chemosphere, 2003, 51, 1001 CrossRef CAS.
- R. Mukhopadhyay, B. P. Rosen, L. T. Phung and S. Silver, FEMS Microbiol. Rev., 2002, 26, 311–325 CrossRef CAS.
- R. S. Braman and C. C. Foreback, Science, 1973, 182, 1247–1249 CAS.
- V. T. Nguyen, S. Vigneswaran, H. H. Ngo, H. K. Shon and J. Kandasamy, Desalination, 2009, 236, 363–369 CrossRef CAS PubMed.
- T. S. Y. Choong, T. G. Chuah, Y. Robiah, F. L. Gregory Koay and I. Azni, Desalination, 2007, 217, 139–166 CrossRef CAS PubMed.
- V. Fierro, G. Muñiz, G. Gonzalez-Sánchez, M. L. Ballinas and A. Celzard, J. Hazard. Mater., 2009, 168, 430–437 CrossRef CAS PubMed.
- M. F. Hossain, Agric. Ecosyst. Environ., 2006, 113, 1–16 CrossRef CAS PubMed.
- D. Mohan, C. U. Pittman Jr, M. Bricka, F. Smith, B. Yancey, J. Mohammad, P. H. Steele, M. F. Alexandre-Franco, V. Gómez-Serrano and H. Gong, J. Colloid Interface Sci., 2007, 310, 57–73 CrossRef CAS PubMed.
- S. Atkinson, Membr. Technol., 2006, 2006, 8–9 Search PubMed.
- P. Mondal, C. B. Majumder and B. Mohanty, J. Hazard. Mater., 2006, 137, 464–479
CrossRef CAS PubMed.
- H. Sun, L. Wang, R. Zhang, J. Sui and G. Xu, J. Hazard. Mater., 2006, 129, 297–303 CrossRef CAS PubMed.
- A. K. Bhattacharya, S. N. Mandal and S. K. Das, Chem. Eng. J., 2006, 123, 43–51 CrossRef CAS PubMed.
- R. Leyva Ramos, L. A. Bernal Jacome, J. Mendoza Barron, L. Fuentes Rubio and R. M. Guerrero Coronado, J. Hazard. Mater., 2002, 90, 27–38 CrossRef CAS.
- T.-F. Lin and J.-K. Wu, Water Res., 2001, 35, 2049–2057 CrossRef CAS.
- S. R. Kanel, B. Manning, L. Charlet and H. Choi, Environ. Sci. Technol., 2005, 39, 1291–1298 CrossRef CAS.
- F. Veglio and F. Beolchini, Hydrometallurgy, 1997, 44, 301–316 CrossRef CAS.
- A. J. Poole, J. S. Church and M. G. Huson, Biomacromolecules, 2009, 10, 1–8 CrossRef CAS PubMed.
- A. Ullah, T. Vasanthan, D. Bressler, A. L. Elias and J. Wu, Biomacromolecules, 2011, 12, 3826–3832 CrossRef CAS PubMed.
- A. Ullah and J. Wu, Macromol. Mater. Eng., 2013, 298, 153–162 CrossRef CAS.
- P. M. Schrooyen, P. J. Dijkstra, R. C. Oberthur, A. Bantjes and J. Feijen, J. Agric. Food Chem., 2001, 49, 221–230 CrossRef CAS PubMed.
- S. Huda and Y. Yang, J. Polym. Environ., 2009, 17, 131–142 CrossRef CAS.
- M. Bernhart and O. O. Fasina, Waste Manage., 2009, 29, 1392–1398 CrossRef CAS PubMed.
- V. McGovern, Environ. Health Perspect., 2000, 108, a366 CrossRef CAS PubMed.
- V. K. Gupta, A. Mittal, L. Kurup and J. Mittal, J. Colloid Interface Sci., 2006, 304, 52–57 CrossRef CAS PubMed.
- A. Mittal, J. Hazard. Mater., 2006, 133, 196–202 CrossRef CAS PubMed.
- S. Al-Asheh, F. Banat and D. Al-Rousan, J. Clean. Prod., 2003, 11, 321–326 CrossRef.
- S. Al-Asheh, F. Banat and D. Al-Rousan, Adsorpt. Sci. Technol., 2002, 20, 849–864 CrossRef CAS.
- F. Banat, S. Al-Asheh and D. Al-Rousan, Adsorpt. Sci. Technol., 2002, 20, 393–416 CrossRef CAS.
- B. Benguella and H. Benaissa, Water Res., 2002, 36, 2463–2474 CrossRef CAS.
- H. Yuh-Shan, Scientometrics, 2004, 59, 171–177 CrossRef.
- Y.-S. Ho, J. Hazard. Mater., 2006, 136, 681–689 CrossRef CAS PubMed.
- S. Azizian, J. Colloid Interface Sci., 2004, 276, 47–52 CrossRef CAS PubMed.
- C.-h. Yang, J. Colloid Interface Sci., 1998, 208, 379–387 CrossRef CAS PubMed.
- H. K. Boparai, M. Joseph and D. M. O'Carroll, J. Hazard. Mater., 2011, 186, 458–465 CrossRef CAS PubMed.
- B. T. Houseman, E. S. Gawalt and M. Mrksich, Langmuir, 2002, 19, 1522–1531 CrossRef.
- M. Li, P. De, H. Li and B. S. Sumerlin, Polym. Chem., 2010, 1, 854–859 RSC.
- J. V. Crivello, J. Polym. Sci., Polym. Chem. Ed., 1973, 11, 1185–1200 CrossRef CAS.
- J. E. Gambogi and F. D. Blum, Macromolecules, 1992, 25, 4526–4534 CrossRef CAS.
- M. D. Partis, D. G. Griffiths, G. C. Roberts and R. B. Beechey, J. Protein Chem., 1983, 2, 263–277 CrossRef CAS.
- G. T. Hermanson, in Bioconjugate Techniques, Academic Press, New York, 2008, 2nd edn, pp. 169–212 Search PubMed.
- A. Trabocchi, E. G. Occhiato, D. Potenza and A. Guarna, J. Org. Chem., 2002, 67, 7483–7492 CrossRef CAS PubMed.
- B. L. Frey and R. M. Corn, Anal. Chem., 1996, 68, 3187–3193 CrossRef CAS.
- G. Shen, A. Horgan and R. Levicky, Colloids Surf., B, 2004, 35, 59–65 CrossRef CAS PubMed.
- J. Kong and S. Yu, Acta Biochim. Biophys. Sin., 2007, 39, 549–559 CrossRef CAS.
- O. N. Tretinnikov and Y. Tamada, Langmuir, 2001, 17, 7406–7413 CrossRef CAS.
- S. Cai and B. R. Singh, Biophys. Chem., 1999, 80, 7–20 CrossRef CAS.
- A. Idris, R. Vijayaraghavan, U. A. Rana, D. Fredericks, A. F. Patti and D. R. MacFarlane, Green Chem., 2013, 15, 525 RSC.
- A. Demirbas, J. Hazard. Mater., 2008, 157, 220–229 CrossRef CAS PubMed.
- D. Sud, G. Mahajan and M. P. Kaur, Bioresour. Technol., 2008, 99, 6017–6027 CrossRef CAS PubMed.
- S. Ishikawa, S. Sekine, N. Miura, K. Suyama, K. Arihara and M. Itoh, Biol. Trace Elem. Res., 2004, 102, 113–127 CrossRef CAS.
- J.-Q. Jiang, C. Cooper and S. Ouki, Chemosphere, 2002, 47, 711–716 CrossRef CAS.
- V. W.-K. Wu and F. Kure(Ko), Chin. J. Chem., 2010, 28, 2520–2526 CrossRef CAS.
|
| This journal is © The Royal Society of Chemistry 2013 |
Click here to see how this site uses Cookies. View our privacy policy here.  Open Access Article


