MRI ParaCEST agents that improve amide based pH measurements by limiting inner sphere water T2 exchange†
Mark
Milne
a,
Melissa
Lewis
a,
Nevin
McVicar
b,
Mojmir
Suchy
ab,
Robert
Bartha
b and
Robert H. E.
Hudson
*a
aDepartment of Chemistry, The University of Western Ontario, London, Ontario N6A 5B7, Canada. E-mail: robert.hudson@uwo.ca; Fax: +1-519-661-3022
bRobarts Research Institute, Department of Medical Biophysics, The University of Western Ontario, London, Ontario N6A 5C1, Canada
First published on 29th October 2013
Abstract
A series of Dy3+ and Tm3+ tetra-substituted DOTAM paraCEST agents incorporating para-substituted anilines has been synthesized and their paraCEST and relaxation properties evaluated. The response of selected agents (aniline and p-methoxyaniline) to changes in pH near the physiological range has also been studied. A crystal structure of Tm3+-p-OMe agent indicates a TSAP geometry with the absence of an inner sphere water molecule (denoted as TSAP'), which is thought to be due to the bulky nature of the amide nitrogen substituent. Two distinct amide signals are observed in the CEST spectrum for this compound, one for each of the isomers that exist in solution: SAP and TSAP with the larger chemical shift centred at −83 ppm compared to bulk water. Due to the non-optimal inner sphere water exchange, these agents produce minimal shortening of T1 and T2 relaxation time constants and therefore decrease relaxation induced signal losses during imaging.
Introduction
Lanthanide based contrast agents (CAs) have been exploited for a number of years in magnetic resonance imaging (MRI) with coordinated gadolinium (Gd3+) agents being used primarily in clinical environments.1–5 Of these agents cyclen-based macrocyclic agents have been predominantly utilized as chelators because of the high stability of the resulting metal complexes under in vivo conditions.It has been shown that cyclen-based agents can adopt two main geometries in solution. The first geometry is a square antiprismatic (SAP) while the second is a twisted square antiprismatic (TSAP).6,7 In solution, these geometries can be identified by the chemical shifts of the cyclen backbone with their interconversion measured by EXSY NMR experiments. In solid state, the two geometries can be distinguished by the angle between planes of N–Ln–N and O–Ln–O. When the angle between the aforementioned planes is ∼40°, the structure is assigned to the SAP form, while angles closer to 30° are assigned the TSAP form. Of these two forms, it has been shown that the TSAP geometry possesses a faster exchange of bound water compared to the SAP form, which is thought to occur because of the more open structure TSAP displays.8
A promising technique for the in vivo measurement of tissue environmental conditions is the use of chemical exchange saturation transfer (CEST) or paraCEST, when a paramagnetic species is used as a hyperfine shift agent.9–13 The CEST and paraCEST techniques rely on the exchange of shifted protons to transfer energy and create an overall decrease in the bulk water magnetization.14–16 The exchangeable proton sources are usually bound water as seen in Eu3+-containing paraCEST agents or protons associated amide, amine or alcohol functional groups in either diamagnetic CEST agents or in lanthanide paraCEST complexes.17–20 Because these agents generate contrast following the transfer of magnetization by the exchangeable protons, the contrast can be directly related to the environment around the agent if it modifies the exchange rate. For example, temperature and pH both modulate the proton exchange rate, particularly when using the highly shifted paraCEST agents that utilize Eu3+, Dy3+, Tb3+ or Tm3+ ions.21,22 While there have been numerous agents that are capable of reporting pH and temperature,13,23–27 some of these agents either do not function at physiological temperatures, or their optimal pH response is above 7, which is beyond the physiological range of interest. These drawbacks demonstrate the need to design agents that are responsive to the physiological parameters of interest, most notably when the tissue is slightly acidic (pH 6–7) and at temperatures between 35 °C and 45 °C. To address these issues, we have synthesized a series of Dy3+ and Tm3+ DOTAM anilides that are para-substituted, which should allow for the modulation of the amide's pKa based on the electron donating/withdrawing nature of the substituent (Fig. 1).
 | ||
| Fig. 1 Lanthanide-based CAs synthesised. | ||
Although paraCEST agents are generally inefficient at inducing T1 relaxation, such agents are capable of producing significant signal loss during in vivo imaging,28,29 due to increased transverse relaxation mediated by water exchange (T2 exchange) from the inner sphere to the bulk water. The use of ultra-short echo-time (UTE) pulse sequences can reduce this effect, as observed with the SWIFT pulse sequence when used for paraCEST imaging.30 However, such sequences are not standard on most clinical scanners limiting their applicability. Therefore, we hypothesized that a paraCEST agent designed to reduce T2 signal losses would therefore be of benefit. To this end, we have developed agents that either do not contain inner sphere water or their water exchange is outside the optimal exchange rate regime and therefore are inefficient modulators to the bulk water T2 relaxation time constant. It must be noted that the amides that generate the CEST effect will still induce T2 relaxation, but to a much less extent compared to bound water.
Similar studies have been performed to monitor and adjust the water exchange rate on a series of Eu3+-based ParaCEST agents.31 While those results demonstrate the ability to modulate the bound water exchange rate based on the electron donating and withdrawing properties of the substituents, the effect of para-substitution on amide proton exchange of anilides was not studied. The use of Eu3+ as the lanthanide limits the ability to monitor how the amide is affected by the substitutions because the amides will exhibit a small shift compared to that induced by other lanthanides such as Dy3+, Tm3+ or Tb3+.
Results and discussion
Synthesis of agents 3a–e, 4a–e
The electrophiles 1a–e were synthesised by adding chloroacetyl chloride to the appropriate aniline in acetonitrile while cooled in an ice bath in the presence of potassium carbonate (Scheme 1). The reactions were stirred overnight at room temperature, then filtered and the crude products were recrystallized from methanol. The average yield of these reactions was good (∼75%). Syntheses of the tetra-substituted cyclens were performed by mixing cyclen with 4.5 eq of the appropriate electrophiles in acetonitrile in the presence of potassium carbonate. It was necessary to heat the reaction at 55–80 °C over 1–3 days to ensure complete tetraalkylation as the final products were found to have limited solubility. The progress of these reactions was monitored by UPLC MS. When the reaction was deemed complete, the mixtures were cooled and the product was allowed to precipitate along with the K2CO3. The mixture was then filtered and the precipitate was washed with cold water to remove the K2CO3. At this point, attempts to recrystallize these compounds from methanol were unsuccessful due to their solubility properties. As such, the crude products were used without further purification. This procedure worked well except for products 2d,e which showed the presence of some minor impurities by 1H NMR (ESI†). It is our belief that the MR properties described are not affected by the presence of impurities. Crude yields ranged from of 94% to quantitative. The tetra-substituted cyclen products were then metallated using either DyCl3 or TmCl3 in a 1![[thin space (1/6-em)]](https://www.rsc.org/images/entities/char_2009.gif) :1 water:dioxane mixture at 80 °C over 4 days. The metallated complexes were subjected to dialysis against water across a membrane with a 500 Dalton molecular weight cutoff to remove salts carried through from the previous step as well as unchelated lanthanide ion. The final products were isolated and lyophilized to give white powders, with exception of the p-nitro compound being a yellow powder. Identification of the metallated products was accomplished by high resolution mass spectrometry along with their UPLC trace which showed all of the samples to be homogeneous tetra-substituted product.
:1 water:dioxane mixture at 80 °C over 4 days. The metallated complexes were subjected to dialysis against water across a membrane with a 500 Dalton molecular weight cutoff to remove salts carried through from the previous step as well as unchelated lanthanide ion. The final products were isolated and lyophilized to give white powders, with exception of the p-nitro compound being a yellow powder. Identification of the metallated products was accomplished by high resolution mass spectrometry along with their UPLC trace which showed all of the samples to be homogeneous tetra-substituted product.
 | ||
| Scheme 1 Conditions for the synthesis of lanthanide-based CAs. (i) Acetonitrile, K2CO3, room temperature, 18 h. (ii) Acetonitrile, K2CO3, 55–80 °C, 2–3 days. (iii) 1:1H2O:dioxane, DyCl3 or TmCl3, 60–80 °C, 4 days. | ||
CEST evaluation
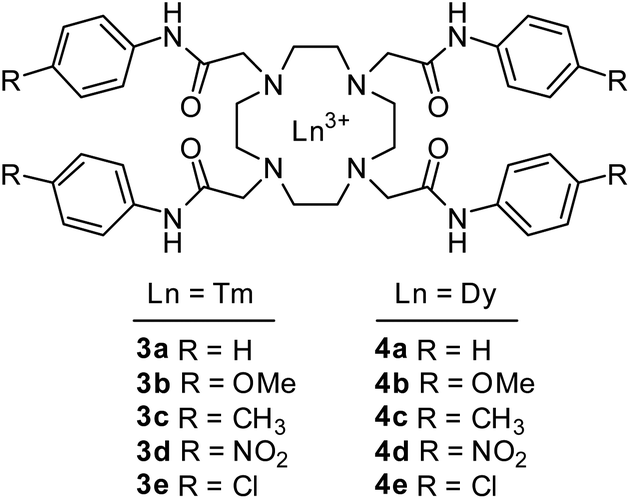
To study the effect of the para-substitution on the amide exchange rate of the Tm3+ and Dy3+ DOTAM anilides (3a–e, 4a–e), we began with a pH study of the series at 20 mM. Quickly, we discovered many of the compounds were not sufficiently soluble to achieve this concentration, except for the unsubstituted anilides (3a, 4a) and the para-OMe anilides (3b, 4b). Unfortunately, the rest of the series (3c–e, 4c–e) was not soluble enough to permit collection of reliable CEST spectra even at 5 mM. It is commonly reported in literature to use an organic co-solvent, such as acetonitrile, to increase CA solubility. However, we choose not to used a mixed-solvent system due to the difficulty in evaluating the true pH under such conditions. For the soluble 3a,b and 4a,b complexes, CEST experiments were performed by applying a 15 μT, 5 s saturation pulse at frequencies between −100 ppm and 100 pm in 1 ppm steps. Solutions were tested in the pH range of 6.5 to 9.0 for the unsubstituted anilides and the range of 5.1 to 8.0 for the para-OMe anilides. These ranges were chosen because of the observation that the maximum CEST effect was close to 8.0 for the unsubstituted anilides while the maximum CEST effect was between 7.0 and 7.5 for the para-OMe anilides. Of interest, we observed that the Tm3+para-OMe (3b) compound displayed two CEST signals due to the slow conformational equilibrium between the SAP and the TSAP geometries while the Dy3+ agent (4b) produced only one measurable signal. We have previously observed this feature during the study of a series of alkyl amides and designated the rarely seen higher shifted amide signal to a TSAP geometry while the signal less shifted is closer to the normally observed SAP geometry amide.11,32 This feature appears to be limited to Tm3+ agents and could be due to the smaller lanthanide size compared to the Dy3+, thus exacerbating steric interactions. The CEST spectra as a function of pH for 3a and 3b are shown in Fig. 2, with the CEST response for each of the 4 agents measured at pH 7.0 reported in Table 1.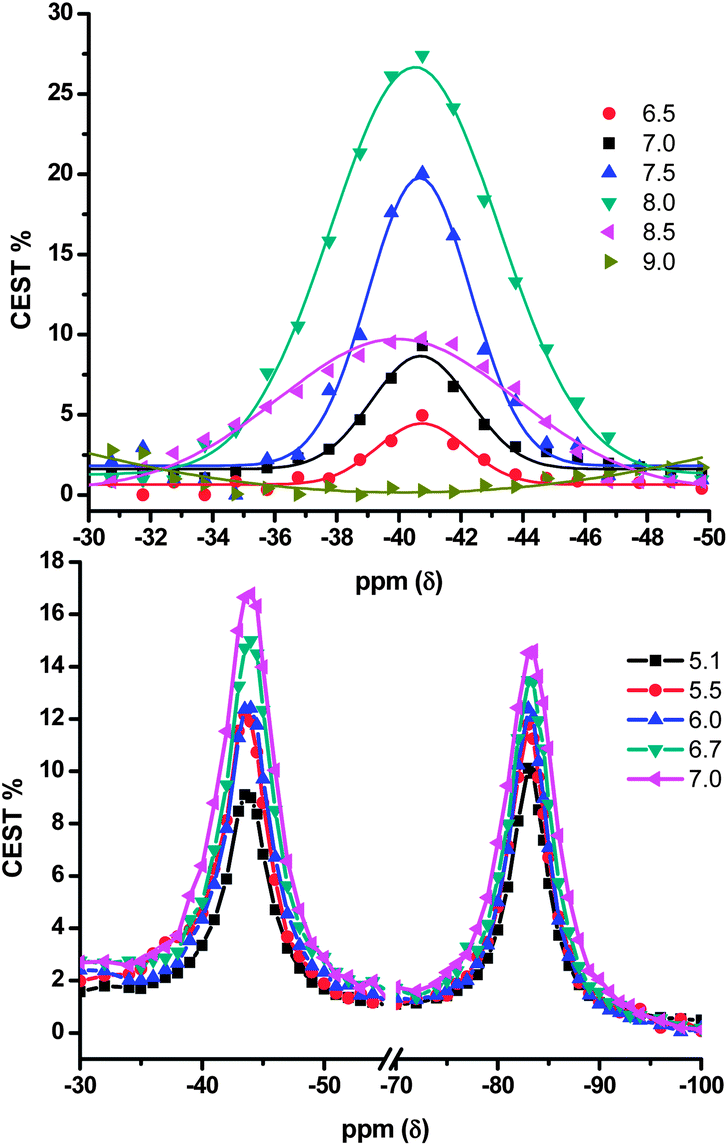 | ||
| Fig. 2 (Top) CEST spectra of 3a over the pH range of 6.5–9.0. (Bottom) CEST spectra of 3b over the pH range of 5.1–7.0. CEST spectra were acquired at 37 °C, 15 uT, 5 s, 20 mM. | ||
| Agent | ppm (δ) | CEST % |
|---|---|---|
| 3a | −41 | 12% |
| 3b | −43 | 17% |
| −83 | 12% | |
| 4a | 70 | 6% |
| 4b | 74 | 3% |
Fig. 3 shows how the CEST effect of agents 3a and 3b changes over the pH ranges measured. The signal for the Tm3+-para-OMe TSAP amide (−83 ppm) has a maximum signal at a slightly more acidic pH (7.0) compared to the SAP (−43 ppm) amide (pH 7.5). This effect has been observed previously for DOTAM agents where the signal possessing the greater chemical shift displays a maximum signal at lower pH compared to the signal with a smaller chemical shift.33
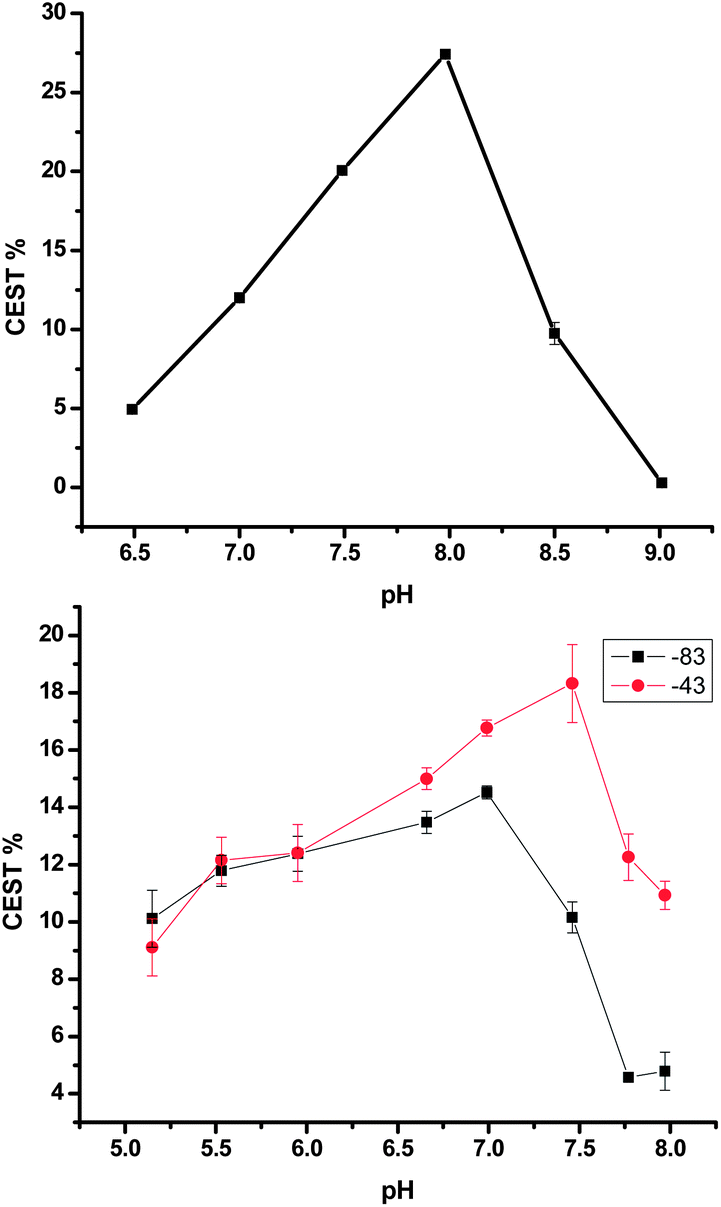 | ||
| Fig. 3 Maximum CEST effect as a function of pH. (Top) 3a shows a pH maximum at 8.0. (Bottom) 3b shows a pH maximum at 7.5 for the signal at −43 ppm and at 7.0 for the signal at −83 ppm. CAs at 20 mM. | ||
An effective MRI CA for pH measurement must show a monotonic response to pH and must provide a concentration independent measurement. Both conditions are violated by these agents, although the first issue can be minimized by rationalizing that it would be rare to observe a pH above 8 in vivo. One method to overcome the concentration dependence is illustrated in Fig. 4. Using a line width analysis, Tm3+p-H (3a) can be used as a pH reporter with a monotonic response to pH over the range of 6.5 to 8.5 by following the procedure described in McVicar et al.13
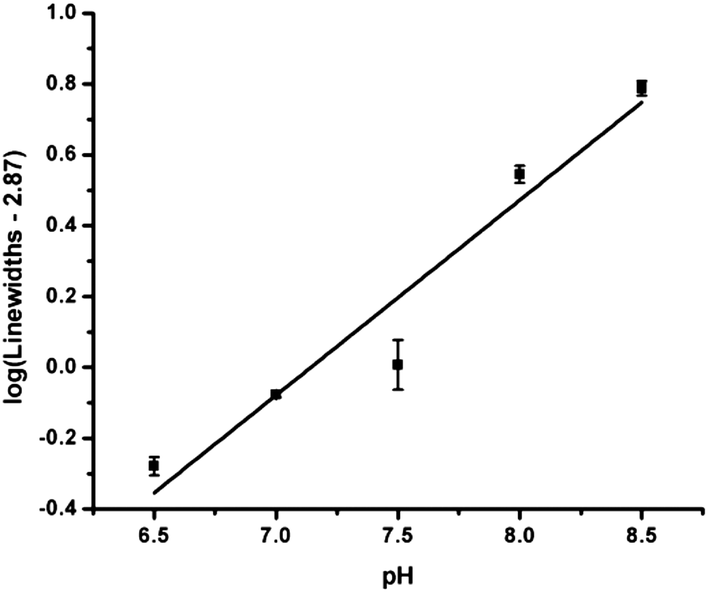 | ||
| Fig. 4 Line width analysis vs. pH of a 20 mM solution of Tm3+p-H (3a) at 37 °C, using 15 μT, 5 s saturation. | ||
Another approach to overcome concentration dependence is to implement a ratiometric approach as previously described, where two intramolecular signals are evaluated simultaneously.23,34 In particular, when two CEST responses arise from a single agent a ratio of the CEST effect eliminates the concentration dependence and enables the agent to be used as a physiological reporter. Since Tm3+-para-OMe possesses two intramolecular amide signals that behave slightly different based on pH, we examined the possibility of using it as a ratiometric pH reporter. However, the small pH responses and limited solubility of the Tm3+-para-OMe agent frustrated attempts to demonstrate how this agent could be used as a concentration independent pH reporter (data not shown). We are currently developing synthetic avenues to make this agent more pH responsive, as well as increase its solubility to extend its functionality.
X-ray structures
Crystals suitable for X-ray diffraction were grown from slow evaporation of a concentrated solution of Tm3+-para-OMe (3b) in water. Fig. 5 illustrates a molecular representation of 3b at 50% probability for the ellipsoids. It has been shown that macrocyclic CAs based on cyclen can exhibit a 9 coordination geometry around the lanthanide, where 8 of the coordination sites are filled with 4 nitrogens of the cyclen and 4 oxygens from the carbonyls pendant groups. The ninth coordination site is typically occupied by a water molecule that can be exchanged with the bulk water system and can be used to enhance relaxation or transfer saturation to the bulk system. | ||
| Fig. 5 Molecular representation of the solid state structure of Tm3+-para-OMe (3b) determined by single crystal X-ray studies. Hydrogens have been omitted for clarity. (Left) Side on view of 3b showing eightfold coordination of the Tm3+ by the nitrogens of cyclen and the oxygens of the amide pendant groups. φ denotes the trans O–Ln–O bond angle. (Right) Top down view of 3b. The aniline rings are omitted for clarity. α indicates the angle created between the planes of N–Ln–N and O–Ln–O and is listed in Table 2 along with selected angles and bond lengths. | ||
X-ray crystallography determined an 8 coordination system around the Tm3+ ion, with the 8 sites filled by either nitrogen atoms or oxygen atoms. The ninth potential coordination site was unoccupied – no bound water was found to directly coordinate the metal centre. This distinction has been observed before for lanthanide based CAs and has been denoted by ascribing a prime (′) to the end of the geometry abbreviation.7,35–38 It should be noted that a lack of inner sphere water in the solid state does not reflect the solvation environment in solution where a metal bound water may be present.
For an agent to have space to occupy the ninth site with a bound water there needs to be an angle at the metal center (φ, trans O–Ln–O) of at least 135°.38,39 With an average angle of 123° (Table 2) it is not surprising that water is not observed coordinated to the metal center in the crystal structure. The steric crowding of the metal center is exacerbated due to the rigid nature of the phenyl rings that are enforced into an northern orientation due to the thermodynamically favoured s-trans amide geometry.
| Average α angle | 26.95 |
| φ angle O1–Tm–O3 | 123.64(7) |
| φ angle O2–Tm–O4 | 122.43(8) |
| N1–C–C–O1 | 12.4(3) |
| N2–C–C–O2 | 15.1(4) |
| N3–C–C–O3 | 14.7(4) |
| N4–C–C–O4 | 2.9(3) |
| N1–Tm | 2.508(2) |
| N2–Tm | 2.492(2) |
| N3–Tm | 2.469(3) |
| N4–Tm | 2.500(3) |
| O1–Tm | 2.296(2) |
| O2–Tm | 2.245(2) |
| O3–Tm | 2.313(2) |
| O4–Tm | 2.265(2) |
| Centeroid O4–Tm | 1.087 |
| Centeroid N4–Tm | 1.382 |
| Centeroid O4–centeroid N4 | 2.470 |
The α angle created between the planes of N–Ln–N and O–Ln–O is used in determining which geometry is present. Angles that near 40° are in a SAP geometry while angles that are closer to 30° are in the TSAP geometry.40 In the case of the Tm3+para-OMe, the observed solid-state geometry is TSAP' system with an α angle of 27° and lacking inner sphere water. The distance between the centroids of the O4 and N4 planes is also indicative of the geometry of the crystal. With a distance of 2.47 Å, this crystal is comparable to other TSAP structures whereas the typical distance in SAP structures is smaller (∼2.35 Å).38,41 The distance between the centeroid of the 4 nitrogen atoms of cyclen and the metal center is 1.38 Å, which is shorter then a series of previously reported SAP DOTAM complexs (Nd3+ = 1.66 Å, Dy3+ = 1.59 Å, Tb3+ = 1.59 Å, Yb3+ = 1.56 Å).42 By chelating the metal lower into the cyclen ring the 4 carbonyls tend to wrap overtop the metal effectively limiting water access giving rise to the low φ angle of 123° previously discussed.37,38 It is possible the compacting of the overall structure results in a highly shifted amide signal as the chemical shift observed for the exchangeable amide proton is distance dependent.43 The average distance of the amide nitrogen to the metal center is 4.28 Å while the average distance for a series of previously reported SAP DOTAM complexes was significantly longer (Nd3+ = 4.56 Å, Dy3+ = 4.48 Å, Tb3+ = 4.50, Yb3+ = 4.45 Å)42 We have observed a signal for a Tm3+ agent above 100 ppm previously; however, we were unable to grow a crystal to help determine if there was an inner sphere water which can contribute to tighter packing and increased signal dispersion. In solution, the other geometry that is present that gives rise to a CEST peak at −43 ppm is thought to be in a SAP geometry, which exhibits a similar limited water exchange due to the bulkiness of the ligands, however we are unable to determine the exact number of inner sphere water molecules. Selected angles and distances are listed in Table 2 and more detailed crystallographic parameters in Table 3.
| Formula | C44H67Cl3N8O13Tm |
| Formula weight (g mol−1) | 1191.34 |
| Crystal dimensions (mm) | 0.27 × 0.18 × 0.08 |
| Crystal colour and habit | Colourless prism |
| Crystal system | Triclinic |
| Space group |
P![[1 with combining macron]](https://www.rsc.org/images/entities/char_0031_0304.gif) |
| Temperature, K | 110 |
| a, Å | 10.948(3) |
| b, Å | 14.438(3) |
| c, Å | 17.436(5) |
| a, ° | 77.345(10) |
| b, ° | 78.428(9) |
| g, ° | 85.152(10) |
| V, Å3 | 2632.1(12) |
| Number of reflections to determine final unit cell | 9059 |
| Min and max 2θ for cell determination | 4.88, 64.1 |
| Z, ° | 2 |
| F(000) | 1222 |
| r (g cm−1) | 1.503 |
| l, Å, (MoKa) | 0.71073 |
| m, (cm−1) | 1.904 |
| Measured fraction of data | 0.989 |
| Number of reflections measured | 87264 |
| Unique reflections measured | 22979 |
| R merge | 0.0335 |
Relaxation evaluation
With the ninth site of Tm3+para-OMe (3b) either vacant of inner sphere water or possessing a water which exchanges outside the optimal rate regime for T2 relaxation, which was not determined, theory predicts that there should be sizable differences in the ability of this agent to induce bulk water relaxation compared to similar agents that contain bound water or are exchanging within the optimal regime.2,44 While Tm3+ lanthanide agents are not generally efficient T1 relaxation agents they have recently been shown to produce sizable T2 relaxation effects (Table 4). Soesbe et al.29 compared several Eu3+ based agents that contained inner sphere water with one that did not, and showed a darkening during in vivo paraCEST imaging of kidneys for those agents that had intermediate inner sphere water exchange rates. The darkening was linked to T2 shortening which is largely caused by the frequency shift of bound water which is in exchange with a paramagnetic metal. This shortening of the T2 time constant lead to a reduction in the image signal intensity and reduced CEST contrast. Another Eu3+ agent that lacked an inner sphere water (Eu3+ TETA) showed very little T2 shortening and limited darkening. Since this seminal publication, Soesbe et al. have prepared and studied a series of Dy3+ agents to fine tune the optimal water exchange to generate T2 contrast.45 The optimal lifetime was found to be roughly 500 ns to 1 μs for Dy3+ complexes and could generate r2 values of 18 mM−1 s−1.45,46 Because Eu3+ based agents typically utilize the exchange of bound water from the inner sphere to generate the saturation used in paraCEST imaging such agents may also produce T2 related signal loss when images are acquired with non-zero echo-time.| Agent | r 1 (s−1 mM−1) | r 2 (s−1 mM−1) |
|---|---|---|
| Tm3+para-H (3a) | 0.06 | 0.66 |
| Tm3+para-OMe (3b) | 0.05 | 0.40 |
| Tm3+ DOTAM-Gly | 0.06 | 2.00 |
| Tm3+ DOTAM-Gly-Lys | 0.09 | 5.11 |
Development of agents that do not contain inner sphere water or agents that have water exchange rates outside the optimal exchange regime, such as Tm3+para-OMe (3b), should have an advantage in –NH based paraCEST imaging as the major T2 shortening mechanism from water exchange has been removed. It should be noted that the exchange of –NH protons of the anilides still contributes to the T2 relaxation of bulk water, but to a lesser extent compared to highly shifted bound water.29Fig. 6 shows the relaxation rate (R2) as a function of concentration for Tm3+ based agents that are thought to either have bound water (Tm3+ DOTAM-Gly, Tm3+ DOTAM-Gly-Lys) and those that are thought to have no bound water or are exchanging outside the optimal rate (Tm3+para-H (3a), Tm3+para-OMe (3b)). The associated longitudinal and transverse relaxivity (r1, r2) is provided in Table 4.
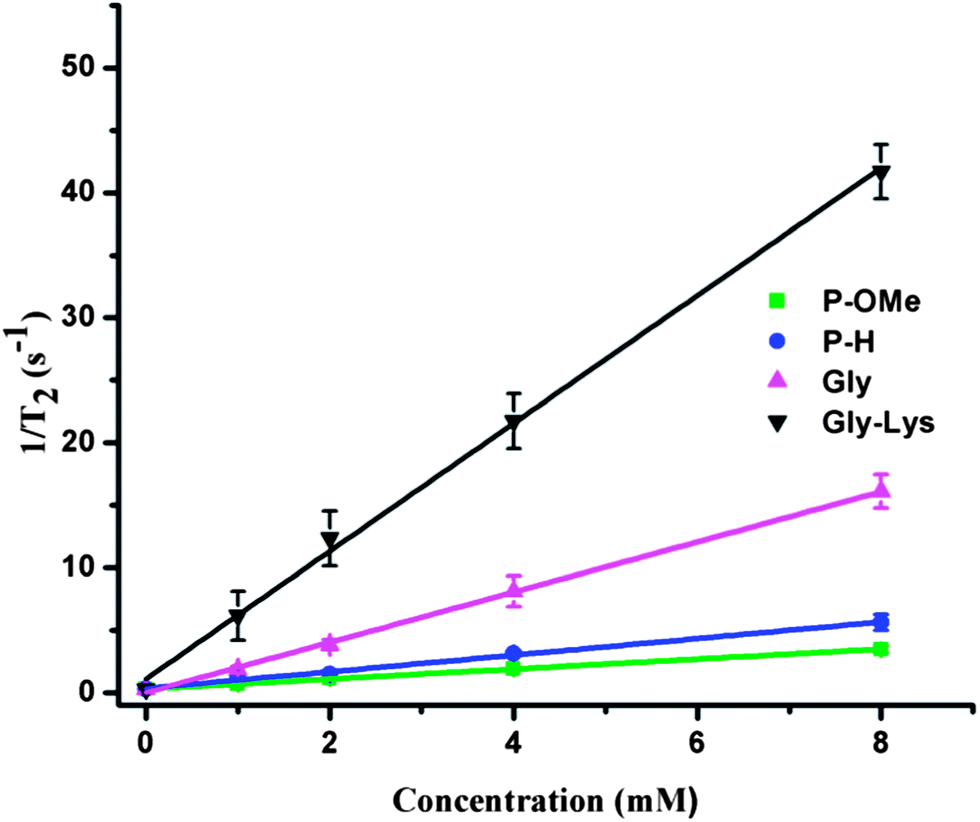 | ||
| Fig. 6 Transverse relaxation rate (R2) for agents Tm3+para-H (3a), Tm3+para-OMe (3b), Tm3+ DOTAM-Gly and Tm3+ DOTAM-Gly-Lys. The relaxivity (r2) is given by the slope of the linear fit and reported in Table 4. Error bars are from the standard deviation using n = 3 values. | ||
The two anilide agents (3a, 3b) produced a significantly lower relaxation rate (Fig. 6) because they do not possess an inner sphere water or the metal-bound water exchanges outside the optimal exchange regime (which was not determined). None of the agents tested produced strong T1 relaxation of the bulk water, which is not surprising as Tm3+ is not known to act as a T1 relaxation enhancer.28 The benefit of having CEST agents with minimal effect on T2 relaxation is demonstrated in Fig. 7. Two phantoms are shown, one containing Tm3+ DOTAM-Gly-Lys as an example of a short T2 agent (large r2) and the second containing Tm3+para-OMe (3b) as an example of a long T2 agent (small r2). T1 and T2 weighted images were acquired and demonstrate that Tm3+ DOTAM Gly-Lys (Fig. 7c) produces signal loss due to the T2 exchange effect, while Tm3+para-OMe (Fig. 7d) does not have a large T2 exchange effect. The two phantoms were imaged at a concentration of 20 mM and compared to aqueous solutions containing no agents (outer circles in Fig. 7). Both the signal to noise ratio (SNR) and CEST effect are important properties that can be used to characterize CEST images. In medical imaging practice however it is important to calculate the contrast to noise ratio (CNR) of CEST images to quantify the likelihood of distinguishing between diseased and surrounding normal tissue.47 In Table 5, several CEST image properties including the SNR, CEST effect and CNR are provided for Tm3+-para-OMe and Tm3+ DOTAM-Gly-Lys. While Tm3+ DOTAM-Gly-Lys produces the largest CEST effect, the agent with the longest T2, Tm3+-para-OMe, provides a significantly greater CNR.
 | ||
| Fig. 7 T1 and T2 weighted images collected at 37 °C and pH 7.0. Inner circle contains 20 mM CAs. Outer circle contains water with no agents. T1 weighted images of (a) Tm3+ DOTAM Gly-Lys (b) Tm3+para-OMe (3b). T2 weighted images of (c) Tm3+ DOTAM Gly-Lys (d) Tm3+para-OMe (3b). | ||
| Agent (mobile pool frequency) | μ signal w/o saturation | SNRa w/o saturation | μ signal w/o saturation | CEST (%) | CNRa |
|---|---|---|---|---|---|
| a SNR and CNR were calculated as defined in ref. 41. σnoise used in the calculations was 161. | |||||
| Bulk water | 58030 |
3627 | — | — | — |
| Tm3+para-OMe (−43 ppm) | 56050 |
3503 | 46540 |
16.9 | 59.0 |
| Tm3+para-OMe (−83 ppm) | 49190 |
12.2 | 42.6 | ||
| Tm3+ DOTAM-Gly-Lys (−46 ppm) | 8891 | 556 | 5039 | 43.3 | 23.9 |
To visualize the significance of SNR and CNR, Fig. 7 provides a direct comparison of T1- and T2-weighted images of 20 mM Tm3+-para-OMe and Tm3+ DOTAM-Gly-Lys phantoms surrounded by an outer cylinder of distilled water. A 3.5% decrease in SNR was calculated for the long T2 agent (Tm3+-para-OMe) while a 85% decrease was measured for the short T2 agent (Tm3+ DOTAM-Gly-Lys). It is apparent that even with a large CEST effect, the overall detectability of Tm3+ Gly-Lys is substantially lower than Tm3+-para-OMe due to the short bulk water T2 induced by Tm3+ DOTAM-Gly-Lys.
Experimental
General experimental procedures
CEST fast spin-echo (FSE) images were acquired on a 9.4T MRI scanner (Agilent, Palo Alto, CA) with the following parameters, FOV (field of view): 25.6 × 25.6 mm2, matrix: 64 × 64, TR: 5000 ms, TE: 10 ms, ETL = 32, 1 average, 2 prescans, 1 slice 3 mm thick. CEST spectra (Tm3+ and Dy3+) were acquired using a 15 μT, 5 s continuous wave presaturation pulse at offset frequencies ranging from −100 to 100 ppm in steps of 1 ppm, averaged n = 3. CEST signals were fitted to a Gaussian curve and line widths were taken from the fittings. T1 weighted images were acquired using a gradient echo pulse sequence with TR = 200 ms, TE = 2.62 ms, flip angle = 20°, 10 averages, matrix = 128 × 128, FOV = 19.2 × 19.2 mm2, 1 slick 4 mm thick. T2 weighted images were acquired using the FSE pulse sequence used for CEST imaging with TR = 3000 ms, echo spacing = 10 ms, echo train length = 4, effective TE = 40 ms, 4 averages, matrix = 128 × 128, FOV = 19.2 × 19.2 mm2, 1 slick 4 mm thick. All samples were studied at 20 mM concentration, 37 °C. All solvents were HPLC grade and used as such, except for dioxane (dried by passing through columns of activated Al2O3) and water (18.2 MΩ cm−1 deionized). Solvents were removed under reduced pressure in a rotary evaporator. NMR spectra were recorded on a 400 MHz spectrometer; for 1H (400 MHz), chemical shift values (δ) are reported relative to TMS and were referenced to the residual proton in the deuterated solvents as follows: CDCl3 (7.26 ppm); DMSO-d6 (2.49 ppm); D2O (4.75 ppm). Mass spectra (MS) were obtained using electrospray ionization (ESI). T1 relaxation time constant measurements were made for 4 different concentrations (1, 2, 4, 8 mM, averaged n = 3) of CA using an inversion recovery sequence (10 inversion times in the range of 10 ms to 10 s) with a 20 seconds repetition time to ensure full recovery, pH 7 and 37 °C. T2 relaxation time constant measurements were made for 4 different concentrations (1, 2, 4, 8 mM, averaged n = 3) of CA using a CPMG pulse sequence (10 train echo times in the range of 10 ms to 10 s) with a 20 seconds repetition time to ensure full recovery, pH 7 and 37 °C. Tm3+ DOTAM-Gly was prepared previously.12 Tm3+ DOTAM-Gly-Lys was prepared previously.48General procedure for electrophiles 1a–e
Chloroacetyl chloride (15.7 mmol) was added slowly on ice to a stirring suspension of aniline (a–e) (7.84 mmol) and K2CO3 (15.7 mmol) in acetonitrile (50 mL). The solution was allowed to stir overnight at room temperature followed by filtration. The filtrate was concentrated and the product was crystallized from methanol.General procedures for tetra substituted cyclen 2a–e
Electrophiles 1a–e (2.25 mmol) in 3 mL acetonitrile were added to a stirring suspension of cyclen (0.5 mmol) and K2CO3 (2.25 mmol) in acetonitrile (12 mL). The reaction was then stirred for 1–3 days at 55 –80 °C and monitored by UPLC MS. Upon completion the reaction was filtered and the precipitate washed with water, then collected and used without further purification. This procedure worked well except for compounds 2d and 2e which possessed some minor impurities (see ESI†).General procedure for metallation of tetra substituted cyclen products 3a–e, 4a–e
To a stirring solution of appropriate tetra substituted cyclen (2a–e) (0.07 mmol) in 4 mL 1:1H2O:dioxane, DyCl3·6H2O or TmCl3·H2O (0.07 mmol) was added and the reaction was stirred over a period of 1–4 days at 60 –80 °C. The metalation was monitored by UPLC MS and upon completion, the reaction mixture was concentrated and re-dissolved in 1 mL H2O followed by dialysis (for 3 days) against water to remove any unchelated lanthanide ions. After dialysis, the absence of free lanthanide ion was confirmed by the xylene orange test. The homogeneity of dialyzed chelates was analyzed by UPLC and their identity were confirmed by ESI-HRMS. UV traces of the chromatograms for compounds 3a,b and 4a,b are given in the Supplemental Information. The chelates were then used without further purification.
Conclusions
A series of Dy3+ and Tm3+para-substituted anilide CAs were synthesised and tested for their ability to respond to pH changes in a range of interest for in vivo reporting. Poor solubility of many of the compounds limited the possible measurements and prevented us from making a complete comparison of structure and effects. Even with the limited solubility, there were a number of interesting observations in the agents that were soluble. It was observed that the unsubstituted anilines had a maximum CEST effect at a pH near 8, while the maximum CEST effect for the para-OMe agents was between pH 7–7.5. The Tm3+para-OMe CAS possesses a highly shifted signal at −83 ppm. A pH and concentration study was attempted to determine if Tm3+ para-OMe could be used as a ratiometric agent to measure pH in vivo, independent of concentration, but due to solubility limitations, no suitable measurements could be performed. Modifications of this ligand are currently underway to overcome the poor solubility.Despite the limited data set collected, a comparison of agents that create large T2 relaxation with those that do not was possible. Examination of the molecular structure of Tm3+ DOTAM p-methoxyanilide revealed that the large amide subsitutents impinge on the ability of the metal center to possess water in the solid state and is designated as TSAP'. The space normally occupied by a ninth ligand (e.g. bound water) is diminished by the metal ion being held deeply in the chelate at a relatively acute trans O–Ln–O angle (123°). Within this chelation geometry, the amide nitrogens are positioned relatively closer to the metal, as compared to SAP geometry, thus resulting in highly shifted exchangeable protons. The solution behaviour of this chelate also mirrors the lack of bound water in an exchange regime that causes T2 relaxation. These features produce an increase in CEST sensitivity and also add the benefit of moving the CEST signal outside the MT background of in vivo imaging.11 Due to these promising properties, modification of these agents are underway to allow for in vivo testing of paraCEST agents with high shifting CEST signals and limited T2 relaxation for improved CNR during imaging.
Acknowledgements
The authors gratefully acknowledge funding from the Natural Sciences and Engineering Research Council of Canada (RHEH) and Canadian Institutes for Health Research (RB). The authors also thank Dr Todd Soesbe (University of Texas Southwestern Medical Centre, Dallas TX) for his helpful discussion of T2 exchange and Dr Paul Boyle (Western) for performing the single-crystal X-ray diffraction study.Notes and references
- P. Caravan, J. J. Ellison, T. J. McMurry and R. B. Lauffer, Chem. Rev., 1999, 99, 2293–2352 CrossRef CAS PubMed.
- S. Aime, M. Botta and E. Terreno, Adv. Inorg. Chem., 2005, 57, 173–237 CAS.
- S. Aime, C. Cabella, S. Colombatto, S. G. Crich, E. Gianolio and F. Maggioni, J. Magn. Reson. Imaging, 2002, 16, 394–406 CrossRef PubMed.
- H. U. Rashid, K. Yu and J. Zhou, J. Struct. Chem., 2013, 54, 223–249 CrossRef CAS.
- E. Terreno, D. D. Castelli, A. Viale and S. Aime, Chem. Rev., 2010, 110, 3019–3042 CrossRef CAS PubMed.
- M. P. M. Marques, C. Geraldes, A. D. Sherry, A. E. Merbach, H. Powell, D. Pubanz, S. Aime and M. Botta, J. Alloys. Compd., 1995, 225, 303–307 CrossRef CAS.
- S. Aime, M. Botta, M. Fasano, M. P. M. Marques, C. Geraldes, D. Pubanz and A. E. Merbach, Inorg. Chem., 1997, 36, 2059–2068 CrossRef CAS PubMed.
- P. Lebduskova, P. Hermann, L. Helm, E. Toth, J. Kotek, K. Binnemans, J. Rudovsky, I. Lukes and A. E. Merbach, Dalton Trans., 2007, 493–501 CAS.
- E. Terreno, D. D. Castelli and S. Aime, in The Chemistry of Contrast Agents in Medical Magnetic Resonance Imaging, John Wiley & Sons, Ltd, 2013, pp. 387–425 Search PubMed.
- K. M. Ward and R. S. Balaban, Magn. Reson. Med., 2000, 44, 799–802 CrossRef CAS.
- T. K. Stevens, M. Milne, A. A. H. Elmehriki, M. Suchý, R. Bartha and R. H. E. Hudson, Contrast Media Mol. Imaging, 2013, 8, 289–292 CrossRef CAS PubMed.
- S. Aime, A. Barge, D. Delli Castelli, F. Fedeli, A. Mortillaro, F. U. Nielsen and E. Terreno, Magn. Reson. Med., 2002, 47, 639–648 CrossRef CAS PubMed.
- N. McVicar, A. X. Li, M. Suchý, R. H. E. Hudson, R. S. Menon and R. Bartha, Magn. Reson. Med., 2013, 70, 1016–1025 CrossRef CAS PubMed.
- S. R. Zhang, M. Merritt, D. E. Woessner, R. E. Lenkinski and A. D. Sherry, Acc. Chem. Res., 2003, 36, 783–790 CrossRef CAS PubMed.
- S. Zhang, X. Jiang and A. D. Sherry, Helv. Chim. Acta, 2005, 88, 923–935 CrossRef CAS.
- M. Woods, E. W. C. Donald and A. D. Sherry, Chem. Soc. Rev., 2006, 35, 500–511 RSC.
- K. Snoussi, J. W. M. Bulte, M. Gueron and P. C. M. van Zijl, Magn. Reson. Med., 2003, 49, 998–1005 CrossRef CAS PubMed.
- J. Zhou and P. C. M. van Zijl, Prog. Nucl. Magn. Reson. Spectrosc., 2006, 48, 109–136 CrossRef CAS PubMed.
- B. Yoo and M. D. Pagel, J. Am. Chem. Soc., 2006, 128, 14032–14033 CrossRef CAS PubMed.
- M. Woods, D. E. Woessner, P. Zhao, A. Pasha, M.-Y. Yang, C.-H. Huang, O. Vasalitiy, J. R. Morrow and A. D. Sherry, J. Am. Chem. Soc., 2006, 128, 10155–10162 CrossRef CAS PubMed.
- S. R. Zhang, K. C. Wu and A. D. Sherry, Angew. Chem., Int. Ed., 1999, 38, 3192–3194 CrossRef CAS.
- S. Aime, D. Delli Castelli and E. Terreno, Angew. Chem., Int. Ed., 2002, 41, 4334–4336 CrossRef CAS.
- D. Delli Castelli, E. Terreno and S. Aime, Angew. Chem., Int. Ed., 2011, 50, 1798–1800 CrossRef CAS PubMed.
- J. Pacheco-Torres, D. Calle, B. Lizarbe, V. Negri, C. Ubide, R. Fayos, P. L. Larrubia, P. Ballesteros and S. Cerdan, Curr. Top. Med. Chem., 2011, 11, 115–130 CrossRef CAS.
- A. X. Li, F. Wojciechowski, M. Suchy, C. K. Jones, R. H. E. Hudson, R. S. Merton and R. Bartha, Magn. Reson. Med., 2008, 59, 374–381 CrossRef CAS PubMed.
- M. Suchy, A. X. Li, R. Bartha and R. H. E. Hudson, Org. Biomol. Chem., 2008, 6, 3588–3596 CAS.
- F. K. Kalman, M. Woods, P. Caravan, P. Jurek, M. Spiller, G. Tircso, R. Kiraly, E. Brucher and A. D. Sherry, Inorg. Chem., 2007, 46, 5260–5270 CrossRef CAS PubMed.
- C. K. Jones, A. X. Li, M. Suchý, R. H. E. Hudson, R. S. Menon and R. Bartha, Magn. Reson. Med., 2010, 63, 1184–1192 CrossRef CAS PubMed.
- T. C. Soesbe, M. E. Merritt, K. N. Green, F. A. Rojas-Quijano and A. D. Sherry, Magn. Reson. Med., 2011, 66, 1697–1703 CrossRef CAS PubMed.
- T. C. Soesbe, O. Togao, M. Takahashi and A. D. Sherry, Magn. Reson. Med., 2012, 68, 816–821 CrossRef PubMed.
- S. J. Ratnakar, M. Woods, A. J. M. Lubag, Z. Kovács and A. D. Sherry, J. Am. Chem. Soc., 2008, 130, 6–7 CrossRef CAS PubMed.
- A. A. H. Elmehriki, M. Milne, M. Suchý, R. Bartha and R. H. E. Hudson, Can. J. Chem., 2012, 91, 211–219 CrossRef.
- A. D. Z. Sherry and K. Wu, WO 02/43775A2, 2002.
- Y. Li, V. R. Sheth, G. Liu and M. D. Pagel, Contrast Media Mol. Imaging, 2011, 6, 219–228 CrossRef CAS PubMed.
- F. Benetollo, G. Bombieri, L. Calabi, S. Aime and M. Botta, Inorg. Chem., 2003, 42, 148–157 CrossRef CAS PubMed.
- A. Rodríguez-Rodríguez, D. Esteban-Gómez, A. de Blas, T. Rodríguez-Blas, M. Fekete, M. Botta, R. Tripier and C. Platas-Iglesias, Inorg. Chem., 2012, 51, 2509–2521 CrossRef PubMed.
- P. Vojtíšek, P. Cígler, J. Kotek, J. Rudovský, P. Hermann and I. Lukeš, Inorg. Chem., 2005, 44, 5591–5599 CrossRef PubMed.
- J. Kotek, J. Rudovský, P. Hermann and I. Lukeš, Inorg. Chem., 2006, 45, 3097–3102 CrossRef CAS PubMed.
- I. Lukeš, J. Kotek, P. Vojtíšek and P. Hermann, Coord. Chem. Rev., 2001, 216–217, 287–312 CrossRef.
- D. Parker, R. S. Dickins, H. Puschmann, C. Crossland and J. A. K. Howard, Chem. Rev., 2002, 102, 1977–2010 CrossRef CAS PubMed.
- J. Vipond, M. Woods, P. Zhao, G. Tircsó, J. Ren, S. G. Bott, D. Ogrin, G. E. Kiefer, Z. Kovacs and A. D. Sherry, Inorg. Chem., 2007, 46, 2584–2595 CrossRef CAS PubMed.
- M. Milne, K. Chicas, A. Li, R. Bartha and R. H. E. Hudson, Org. Biomol. Chem., 2012, 10, 287–292 CAS.
- M. Singh, J. J. Reynolds and A. D. Sherry, J. Am. Chem. Soc., 1983, 105, 4172–4177 CrossRef CAS.
- S. Aime, M. Fasano and E. Terreno, Chem. Soc. Rev., 1998, 27, 19–29 RSC.
- T. C. Soesbe, J. Ratnakar, M. Milne, S. Zhang, Q. Do, Z. Kovacs and A. D. Sherry, Magn. Reson. Med., 2013 Search PubMed , accepted.
- A. D. Sherry and Y. Wu, Curr. Opin. Chem. Biol., 2013, 17, 167–174 CrossRef CAS PubMed.
- E. M. Haacke, R. W. Brown, M. R. Thompson and R. Venkatesan, Magnetic Resonance Imaging: Physical Principles and Sequence Design, Wiley, 1999 Search PubMed.
- F. Wojciechowski, M. Suchy, A. X. Li, H. A. Azab, R. Bartha and R. H. E. Hudson, Bioconjugate Chem., 2007, 18, 1625–1636 CrossRef CAS PubMed.
Footnote |
| † Electronic supplementary information (ESI) available: CEST images of Tm3+ DOTAM-Gly-Lys, Tm3+-para-OMe, 1H and 13C NMR spectra of electrophiles and tetra analide compounds. See DOI: 10.1039/c3ra43537g |
| This journal is © The Royal Society of Chemistry 2014 |