Using a two-step deposition technique to prepare perovskite (CH3NH3PbI3) for thin film solar cells based on ZrO2 and TiO2 mesostructures†
Dongqin Bia,
Soo-Jin Moonb,
Leif Häggmana,
Gerrit Boschlooa,
Lei Yanga,
Erik M. J. Johansson*a,
Mohammad K. Nazeeruddinb,
Michael Grätzelb and
Anders Hagfeldt*a
aDepartment of Chemistry-Ångström, Physical Chemistry, Uppsala University, Uppsala, Sweden. E-mail: erik.johansson@kemi.uu.se; anders.hagfeldt@kemi.uu.se
bLaboratory of Photonics and Interfaces, Department of Chemistry and Chemical Engineering, Swiss Federal Institute of Technology, Station 6, CH-1015 Lausanne, Switzerland
First published on 24th July 2013
Abstract
A two-step deposition technique is used for preparing CH3NH3PbI3 perovskite solar cells. Using ZrO2 and TiO2 as a mesoporous layer, we obtain an efficiency of 10.8% and 9.5%, respectively, under 1000 W m−2 illumination. The ZrO2 based solar cell shows higher photovoltage and longer electron lifetime than the TiO2 based solar cell.
Although highly efficient solar cells have already been commercialized based on silicon and compound semiconductors, the manufacturing processes are still relatively expensive in terms of both materials and techniques. On the other hand, efficient and low-cost organic and dye-sensitized solar cells (DSSCs) have been making good progress recently,1–3 although their maximum performance still falls behind the inorganic thin-film counterparts. Thus, further improvement of the solar cell performance and stability is still required for practical applications.4,5 Lately, three-dimensional hybrid perovskites, due to their unique electrical and optical properties, along with their enormous flexibility in construction of quantum confinement structures,6,7 have been used in thin film solar cells,8,9 with a highest efficiency of 12.3%,10,11 which affords a good alternative for solar energy utilization.
Generally, there are four methods, including spin-coating,12 vacuum vapor deposition,13 two-step deposition technique (TSD),14,15 and patterning thin film16 to prepare the hybrid perovskite film.17 One-step spin-coating is the most widely method to prepare the solar cells, but it is difficult to control film properties including thickness, uniformity, and morphology. Additionally, for the organic part, the longer the organic chains, the more difficult to find a good solvent. For the inorganic part, solvent techniques always encounter some problems, because of solubility, strong solvent coordination, or the stability of the metal valence state. In the one-step spin-coating deposition the solvent in addition needs to dissolve both the organic and the inorganic part. Vacuum evaporation is considered as a good technique to grow oriented thin films of layered perovskites with a precise control of the film property. However, the preparation of various perovskites using different organic components is expected to be limited, and a deposition without vacuum evaporation might be advantageous for low-cost solar cells. Combining the advantages of the two method described above, Mitzi and co-workers created the TSD technique to prepare hybrid perovskite.14 Firstly, a layer of metal halide, MI2 (M = IVB group metal), was deposited using vacuum evaporation, or spin-coating, followed by dipping the film into an organic salt solution. For the perovskite CH3NH3MI3 (M = Pb, Sn), the X-ray diffraction patterns demonstrate that the films prepared by the one step spin-coating method and the TSD method are in good agreement with each other.14
Here we adopt the TSD to prepare the CH3NH3PbI3 for the perovskite thin film solar cell, which has recently been reported to be successful also for solar cells.18 Considering the low-cost advantages with a non-vacuum preparation technique we use spin-coating for the first step. We investigate the differences in the charge recombination, charge transport and the light to current conversion process between ZrO2 and TiO2, and compare the TSD and one-step deposition methods.
Fig. 1 shows the SEM image of spiro-OMeTAD/perovskite/TiO2 mesoporous layer/TiO2 blocking layer film using one step coating and TSD to prepare perovskite.
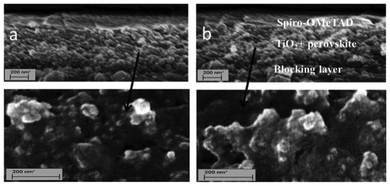 | ||
| Fig. 1 SEM image of spiro-OMeTAD/perovskite + TiO2/blocking layer/FTO using different method a: one-step deposition, b: TSD method. | ||
It is shown that there is no or a very thin perovskite overstanding layer for the two samples. This means that the perovskite can penetrate into the TiO2 mesoporous layer very well for both methods. Fig. 2 shows the UV-vis absorption spectra and images of the spin-coated PbI2 film and CH3NH3PbI3 (TSD and one-step spin-coating). It is obvious that the perovskite films processed from the one-step spin-coated and TSD methods have similar optical properties, with a strong absorption ranging from 400 nm to 800 nm. Although we use a lower concentration of PbI2, compared with the one-step spin-coating method, the perovskite prepared from TSD has a darker color and stronger absorption, indicating that more perovskite is deposited, which manifests the advantage of the TSD method. The detailed mechanism for the higher deposited amount of perovskite using the TSD method is not completely clear, but the higher solubility of PbI2 in DMF used in the TSD may result in a better pore filling in the first step of the TSD process, since the overstanding layer of perovskite is very thin (from the SEM pictures in Fig. 1). From the SEM pictures it is difficult to say anything about the pore-filling of spiro-OMeTAD, but the overstanding layer thickness seem to be rather similar (and thin) for the two methods. However, since the perovskite pore filling seems to be better for the TSD sample, we expect that the pores will be smaller due to the perovskite and therefore that the spiro-OMeTAD is more difficult to infiltrate.
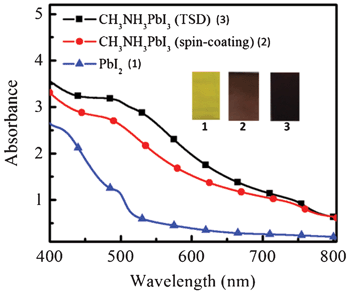 | ||
| Fig. 2 UV-vis spectra and images of spin coated PbI2 (1) film, and CH3NH3PbI3 prepared from spin-coating (2) and TSD method (3). The materials were deposited on nanoporous TiO2 layer/TiO2 blocking layer/FTO, which was also used as a background in the UV-vis measurement. | ||
The photovoltaic performance and the incident photon to current conversion efficiency (IPCE) of the spiro-OMeTAD/CH3NH3PbI3/ZrO2 and TiO2 solar cell devices are shown in Fig. 3.
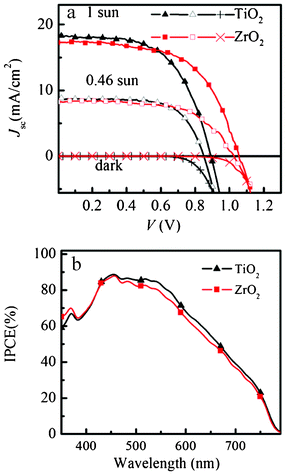 | ||
| Fig. 3 J–V curve in the dark and under AM 1.5G illumination of 1000 W m−2 and 460 W m−2 intensity. IPCE spectra of spiro-OMeTAD/CH3NH3PbI3/ZrO2 and spiro-OMeTAD/CH3NH3PbI3/TiO2 solar cell. | ||
For the ZrO2 solar cell, a power conversion efficiency (η) of 10.8% and 11.4% was achieved under AM 1.5 illumination of 1000 W m−2 (1 sun) and 460 W m−2, respectively. Under 1 sun, Voc = 1.07 V, fill factor (FF) = 0.59 and Jsc = 17.3 mA cm−2 were achieved. This result is very similar to the results (Jsc = 17.8 mA cm−2, Voc = 0.98 V, and FF = 0.63, η = 10.9%) reported by Snaith and co-workers using Al2O3 as a “scaffold” layer.9 We use a TiO2 solar cell to optimize this TSD method (supporting information†). The best solar cell shows a power conversion efficiency of 9.5% and 10.7% under AM 1.5 illumination of 1000 W m−2 and 460 W m−2, respectively. Under 1 sun, Voc = 0.89 V, FF = 0.58 and Jsc = 18.3 mA cm−2 were achieved, which is slightly higher compared to our previous result (η = 8.5%, Voc = 0.85 V, FF = 0.68 and Jsc = 14.7 mA cm−2).19 Obviously, using TSD we can obtain a higher Jsc, which is probably because the one-step spin-coating method has a solubility limitation, while using TSD a higher amount of perovskite can be deposited, as it is shown in the UV-vis spectra in Fig. 2. Comparing the performance for the solar cells based on ZrO2 and TiO2 using TSD, the major difference is in Voc, which we purpose is due to different charge transfer mechanism for the solar cells based on TiO2 and ZrO2. The perovskite conduction band edge has an energy that is higher than the TiO2 conduction band edge, and the difference has been estimated to about 0.1 eV based on ultraviolet photoelectron spectroscopy measurements.8 Although these measurements do not consider interface effects between the perovskite and the TiO2, the results indicate that electrons excited in the perovskite may be injected into the TiO2 (see Scheme 1).
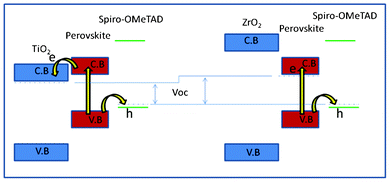 | ||
| Scheme 1 Schematic description of the energy levels in the two solar cell interfaces and a model for the charge separation processes. | ||
For ZrO2, the band-gap is larger, and the conduction band is most probably much higher in energy than the perovskite conduction band, and electron injection into ZrO2 is therefore not possible, and the excited electron stays in the perovskite. After excitation in the perovskite, the electron can therefore be transferred to a lower energy in the conduction band of TiO2, whereas in the solar cell based on ZrO2, the electron stays in the conduction band of the perovskite. Recently, for TiO2 based solar cells, it was reported that the CH3NH3PbI3 exhibits an ambipolar character, with a predominantly p-type behaviour.20 However, in the ZrO2 based solar cell, we suggest that there is no charge separation between ZrO2/CH3NH3PbI3, and the electrons stay inside the perovskite and holes transfer to the spiro-OMeTAD. Therefore, we suppose the CH3NH3PbI3 both may have p-type and n-type character.
This simple model shows that the difference in the maximum voltage possible to obtain in the two solar cells is different, due to the lower energy of the conduction band edge of TiO2 compared to conduction band edge of the perovskite. This is similar to the suggested mechanism for CH3NH3PbI3−xClx on Al2O3, which also resulted in high photovoltage.
The fill factor (FF) depends on the series and shunt resistance of the cell.21 Using TSD, both ZrO2 and TiO2 solar cells show a similar FF, which suggests that the series and shunt resistance of the two solar cells are similar. The TiO2 solar cell prepared using TSD shows a lower FF compared with the solar cell prepared with the one-step spin-coating method, indicating a higher series resistance and lower shunt resistance in the solar cell prepared by TSD. Both ZrO2 and TiO2 solar cells show photocurrent in the visible region between 400 and 800 nm, which shows that the perovskite light absorber is efficient for these thin film solar cells. Compared with the one-step spin-coating method, it is obvious that the IPCE is relatively broader for the solar cell prepared with TSD, indicating larger light harvesting efficiency. The integration of the IPCE spectra with respect to the AM1.5G photon flux yields photocurrents that are slightly lower than the measured Jsc values (15.8 and 15.0 mA cm−2 for TiO2 and ZrO2). The reason may be the slightly non-linear intensity dependence of the photocurrent (see below) and possibly a temperature effect, and is still under investigation.
The dependence of short-circuit current (Jsc) on light intensity (I) is shown in Fig. 4a.
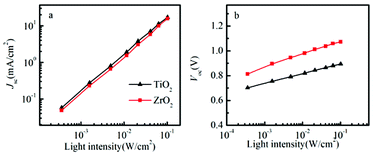 | ||
| Fig. 4 The light intensity dependence of Jsc (a) and Voc (b) in spiro-OMeTAD/CH3NH3PbI3/ZrO2 (or TiO2) solar cells. | ||
A power law dependence of Jsc on I, i.e., Jsc∝Iα, where α is 1.02 and 1.01 for ZrO2 and TiO2 solar cell, indicating that charge collection efficiency is rather independent of light intensity, which also may indicate sufficient electron and hole mobility, and non-space-charge limited photocurrents.22,23 In solid-state DSSCs, the Voc is determined by the difference between the quasi Fermi level of electrons in TiO2 under illumination and the quasi Fermi level of holes in the hole conductor.24 Fig. 4b shows that the Voc increases with the light intensity.
The slope in Voc versus intensity was about 105 mV per decade for the ZrO2 based solar cell and 78 mV per decade for the TiO2 based solar cell. Notably, it is higher than the value of 59 mV per decade that is expected in dye-sensitized solar cells, when recombination of conduction band electron from the metal oxide to the redox electrolyte shows first order kinetics. It seems a reasonable approximation that the doping level of the spiro-OMeTAD does not change much when the light intensity is varied, and that the Fermi level in the spiro-OMeTAD can be considered rather constant, since the LiTFSI concentration added to spiro-OMeTAD is rather high.25 For TiO2, deviation from first order recombination kinetics can be attributed to TiO2 trap-assisted recombination, inhomogeneous recombination due to the variations in pore-filling efficiency of the perovskite and the spiro-OMeTAD. For the solar cell based on ZrO2, we note that the slope is higher than that of the solar cell based on TiO2, and the deviation from first order kinetics is therefore higher for the recombination between electrons in the perovskite and holes in the spiro-OMeTAD.
The transient Voc decay experiment was used to measure the electron lifetime (τe). The electron lifetime depends on the concentration of electrons and holes in the solar cell. Therefore the electron lifetime is strongly influenced by the applied voltage or light illumination intensity. The measured τe is shown as a function of light intensity and the decrease in τe at higher light intensity is attributed to relatively faster recombination, which has been reported before in DSSCs, and it is probably due to the nature of bimolecular recombination that scales as the product of the electron and hole number density and due to the increased mobility in the oxide.26 In Fig. 5a, we can see that the electron lifetime is shorter in the solar cell based on TiO2, compared to the solar cell based on ZrO2, compared at the same voltage.
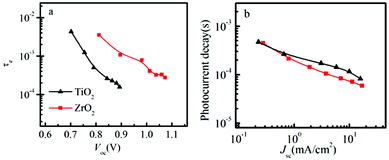 | ||
| Fig. 5 (a) Electron lifetime as a function of open circuit voltage in spiro-OMeTAD/CH3NH3PbI3/ZrO2 (or TiO2) solar cells. (b) Photocurrent transient decay as a function of short-circuit current in spiro-OMeTAD/CH3NH3PbI3/ZrO2 (or TiO2) solar cells. | ||
If we use the model described in Scheme 1, this may be explained by the lower energy of the TiO2 conduction band, which therefore is filled with electrons at lower voltage compared to the perovskite conduction band. The filling of the TiO2 conduction band therefore increase the possibility for recombination due to the higher concentration of charges at a lower voltage. This may partly explain the difference in electron lifetimes, but other factors, for example trap states, may also be important. Comparing the electron lifetime for the TiO2 solar cell and perovskite prepared by TSD with the electron lifetime for the TiO2 solar cell prepared by the one-step spin-coating method,19 they are quite similar, indicating rather similar properties of perovskite obtained from the two methods.
In Fig. 5b, the transient current decay is monitored. The time constant is observed to decrease with increasing light intensity, which in the DSSC usually is attributed to trap states having an exponential distribution of energies.27 We observe that the transient current decay for the solar cell based on ZrO2 is rather similar compared to that based on TiO2, which indicates that the charge transport time (ttr) may be rather similar for the two systems. Additionally, the ttr of the TSD is 3 times slower than the spin-coating method, which indicating that the ttr is dependent on the preparation procedure of the perovskite layer, which may be an effect of for example different interface formation between the TiO2 and the perovskite. More work will be done to investigate the perovskite property and details of the interface between perovskite and TiO2, but it is not within the scope of this report. Although ZrO2(CH3NH3PbI3) and Al2O3(CH3NH3PbI3−xClx) exhibit comparable efficiency and similar charge transfer mechanism, the perovskite in the two system are different, more work will be done in the future to compare the charge recombination and transporation using same perovskite for the ZrO2 and Al2O3 solar cell.
Conclusions
In summary, TSD is expected to be particularly useful for preparing films of organic-inorganic systems in which the organic and inorganic components have incompatible solubility characteristics, or for systems in which the organic component is difficult to evaporate. Also, the absence of vacuum preparation steps in the TSP used in this report may result in low-cost solar cells. A high efficiency of 10.8% was achieved for ZrO2 solar cell under AM 1.5G illumination of 1000 W m−2. Comparing TSD and the one-step spin-coating method in TiO2 solar cell, it is shown that the Jsc can be higher because of a larger amount of perovskite that can be deposited by TSD method because of better solubility. Voc for the solar cell based on ZrO2 is higher, which is the reason for the higher efficiency. A model based on electron transfer from the perovskite to TiO2 after light illumination, in contrast to that the electron stay in the perovskite after excitation in the solar cell based on ZrO2. This may explain the different open-circuit voltage as well as the longer lifetime observed in the solar cell based on ZrO2.Acknowledgements
We thank the Swedish Energy Agency, the STandUP for Energy program, the Swedish Research Council (VR), the Göran Gustafsson Foundation and the Knut and Alice Wallenberg Foundation.References
- A. Hagfeldt, G. Boschloo, L. Sun, L. Kloo and H. Pettersson, Chem. Rev., 2010, 110, 6595–6663 CrossRef CAS PubMed.
- A. Yella, H. W. Lee, H. N. Tsao, C. Y. Yi and A. K. Chandiran, Science, 2011, 334, 629–634 CrossRef CAS PubMed.
- L. Schmidt-Mende, A. Fechtenkotter, K. Mullen, E. Moons, R. H. Friend and J. D. MacKenzie, Science, 2001, 293, 1119–1122 CrossRef CAS PubMed.
- P. V. Kamat, K. Tvrdy, D. R. Baker and J. G. Radich, Chem. Rev., 2010, 110, 6664–6688 CrossRef CAS PubMed.
- U. Bach, D. Lupo, P. Comte, J. E. Moser, F. Weissortel, J. Salbeck, H. Spreitzer and M. Gratzel, Nature, 1998, 395, 583–585 CrossRef CAS PubMed.
- D. B. Mitzi, C. A. Feild, W. T. A. Harrison and A. M. Guloy, Nature, 1994, 369, 467–469 CrossRef CAS.
- Y. Takeoka, K. Asai, M. Rikukawa and K. Sanui, Chem. Commun., 2001, 2592–2593 RSC.
- H. S. Kim, C. R. Lee, J. H. Im, K. B. Lee, T. Moehl, A. Marchioro, S. J. Moon, R. Humphry-Baker, J. H. Yum, J. E. Moser, M. Gratzel and N. G. Park, Sci Rep-Uk, 2012, 2, 591 Search PubMed.
- M. M. Lee, J. Teuscher, T. Miyasaka, T. N. Murakami and H. J. Snaith, Science, 2012, 338, 643–647 CrossRef CAS PubMed.
- J. H. Noh, S. H. Im, J. H. Heo, T. N. Mandal and S. I. Seok, Nano Lett, 2013, 13, 1764–1769 CAS.
- J. M. Ball, M. M. Lee, A. Hey and H. J. Snaith, Energy Environ Sci, 2013, 6, 1739–1743 CAS.
- N. Kitazawa, K. Enomoto, M. Aono and Y. Watanabe, J. Mater. Sci., 2004, 39, 749–751 CrossRef CAS.
- M. Era, T. Hattori, T. Taira and T. Tsutsui, Chem. Mater., 1997, 9, 8 CrossRef CAS.
- K. N. Liang, D. B. Mitzi and M. T. Prikas, Chem. Mater., 1998, 10, 403–411 CrossRef CAS.
- K. Pradeesh, J. J. Baumberg and G. V. Prakash, Appl Phys Lett, 2009, 95, 173305 CrossRef.
- Y. N. Xia and G. M. Whitesides, Annu. Rev. Mater. Sci., 1998, 28, 153–184 CrossRef CAS.
- Z. Y. Cheng and J. Lin, CrystEngComm, 2010, 12, 2646–2662 RSC.
- J. Burschka, N. Pellet, S. J. Moon, R. Humphry-Baker, P. Gao, M. K. Nazeeruddin and M. Gratzel, Nature, 2013, 499, 316–319 CrossRef CAS PubMed.
- D. Bi, L. Yang, G. Boschloo, A. Hagfeldt and E. M. J. Johansson, J. Phys. Chem. Lett., 2013, 4, 1532–1536 CrossRef CAS.
- J. H. Heo, S. H. Im, J. H. Noh, T. N. Mandal, C.-S. Lim, J. A. Chang, Y. H. Lee, H.-j. Kim, A. Sarkar, M. K. Nazeeruddin, M. Gratzel and S. I. Seok, Nat. Photonics, 2013, 7, 486–491 CrossRef CAS.
- A. J. Frank, N. Kopidakis and J. v. d. Lagemaat, Coord. Chem. Rev., 2004, 248, 1165–1179 CrossRef CAS PubMed.
- L. J. A. Koster, V. D. Mihailetchi, H. Xie and P. W. M. Blom, Appl. Phys. Lett., 2005, 87, 203502 CrossRef.
- J. B. Sambur, T. Novet and B. A. Parkinson, Science, 2010, 330, 63–66 CrossRef CAS PubMed.
- L. Yang, U. B. Cappel, E. L. Unger, M. Karlsson, K. M. Karlsson, E. Gabrielsson, L. Sun, G. Boschloo, A. Hagfeldt and E. M. J. Johansson, Phys. Chem. Chem. Phys., 2012, 14, 779–789 RSC.
- R. Scholin, M. H. Karlsson, S. K. Eriksson, H. Siegbahn, E. M. J. Johansson and H. Rensmo, J. Phys. Chem. C, 2012, 116, 26300–26305 Search PubMed.
- A. Petrozza, C. Groves and H. J. Snaith, J. Am. Chem. Soc., 2008, 130, 12912–12920 CrossRef CAS PubMed.
- J. van de Lagemaat and A. J. Frank, J. Phys. Chem. B, 2001, 105, 11194–11205 CrossRef CAS.
Footnote |
| † Electronic supplementary information (ESI) available: Supplementary information includes experimental methods and sample preparation description. See DOI: 10.1039/c3ra43228a |
| This journal is © The Royal Society of Chemistry 2013 |
