 Open Access Article
Creative Commons Attribution 3.0 Unported Licence
The application of inelastic neutron scattering to investigate the ‘dry’ reforming of methane over an alumina-supported nickel catalyst operating under conditions where filamentous carbon formation is prevalent
Andrew R.
McFarlane
a,
Ian P.
Silverwood
a,
Robbie
Warringham
a,
Elizabeth L.
Norris
b,
R. Mark
Ormerod
b,
Christopher D.
Frost
c,
Stewart F.
Parker
c and
David
Lennon
*a
aSchool of Chemistry, Joseph Black Building, University of Glasgow, Glasgow, G12 8QQ, UK. E-mail: David.Lennon@glasgow.ac.uk; Tel: 0141-330-4372
bSchool of Physical and Geographical Sciences, Keele University, Staffs, ST5 5BG, UK. E-mail: r.m.ormerod@keele.ac.uk; Tel: 0178-2 73-3475
cISIS Facility, STFC Rutherford Appleton Laboratory, Chilton, Didcot, Oxon OX11 0QX, UK. E-mail: stewart.parker@stfc.ac.uk; Tel: 0123-544-6182
First published on 10th July 2013
Abstract
The use of CO2 in reforming methane to produce the industrial feedstock syngas is an economically and environmentally attractive reaction. An alumina-supported nickel catalyst active for this reaction additionally forms filamentous carbon. The catalyst is investigated by inelastic neutron scattering as well as elemental analysis, temperature-programmed oxidation, temperature-programmed hydrogenation, X-ray diffraction, transmission electron microscopy and Raman scattering. Isotopic substitution experiments, using 13CO2 for 12CO2, show the oxidant to contribute to the carbon retention evident with this sample. At steady-state operation, a carbon mass balance of 95% is observed. A kinetic scheme is proposed to account for the trends observed.
1. Introduction
Syngas (CO + H2) is a vital feedstock for chemical manufacturing industries,1 with the steam reforming of methane being a well established production route, eqn (1).2 An alternative to this energy intensive process is to use carbon dioxide as the oxidant, in the so called ‘dry’ reforming process, eqn (2).3,4| CH4 + H2O → CO + 3H2 | (1) |
| CH4 + CO2 → 2CO + 2H2 | (2) |
The dry reforming reaction has strong environmental credentials and yields a product mixture suited to up-stream processes such as the Fischer–Tropsch synthesis of relatively high molecular weight hydrocarbons.5,6 Supported nickel catalysts are often utilised for both steam and dry methane reforming reactions,7 with the latter reaction in particular being plagued by rapid deactivation issues compared to noble metals (e.g. Pt, Pd), as characterised by excessive carbon retention by the heterogeneous catalyst.8–10 The topic of syngas production has been comprehensively reviewed by Rostrup-Nielsen and Christiansen.2
Against this background, it is desirable to secure a better understanding of the processes that lead to diminished activity with increasing time-on-stream for representative dry reforming catalysts. An important parameter in understanding how the catalysts are operating is being able to determine how hydrogen is partitioned within the carbonaceous matrix that ultimately impedes conversion. Previous work from this research team has shown how the technique of inelastic neutron scattering (INS) can be used to characterise alumina-supported nickel catalysts active for the dry reforming of methane.11,12 Specifically, INS has been used to quantify the degree of hydrogen retention by the catalyst after a period of continuous activity. Importantly, that work showed both an alumina-supported nickel catalyst and a gold-modified variant to be highly efficient at cycling hydrogen.13 Further, the determination of C![[thin space (1/6-em)]](https://www.rsc.org/images/entities/char_2009.gif) :
:![[thin space (1/6-em)]](https://www.rsc.org/images/entities/char_2009.gif) H ratios for the retained overlayers associated with these catalysts led to a proposed reaction scheme that accounted for a reduction in syngas selectivity which pivoted on the fate of adsorbed carbon atoms at the nickel surface. Namely, carbon retention was attributed to an enhanced rate of polymerisation (eqn (3)) relative to the rate of oxidation of the adsorbed carbon atoms:13
H ratios for the retained overlayers associated with these catalysts led to a proposed reaction scheme that accounted for a reduction in syngas selectivity which pivoted on the fate of adsorbed carbon atoms at the nickel surface. Namely, carbon retention was attributed to an enhanced rate of polymerisation (eqn (3)) relative to the rate of oxidation of the adsorbed carbon atoms:13
| n C (ad) → Cn(s). | (3) |
The ‘s’ subscript in eqn (3) refers to solid carbon. In the previous study,13 the combination of catalyst composition, catalyst sample history and reaction conditions resulted in an overlayer predominantly comprised of amorphous carbon.
Methane reforming on an industrial scale is more typically compromised by the formation of filamentous carbon.14 Here, ‘whisker’ formation is prevalent and it is often the loss of mechanical strength of the catalyst matrix that induces the need for a replacement catalyst charge. The phenomenon of ‘whisker’ formation in methane reforming reactions is described elsewhere.2,15,16
The form of the carbon produced during dry methane reforming over supported metal catalysts is known to be sensitive to catalyst composition, reaction conditions and sample history.17–20 Joo and Jung15 and Chen and Ren21 have also signified the importance of calcination temperature. This paper examines a different alumina-supported nickel catalyst to that reported previously which, in addition to sustaining methane reforming, simultaneously produces filamentous rather than amorphous carbon at the gas-solid interface. The formation of amorphous carbon reported in our previous study examined a high loading alumina-supported nickel catalyst which had been calcined at 1173 K; this study uses a catalyst prepared using a different support material, a lower metal loading and a milder calcination temperature of 873 K. The latter parameter minimizes the undesirable possibility of forming nickel aluminates.21–23 This work examines a candidate methane dry reforming catalyst that operates within a regime favoring formation of filamentous rather than amorphous carbon. Specifically, in this case, the carbon polymerization process (eqn (3)) is best represented by eqn (4),
| n C (ad) → Cn (filamentous). | (4) |
Post-reaction, the catalyst is investigated by inelastic neutron scattering as well as elemental analysis, temperature-programmed oxidation, temperature-programmed hydrogenation, X-ray diffraction, transmission electron microscopy and Raman scattering.
The kinetic scheme proposed in our previous work was based around an appreciation of how hydrogen was partitioned within the reaction system, with the scheme highlighting the relevance of a number of elementary reactions. Other workers have used isotopic substitution experiments to help elucidate mechanistic steps in methane dry reforming over various catalysts. For example, Verykios has suggested that the major source of coke in dry reforming over supported rhodium catalysts is from the CO2 oxidant, and that the hydrogen content of the carbonaceous overlayer is negligible.24 Further, Iglesia and co-workers have examined supported ruthenium catalysts, with that work confirming C–H bond activation to be rate-limiting and that the water gas shift reaction is in equilibrium under reaction conditions.25 Mirodatos and co-workers have made extensive use of isotopes to look at the elementary steps that occur in CO2 reforming of methane.26–29 Specifically, SSITKA and TAP reactors have been used to determine isotopic scrambling of carbon and hydrogen during reaction.
In this work, we use micro-reactor isotopic substitution experiments, replacing 12CO2 with 13CO2, to explore the role of the carbon dioxide in the carbon laydown process over an alumina-supported nickel catalyst. In the light of the INS experiments that quantify retained hydrogen, these studies permit an elaboration of the previously postulated reaction scheme for supported nickel catalysts13 that additionally accommodates whisker formation. Moreover, carbon mass balance measurements show the carbon deposition process (with the carbon sourced from methane and oxidant) to be a minority process. This makes the dry reforming reaction an example of a reaction where an environmental pollutant can be efficiently utilised to yield a valuable chemical primary feedstock, i.e. syngas.
2. Experimental
2.1 Catalyst preparation and reaction testing
A 26% (w/w) Ni/Al2O3 catalyst was prepared by wet impregnation of α-alumina (Alfa Aesar, 99.98%, <1 micron APS powder, surface area 10 m2 g−1) with nickel nitrate hexahydrate, Ni (NO3)2·6H2O, (Acros Organics, 99%). The mixture was stirred whilst heating at 353 K. Water was driven off from the suspension using a hot plate, before drying in an oven at 393 K for six days. The material was then calcined in static air by heating in a furnace (Carbolite RHF 1600) to 773 K at 1 K min−1, then to 873 K at 5 K min−1. This temperature was maintained for one hour before cooling the sample to room temperature at 10 K min−1. Following calcination, the catalyst was ground using a pestle and mortar and sieved to a particle size <106 μm using a stainless steel Laboratory Test Sieve (BS410/1986).2.2 Micro-reactor measurements
Catalytic performance was evaluated using a micro-reactor arrangement. Mass flow controllers (Hastings HFC302 linked to a Teledyne THPS-400 controller) meter gas into the flow system which was constructed from 1/8′′ diameter stainless steel tubing that was trace heated at 363 K. The reactor comprised a 6 mm outside diameter quartz tube connected to the stainless steel lines via 1/4′′ compression fittings (Cajon). The reactor was housed within a tube furnace (Carbolite MTF 10/15/30) equipped with PID control. Approximately 10 mg of the catalyst was loaded into the reactor between quartz wool plugs. Gas flows were mixed before the reactor in a volume containing glass beads to ensure a turbulent flow, and a reactor bypass allowed the gases to be sampled without catalyst contact. Prior to reaction, the catalyst was reduced for 2 h at 1123 K under a flow of 3 sccm/min H2 (BOC, 99.999%) in 40 sccm/min He (BOC, 99.999%). Isotope studies used 5.6 sccm/min CH4 (CK gas, 99.95%) with either 5.6 sccm/min CO2 of natural isotopic abundance (CK gas, 99.995%), hereafter referred to as 12CO2, or 13CO2 (Cambridge Isotope Laboratories 99% 13C) diluted in 40 sccm/min He as before. The reaction conditions provide a gas hourly space velocity (GHSV) of 2.4 × 10⁴ h−1 and a space time of 0.15 s.30 All reactions were performed at least in duplicate and the results displayed here are consistent with the other measurements.Temperature-programmed oxidation was carried out in situ after reaction using 42.1 sccm/min of a 5% O2/He mix (BOC) with a ramp to 1223 K at 10 K min−1. The instrumental response was calibrated by oxidation of known masses of graphite (Sigma-Aldrich, >99.5%), as well as the thermal decomposition of calcium carbonate (BDH, >98%). Temperature-programmed hydrogenation (TPH) experiments were performed in situ using 5 sccm H2 diluted in 40 sccm He with a ramp to 1223 K at 10 K min−1. Reaction monitoring for all of these experiments used a quadrupole mass spectrometer (Hiden HPR 20), which was attached to the reactor exit line via a differentially-pumped, heated quartz capillary. The raw data were normalized against the total recorded pressure to remove the effects of pressure variation and to give a percentage composition of the exhaust gases. A K-type thermocouple in contact with the quartz wool support at the exit side of the catalyst bed monitored catalyst temperature, with the data recorded using the mass spectrometer software.
Initial micro-reactor measurements were recorded in a temperature-programmed mode (300–1150 K). The results from those runs were used to select a temperature for isothermal measurements. The isothermal temperature selected (898 K) for the micro-reactor was also used in the INS experiments.
2.3 Inelastic neutron scattering measurements
INS measurements were performed at the ISIS Facility of the STFC Rutherford Appleton Laboratory using the MAPS spectrometer with the ‘A’ chopper package.13,31 Two incident energies were used: 4840 and 2017 cm−1. A large volume flow-through Inconel™ reactor was used for these measurements. The construction of the reactor and its connection to a dedicated gas handling facility is described elsewhere.32 Approximately 10 g of the catalyst was loaded between quartz wool plugs in to the reactor. A mass spectrometer (LedaMass Spectra Microvision Plus) analyzed the eluting gases of the exit stream. The mass spectrometer was not calibrated for the reactants or products, so the resulting profile only indicates relative trends in gas composition over the reaction period. The sample was reduced at 883 K for 2 h in a flow of 50 sccm/min H2 (CK gas, 99.999%) in 1500 sccm/min He (Air products 99.9992%). The H2 was then purged from the system with He whilst cooling, before the catalyst was isolated under the inert gas and transferred to the spectrometer for the background spectrum to be recorded at 20 K.After the background spectrum had been recorded, the cell was removed from the spectrometer and re-connected to the gas handling system. The dry methane reforming reaction was then initiated by establishing flows of 80 sccm/min CH4 (CK gas, 99.95%), 80 sccm/min CO2 (CK gas, 99.995%) and 1500 sccm/min He (GHSV = 1.2 × 10⁴ h−1, space time = 0.3 s) and heating the catalyst to 898 K. These conditions were maintained for 6 h, at which point heating was stopped, the reactor purged, cooled and isolated prior to transfer back to the spectrometer. Background subtraction procedures were adopted for the work presented here, where the spectrum of the reduced catalyst was subtracted from the spectrum of the reacted catalyst. In this way, spectra only relate to material changes formed during the reaction stage, and contributions hidden by strong signals of the unchanged catalyst may become apparent. All INS spectra were recorded at 20 K.31
2.4 Post reaction analysis of INS samples
Elemental analyses were carried out using an Exeter Analytical C440 Elemental Analyser. Temperature-programmed oxidation and hydrogenation measurements of post-reaction INS samples were undertaken by loading ca. 10 mg of reacted sample into the quartz micro-reactor and performing comparable procedures to those described for the in situ TPO measurements (Section 2.2). Visual inspection of the pre- and post-TPO samples showed the samples had changed from black to green indicating that the TPO runs had fully oxidised the residual carbon.Transmission electron microscopy (TEM) measurements were undertaken using a Technai T20 microscope with an accelerating voltage of 200 keV. Samples were dispersed in methanol before being deposited on holey carbon film (300 μm mesh grid, Agar scientific) prior to inspection. Elemental mapping was performed via energy filtered imaging of the nickel, carbon and oxygen K-edges (40, 20 and 35 eV slit widths for 855, 284 and 532 eV energy levels respectively) using a Gatan image filter. Powder X-ray diffraction measurements were carried out on a Siemens D5000 diffractometer with a Cuα source and Be detector. Approximately 200 mg of sample were placed in a rotating sample holder. Measurements were taken from 5–85° at 1.3° min−1.
Raman scattering measurements of the post-reaction INS samples were recorded on a Horiba Jobin Yvon LabRam HR confocal Raman microscope using 532 nm laser excitation, taking care to ensure that no laser-induced decomposition occurred. Temperature-programmed hydrogenation/Raman scattering experiments were performed by loading ca. 5 mg of a post-reaction sample into a Linkam CCR1000 environmental chamber interfaced to the Raman spectrometer. The cell was then heated at 10 K min−1 to 700 K under a 10 sccm N2/H2 mix for 30 min before re-recording the Raman spectrum.
3. Results
This section is comprised as follows. Firstly, catalyst test results are presented which were recorded using a micro-reactor arrangement, including in situ temperature-programmed oxidation and hydrogenation measurements. The reaction was next scaled up and reaction test data obtained for the larger INS reactor. The reaction was then quenched33,34 and the catalyst analyzed by INS. Post-reaction, the INS sample was then characterized by a combination of elemental analysis, temperature-programmed oxidation, X-ray diffraction, transmission electron microscopy and Raman scattering. Finally, isotopic substitution experiments are presented that are performed using the micro-reactor arrangement.3.1 Micro-reactor and INS reactor measurements plus post-reaction temperature programmed oxidation and hydrogenation measurements
Fig. 1 shows the temperature-programmed profile for the dry reforming of methane over the Ni/Al2O3 catalyst over the temperature range 300–1150 K. Reaction commenced at about 650 K, with full conversion of methane seen by 1050 K. CO2 consumption is not complete at this stage and levels out at higher temperatures. This may reflect water gas shift activity, eqn (5).| CO + H2O → CO2 + H2 | (5) |
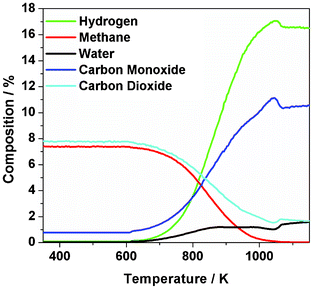 | ||
Fig. 1 Temperature-programmed reaction profile (375–1150 K) for a 1![[thin space (1/6-em)]](https://www.rsc.org/images/entities/char_2009.gif) : :![[thin space (1/6-em)]](https://www.rsc.org/images/entities/char_2009.gif) 1 mixture of CH4 and CO2 over Ni/Al2O3 catalyst. Measurements performed using the micro-reactor arrangement using a heating rate of 10 K min−1. 1 mixture of CH4 and CO2 over Ni/Al2O3 catalyst. Measurements performed using the micro-reactor arrangement using a heating rate of 10 K min−1. | ||
The presence of water is evident during the region where syngas is produced, indicating a role for the reverse water gas shift reaction, eqn (6).
| CO2 + H2 → CO + H2O | (6) |
Comparable trends for catalyst performance are reported elsewhere.35–37
A temperature of 898 K was selected as being within the operational range of the INS cell32 as well as providing significant catalytic activity. Fig. 2 (a) shows the reaction profile for the micro-reactor isothermal measurements (898 K) that corresponded to an initial methane conversion of approximately 51%. A modest degree of deactivation was apparent over the initial period of reaction, as evidenced by gradual CH4 and CO2 breakthrough alongside falling H2 and CO levels. The extent of deactivation was different for the two products: although H2 formation was reduced by approximately 24% over 330 min, CO formation was only reduced by approximately 9% over the same period. Despite these reductions in product yields, it is noted that sustained syngas production remains prevalent throughout the reaction period presented. The reaction approximates to steady-state operation at 360 min.
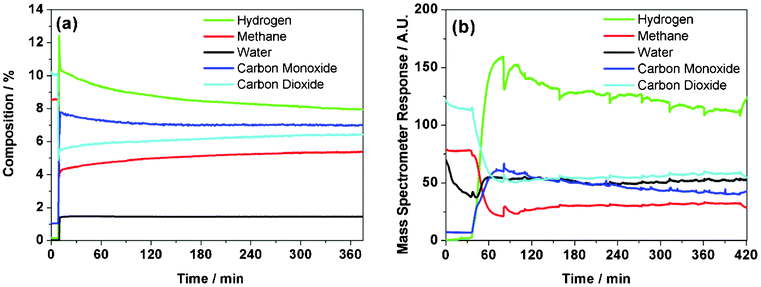 | ||
Fig. 2 Isothermal reaction profiles at 898 K of a 1![[thin space (1/6-em)]](https://www.rsc.org/images/entities/char_2009.gif) : :![[thin space (1/6-em)]](https://www.rsc.org/images/entities/char_2009.gif) 1 mixture of CH4 and CO2 over Ni/Al2O3 catalyst using (a) micro-reactor arrangement and (b) INS reactor arrangement. 1 mixture of CH4 and CO2 over Ni/Al2O3 catalyst using (a) micro-reactor arrangement and (b) INS reactor arrangement. | ||
The carbon mass balance corresponding to Fig. 2 (a) is presented in Fig. 3. Upon initiation of reaction, there is an abrupt loss of carbon from the gaseous phase, momentarily decreasing to 77% (i.e. a mass imbalance of 23%). This rapidly recovers to 89% then, over a period of approximately 340 min, increases asymptotically to a value of 95%. Thus, Fig. 3 shows that, for an isothermal run at 898 K, the majority of the carbon laydown takes place at the start of the reaction coordinate. Thereafter, as the system approaches steady-state operation, as signified by stable production of carbon monoxide and hydrogen (Fig. 2), a carbon mass balance of 95% is achievable. This analysis is informative as it illustrates that a prevalent atmospheric pollutant can be used as an oxidant to continually produce useful chemical reagents (syngas) in a relatively efficient manner. Although the carbon retention by the catalyst is cumulative, the extent of this retention is by no means excessive (ca. 5% at steady-state operation), with the resulting carbon then constrained within a solid matrix. Certainly, the use of carbon dioxide as an oxidant in methane reforming reactions has clear environmental benefits.
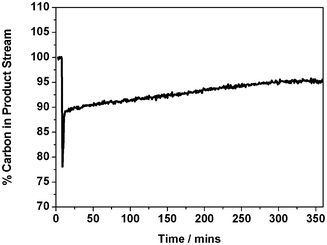 | ||
Fig. 3 Carbon mass balance for isothermal reaction at 898 K of a 1![[thin space (1/6-em)]](https://www.rsc.org/images/entities/char_2009.gif) : :![[thin space (1/6-em)]](https://www.rsc.org/images/entities/char_2009.gif) 1 mixture of CH4 and CO2 over Ni/Al2O3 catalyst in the quartz micro-reactor. 1 mixture of CH4 and CO2 over Ni/Al2O3 catalyst in the quartz micro-reactor. | ||
The reaction profile for the INS reactor measurements is presented in Fig. 2 (b), with the larger reactor configuration operating at a reduced GHSV (longer space time) compared to the more conventional micro-reactor arrangement. As discussed in Section 2.3, the profile of the INS reactor exit stream is only intended to indicate relative trends in gas composition as the catalyst is brought on-line and the reaction stabilized. The apparent delay seen at the beginning of the reaction profile is due to a combination of the reactor attaining reaction temperature and the switching of the gas feed from the by-pass line. The data from 60 min onwards define the actual reaction profile. Fig. 2 (b) shows conversion of the CH4 and CO2 with concomitant production of H2 and CO. As with the isothermal micro-reactor profile (Fig. 2 (a)), some degree of deactivation is apparent for continuing time-on-stream. The glitches evident in Fig. 2 (b) are believed to originate from occasional perturbations to the gas flow as the gases pass through the extended catalyst bed and are not thought to be significant to the overall chemical transformation process. Qualitatively, comparable trends seen with the micro-reactor are replicated in the INS reactor. However, during the course of the reaction in the larger volume INS cell the pressure measured before the reactor rose gradually from slightly above atmospheric pressure to 9.6 bar. Weighing the reactor after reaction indicated an increase in catalyst mass corresponding to 53.2% carbon, that was attributed to increased flow resistance within the catalyst bed. This carbon is associated with the cumulative mass imbalance evident in Fig. 3.
The results of elemental analysis (C and H) of catalyst samples extracted from the INS reactor after the 6 h reaction period reaction are presented in Table 1. No hydrogen response was observed, indicating that the hydrogen content of the sample was below the 0.3% detection limit of the instrument for this element. Carbon values determined for a number of samples taken from different regions of the INS reactor were 45–48%. This value is broadly comparable to the value obtained by weighing the INS reactor after reaction (53%).
![[thin space (1/6-em)]](https://www.rsc.org/images/entities/char_2009.gif) :
:![[thin space (1/6-em)]](https://www.rsc.org/images/entities/char_2009.gif) 1 mixture of CH4 and CO2 at 898 K for 6 h
1 mixture of CH4 and CO2 at 898 K for 6 h
| Technique | Elemental form | Quantity |
|---|---|---|
| Elemental analysis | Carbon | 45–48% |
| Hydrogen | <0.3% | |
| Temperature-programmed oxidation | Carbon (micro-reactor) | 51.1 ± 4.1 mmol C g−1(cat). |
| Carbon (INS reactor) | 44.3 ± 3.5 mmol C g−1(cat). | |
| Inelastic neutron scattering | ν(C–H) | 17.4 ± 1.0 μmol H g−1(cat). |
The TPO profile for the micro-reactor and INS reactor samples are presented in Fig. 4, with the samples displaying comparable peak maxima of 920 ± 10 K. This coincidence in Tmax suggests that similar carbon morphologies were formed in both cases. A Tmax of 1086 K was observed for the TPO graphite calibration measurements (Section 2.2). This value is close to that seen in Fig. 4, which may indicate that graphitic-type structures have formed in this case. The carbon levels are reported in Table 1, with the micro-reactor and INS reactor samples respectively comprising 51.1 ± 4.1 mmol C g−1(cat) and 44.3 ± 3.5 mmol C g−1(cat). In the former case this corresponds to a carbon content of 61.3%, whereas this represents 53.2% in the latter case. The value for the INS reactor is in reasonable agreement with the elemental analysis and is consistent with the increase in mass of the reactor post-reaction. It is also reasonable to assume that this build-up of carbon within the catalyst bed is connected with the measured carbon mass imbalance (Fig. 3) and the pressure-drop observed with the INS reactor. It is indeed noteworthy that despite substantial carbon laydown, corresponding to approximately 50% of the catalyst mass after a 6 h period of reaction, the catalyst continues to operate and produce syngas to a significant degree. Somehow, the large carbon presence is not unduly impeding reaction turnover.
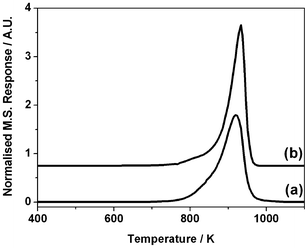 | ||
Fig. 4 Temperature-programmed oxidation profile for Ni/Al2O3 catalyst after 6 h reaction of a 1![[thin space (1/6-em)]](https://www.rsc.org/images/entities/char_2009.gif) : :![[thin space (1/6-em)]](https://www.rsc.org/images/entities/char_2009.gif) 1 mixture of CH4 and CO2 at 898 K in (a) the micro-reactor and (b) the INS Inconel™ reactor. Measurements were performed using a temperature ramp of 10 K min−1 and a carrier gas mixture of 5% O2 in He. 1 mixture of CH4 and CO2 at 898 K in (a) the micro-reactor and (b) the INS Inconel™ reactor. Measurements were performed using a temperature ramp of 10 K min−1 and a carrier gas mixture of 5% O2 in He. | ||
The TPO profiles presented in Fig. 4 may be described as comprising a single intense peak that is skewed with a low temperature tail. This simple profile indicates the retained carbon populations to be reasonably homogeneous, as no separate peaks are evident in the profiles. The technique of temperature-programmed hydrogenation (TPH) has been used to discern distinct populations of retained carbonaceous overlayers,6,24 so this methodology was also used to examine a sample of this catalyst after 3 h continuous reaction in the micro-reactor. The resulting profile, Fig. 5, yields a single symmetric peak centered at 860 K. The singularity of this feature is further evidence that the carbon population is homogeneous, with no indication of discrete interactions, for instance of carbonaceous deposits associated with different ‘active sites’ of the metal crystallites.
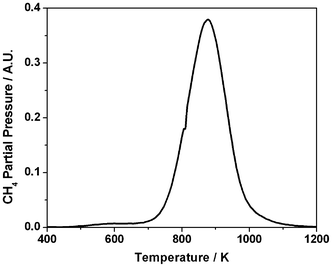 | ||
Fig. 5 Temperature programmed hydrogenation profile (15 amu mass spectrometer signal) for Ni/Al2O3 catalyst after 3 h reaction of a 1![[thin space (1/6-em)]](https://www.rsc.org/images/entities/char_2009.gif) : :![[thin space (1/6-em)]](https://www.rsc.org/images/entities/char_2009.gif) 1 mixture of CH4 and CO2 in the quartz micro-reactor at 898 K. Measurements were performed using a temperature ramp of 10 K min−1 and a carrier gas mixture of 5% H2 in He. 1 mixture of CH4 and CO2 in the quartz micro-reactor at 898 K. Measurements were performed using a temperature ramp of 10 K min−1 and a carrier gas mixture of 5% H2 in He. | ||
3.2 Inelastic neutron scattering
INS difference spectra (i.e. spectrum of reacted catalyst - spectrum of reduced catalyst) recorded at primary energies of 4840 and 2017 cm−1 are shown in Fig. 6. Fig. 6 (a) is characterized by a single weak feature centered at 3050 cm−1, which can be assigned as a sp2 carbon C–H stretch mode. The poor signal: noise ratio of this feature can partially be attributed to the use of the higher resolution ‘A’ chopper package compared to the ‘S’ chopper package used previously13,31 but, nevertheless, the small signal intensity indicates minimal hydrogen retention by the catalyst. Calibration of the C–H stretching intensity using a previously described method permits the number of hydrogen atoms associated with carbon atoms to be determined.12 This information is presented in Table 1, which indicates a value of 17.4 ± 1.0 μmol H g−1(cat). This value is significantly lower than the value of 68 ± 4 μmol H g−1(cat) determined for a 45.1% Ni/Al2O3 catalyst that formed predominantly amorphous carbon.13 Another major difference from the previously reported INS data is the absence of any ν(O–H) features in Fig. 6 (a). A spectrum of the reduced catalyst (not shown) also contained no υ(O–H) contribution.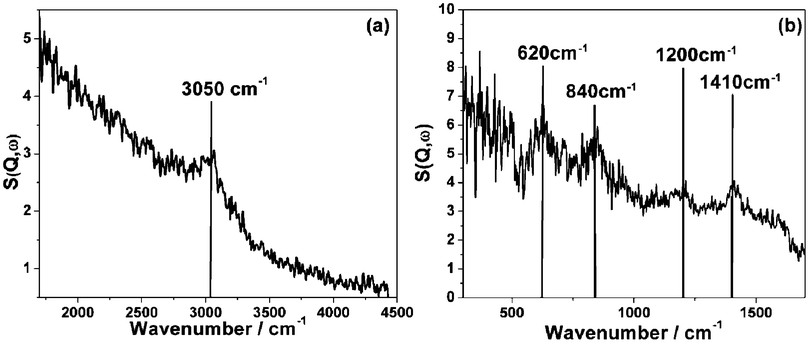 | ||
Fig. 6 INS spectra of reacted Ni/Al2O3 after 6 h reaction of a 1![[thin space (1/6-em)]](https://www.rsc.org/images/entities/char_2009.gif) : :![[thin space (1/6-em)]](https://www.rsc.org/images/entities/char_2009.gif) 1 mixture of CH4 and CO2 at 898 K. The spectra are difference spectra (spectrum of reacted catalyst – spectrum of reduced catalyst) acquired using the MAPS spectrometer operating at an incident neutron energy of (a) 4840 cm−1 (the C–H and O–H stretch region) and (b) 2017 cm−1 (the fingerprint region). 1 mixture of CH4 and CO2 at 898 K. The spectra are difference spectra (spectrum of reacted catalyst – spectrum of reduced catalyst) acquired using the MAPS spectrometer operating at an incident neutron energy of (a) 4840 cm−1 (the C–H and O–H stretch region) and (b) 2017 cm−1 (the fingerprint region). | ||
A minimal hydroxyl density is associated with α-alumina.38 The hydroxyl signal associated with the 45.1% Ni/Al2O3 sample was connected to the catalyst preparative process involved with that particular catalyst.13 A different α-alumina was used to prepare the 26% Ni/Al2O3 catalyst under investigation here and the absence of any bands arising from ν(O–H) modes in Fig. 6 (a) is thought to indicate minimal hydroxyl contribution to the reaction chemistry. Indeed, these INS measurements are suggestive of differences in the surface chemistry of seemingly comparable transition aluminas. The spectrum of the reacted catalyst recorded at a primary energy of 2017 cm−1 (Fig. 6 (b)) is characterized by four discernible bands observed at 1410, ca. 1200, 840 and 620 cm−1. Again, the poor signal![[thin space (1/6-em)]](https://www.rsc.org/images/entities/char_2009.gif) :
:![[thin space (1/6-em)]](https://www.rsc.org/images/entities/char_2009.gif) noise ratio indicates a low concentration of hydrogen within the carbonaceous matrix. The 1410 cm−1 band is close in energy to a CH2 scissors vibration, however, there is little evidence for saturated carbon species from the ν(C–H) region (Fig. 7). Instead, this mode may consist of a coupled C–C stretch and C–H bend, as previously reported by Albers and co-workers.39 The broad band centered at 1200 cm−1 is assigned to an aromatic in-plane C–H bending mode.39–41 The band at 840 cm−1 is assigned to an aromatic out-of-plane C–H bending mode39,42,43 consistent with the ν(C–H) mode observed at 3050 cm−1 (Fig. 7), although there could additionally be a contribution from a C–C stretch at 875 cm−1.41,44 The 620 cm−1 band is attributed to an sp2 carbon network deformation mode.40,45 Collectively, the spectra in Fig. 7 and 8 are similar to those previously reported for cokes and other highly carbonaceous materials39,43,45 and indicate the presence of extensive polycyclic aromatic domains that are largely graphitic in nature.
noise ratio indicates a low concentration of hydrogen within the carbonaceous matrix. The 1410 cm−1 band is close in energy to a CH2 scissors vibration, however, there is little evidence for saturated carbon species from the ν(C–H) region (Fig. 7). Instead, this mode may consist of a coupled C–C stretch and C–H bend, as previously reported by Albers and co-workers.39 The broad band centered at 1200 cm−1 is assigned to an aromatic in-plane C–H bending mode.39–41 The band at 840 cm−1 is assigned to an aromatic out-of-plane C–H bending mode39,42,43 consistent with the ν(C–H) mode observed at 3050 cm−1 (Fig. 7), although there could additionally be a contribution from a C–C stretch at 875 cm−1.41,44 The 620 cm−1 band is attributed to an sp2 carbon network deformation mode.40,45 Collectively, the spectra in Fig. 7 and 8 are similar to those previously reported for cokes and other highly carbonaceous materials39,43,45 and indicate the presence of extensive polycyclic aromatic domains that are largely graphitic in nature.
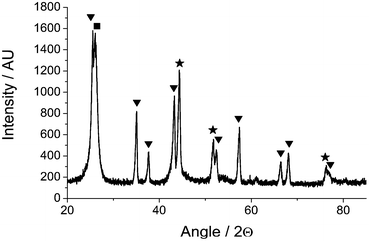 | ||
| Fig. 7 Powder X-ray diffraction pattern of Ni/Al2O3 recorded after reaction and INS measurement showing reflections for α-alumina (triangle), nickel (star) and graphite (square) phases. | ||
3.3 X-ray diffraction and transmission electron microscopy
The powder X-ray diffraction pattern for the post-reaction INS sample is presented in Fig. 7. Reflections due to the α-alumina support and metallic nickel are apparent. A moderately broad and intense reflection due to graphite is observed at 26.1°, indicating that a substantial degree of coking has taken place. Graphite particle sizing using the Scherrer equation was precluded by the overlap of this feature with an alumina reflection.Transmission electron micrographs for the same area of the post-reaction sample are presented in Fig. 8 using zero energy loss (Fig. 8(a)) and elemental mapping analysis (Fig. 8(b–d)). Fig. 8(a) is characterized by a number of narrow (diameter ca. 60 nm) translucent strands that terminate in small (diameter ca. 36 nm) but dense structures. Fig. 8(b) is an energy-filtered carbon image, where carbonaceous material appear as light-coloured structures. The grey regions in the top left hand side of the image are due to the ‘holey carbon’ material on which the catalyst sample has been dispersed. The light shaded strands dominating the right hand side of the image are carbon whiskers, also known as filamentous carbon.16,35 These represent a dense interconnected network of long strands of carbonaceous material. A small dark shape is discernible at the end of each whisker. Fig. 8(d) is the energy filtered image for nickel, which is characterized by a large number of bright ‘spots’ to the right hand side of the image. These bright objects are nickel particles that are placed at the end of the extended whiskers and appear to ‘cap’ the carbonaceous whiskers. In fact, these nickel particles are the reaction front of this heterogeneous material and constitute the reaction centre associated with methane conversion. There is some dispersion in size, with diameters ranging from 20–70 nm. Fig. 8(c) presents the oxygen map. Most notably here is a rhombohedral-type structure in the top end of the image. This ‘blob’ corresponds to alumina. It is apparent by the quantity of nickel particles distant from any alumina that the mechanism of filament growth has removed a large proportion of the active metal from the support. This phenomenon has been extensively reported3,15,16,21,35 and has taken place in this instance during a period of sustained methane reforming (Fig. 2). The data within Fig. 8(b–d)) can be incorporated in to a single color-coded image that is presented in Fig. 9, which provides a dramatic image of how the catalyst structure has been modified during the reaction process. The nickel particles are well dispersed but occur as terminations of carbonaceous ‘whiskers’, representative of filamentous carbon. It is clear that the carbonaceous matrix has lifted small nickel crystallites from the alumina support material, which the oxygen signal shows remain clustered in particular regions (Fig. 8(c)). This is clearly a dynamic reaction system, both chemically and structurally.
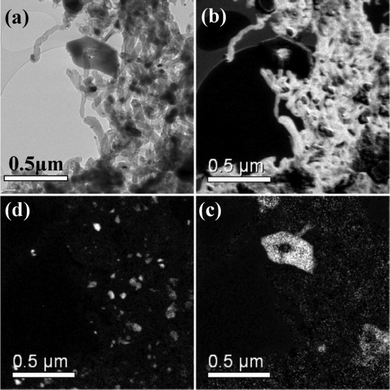 | ||
| Fig. 8 Transmission electron micrographs of Ni/Al2O3 recorded after reaction and INS measurement: (a) zero loss micrograph, i.e. no energy filtering, (b) carbon map, (c) oxygen map and (d) nickel map. | ||
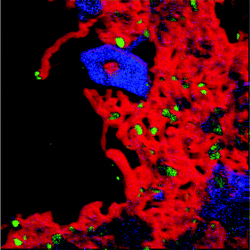 | ||
| Fig. 9 Colour-coded energy map transmission electron micrograph of Ni/Al2O3 recorded after reaction and INS measurement: red = carbon, green = nickel and blue = oxygen. The spectral scan is taken over the same area of sample presented in Fig. 8. | ||
3.4 Isotopic substitution experiments
In order to evaluate the possibility of the oxidant contributing to the carbon deposition process, reaction testing measurements at 898 K for 1.5 h were performed in the micro-reactor where 13CO2 was used as a reagent alongside 12CH4 in place of 12CO2. A shorter reaction time was used in this instance due to the cost of the 13CO2 feedstock. The results are presented in Fig. 10.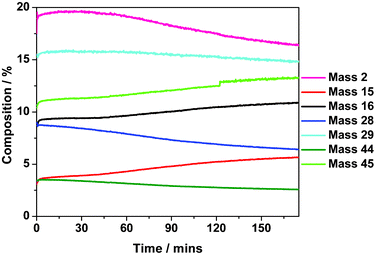 | ||
Fig. 10 Isothermal reaction profile at 898 K of a 1![[thin space (1/6-em)]](https://www.rsc.org/images/entities/char_2009.gif) : :![[thin space (1/6-em)]](https://www.rsc.org/images/entities/char_2009.gif) 1 mixture of 12CH4 and 13CO2 over a Ni/Al2O3 catalyst. Measurements performed using the micro-reactor arrangement. 1 mixture of 12CH4 and 13CO2 over a Ni/Al2O3 catalyst. Measurements performed using the micro-reactor arrangement. | ||
This experiment provides the opportunity to assess how the carbon connected with the CO2 oxidant partitions in the reaction and whether it contributes to the carbon deposition process. In the absence of scrambling, the following (unbalanced) equation applies:
| 12CH4 (g) + 13CO2 (g) → 12CO(g) + 13CO(g) + 2H2(g) + 13C(ad) + 12C(ad) | (7) |
For increasing values of time-on-stream, the signal at 16 (12CH4) and 45 amu (13CO2) are seen to diminish, indicating the catalyst to be slowly deactivating, as seen in Fig. 2. Concomitantly, the signals for masses 28 (12CO), 29 (13CO) and 2 amu (H2) also decrease. Essentially, Fig. 10 reproduces the trends evident in Fig. 2(a) and shows increasing reagent breakthrough with decreasing product formation as a slow progressive deactivation pathway increasingly contributes. The fact that signals for both 28 and 29 amu decrease indicates that both 12CH4 and 13CO2 contributions to CO formation decrease as the catalyst deactivates.
Eqn (7) demonstrates that carbon from the oxidant could contribute to the carbon deposition process. This scenario has been reported elsewhere28,29 and is worthy of further exploration in this case. Fig. 11 shows two TPO plots (continuous feed of 5% O2 in He) recorded after the micro-reactor experiments (1.5 h at 898 K for a 1![[thin space (1/6-em)]](https://www.rsc.org/images/entities/char_2009.gif) :
:![[thin space (1/6-em)]](https://www.rsc.org/images/entities/char_2009.gif) 1 mixture of (a) 12CH4 and 12CO2 and (b) 12CH4 and 13CO2). Equations (8) and (9) show that mass analysis at 44 and 45 amu can be used to determine whether the isotopically labelled carbon is present at the catalyst surface.
1 mixture of (a) 12CH4 and 12CO2 and (b) 12CH4 and 13CO2). Equations (8) and (9) show that mass analysis at 44 and 45 amu can be used to determine whether the isotopically labelled carbon is present at the catalyst surface.
| 12C(ad) + 16O2(g) → 12C16O2(g). | (8) |
| 13C(ad) + 16O2(g) → 13C16O2(g). | (9) |
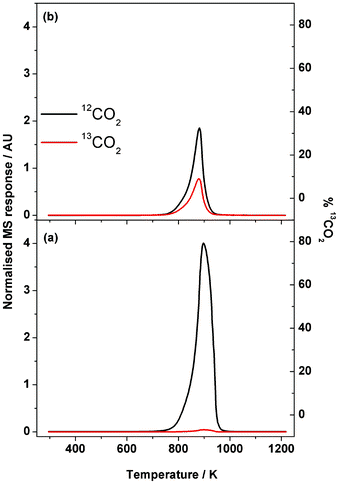 | ||
Fig. 11 Temperature-programmed oxidation profile for Ni/Al2O3 catalyst after 1.5 h isothermal run at 898 K of a 1![[thin space (1/6-em)]](https://www.rsc.org/images/entities/char_2009.gif) : :![[thin space (1/6-em)]](https://www.rsc.org/images/entities/char_2009.gif) 1 mixture of (a) 12CH4 and 12CO2 and (b) 12CH4 and 13CO2 over Ni/Al2O3 catalyst. Measurements performed using a temperature ramp of 10 K s−1 and a carrier gas mixture of 5% O2 in He. 1 mixture of (a) 12CH4 and 12CO2 and (b) 12CH4 and 13CO2 over Ni/Al2O3 catalyst. Measurements performed using a temperature ramp of 10 K s−1 and a carrier gas mixture of 5% O2 in He. | ||
Fig. 11(a) presents the TPO profile after 1.5 h time-on-stream using conventional reagents (12CH4 + 12CO2) and shows a single and intense 12CO2 feature (Tmax = 900 K) skewed to low temperature, which is consistent with Fig. 4. A small signal for 13CO2 is also seen, representing 1.1% of the integrated intensity of the 12CO2 peak, corresponding to the natural abundance of the 13C isotope. This signal could equally be derived from the 12CH4 or 12CO2 and simply represents background levels of 13C in the reagents.
The post-reaction TPO profile observed for a 12CH4 and 13CO2 feed-stream (Fig. 11(b)) shows a single 12CO2 peak centered at 890 K but now a significant 13CO2 feature is clearly evident at the same temperature. The 13CO2 peak intensity represents 31.4% of the total CO2 signal observed in Fig. 11(b). This value clearly exceeds 13C natural abundance levels. Although it is not possible to discern from Fig. 11(a) whether the methane or the carbon dioxide are the source of the carbon deposited at the catalyst surface, the more discriminatory Fig. 11(b) shows that both the fuel and the oxidant are indeed contributing to the carbon retained at the catalyst surface as part of the dry reforming process. The relative intensities observed in Fig. 11(b) indicate that it is the methane which is the greater contributor in this matter.
Schuurman and Mirodatos have performed similar TPO experiments over a silica-supported nickel catalyst but using 13CH4 and 12CO2 as reagents.29 In that case, the intensity of their 13CO2 peak exceeded the intensity of their 12CO2 peak. That outcome is consistent with the deductions made above.
3.5 Raman scattering
Fig. 12(a) shows the Raman spectrum in the range 500–3500 cm−1 for the Ni/Al2O3 sample after 3 h in a 1![[thin space (1/6-em)]](https://www.rsc.org/images/entities/char_2009.gif) :
:![[thin space (1/6-em)]](https://www.rsc.org/images/entities/char_2009.gif) 1 mixture of 12CH4 and 12CO2 at 898 K in the Raman environmental chamber. Two intense peaks at 1342 and 1580 cm−1 are readily assigned to, respectively, the D and G bands of retained carbon.46,47 These features are accompanied by a band at 2685 cm−1, which is assigned to the overtone of the D band (2 × 1342 cm−1 = 2684 cm−1). The presence of this second order feature is indicative of an ordered carbonaceous matrix, which may be further attributed to 3-dimensional ordering in the c direction of a graphitic like matrix.48
1 mixture of 12CH4 and 12CO2 at 898 K in the Raman environmental chamber. Two intense peaks at 1342 and 1580 cm−1 are readily assigned to, respectively, the D and G bands of retained carbon.46,47 These features are accompanied by a band at 2685 cm−1, which is assigned to the overtone of the D band (2 × 1342 cm−1 = 2684 cm−1). The presence of this second order feature is indicative of an ordered carbonaceous matrix, which may be further attributed to 3-dimensional ordering in the c direction of a graphitic like matrix.48
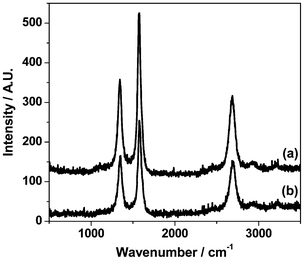 | ||
Fig. 12 (a) Raman spectrum of Ni/Al2O3 recorded after 3 h in a 1![[thin space (1/6-em)]](https://www.rsc.org/images/entities/char_2009.gif) : :![[thin space (1/6-em)]](https://www.rsc.org/images/entities/char_2009.gif) 1 mixture of 12CH4 and 12CO2 at 898 K in the Raman environmental chamber; (b) Raman spectrum of the sample in (a) after it has been exposed to a continuous stream of 5% H2 in He at 700 K for 1 hour. 1 mixture of 12CH4 and 12CO2 at 898 K in the Raman environmental chamber; (b) Raman spectrum of the sample in (a) after it has been exposed to a continuous stream of 5% H2 in He at 700 K for 1 hour. | ||
In Section 3.1 temperature-programmed measurements showed that the carbonaceous overlayer could be hydrogenated to form methane gas (Fig. 5), with the resulting symmetric desorption feature indicative of a homogeneous carbon population. Although this process can be simply characterized by eqn (10),
| 2H2(g) + C(ad) → CH4(g), | (10) |
4. Discussion
Compared to previous studies of dry methane reforming over supported nickel catalysts,11–13 a combination of different preparative procedures (calcination temperature, support material, metal loading) and reaction conditions have resulted in a catalyst that favors the formation of filamentous carbon as a side reaction in preference to the formation of amorphous carbon. The source of carbon is thought to be comparable in both regimes, namely adsorbed carbon atoms retained at the catalyst surface. As CO is a major product (Fig. 2), the rate of the carbon polymerization reaction (eqn (3)) must be less than the competing carbon oxidation reaction (eqn (11)),| C(ad) + CO2(g) → 2CO(g). | (11) |
Schuurman and Mirodatos have previously reported the carbon oxidation reaction to be rate limiting.29 For the catalyst studies considered in this work, the carbon polymerization process is described by eqn (4).
The transmission electron micrographs (Fig. 8 and 9) provide the most direct evidence for the formation of filamentous carbon, which is supported by a strong graphitic contribution to the X-ray diffractogram (Fig. 7). The temperature-programmed oxidation (Fig. 4 and 11) and hydrogenation (Fig. 5) measurements show the carbonaceous overlayer to be homogeneous in form; an image that is backed up by sharp C–C based stretching features plus overtone features in the Raman spectrum (Fig. 12). Further, the weak INS spectra (Fig. 6) show the carbonaceous matrix to be hydrogen-lean, with those spectra interpreted as presenting the vibrational fingerprint for a small hydrogen population that is decorating terminations of an extensive carbonaceous matrix.
A combination of elemental analysis, TPO and INS measurements have been used to determine quantities of carbon and hydrogen atoms retained by the catalyst after an extended period of sustained production of syngas, Table 1. Comparing the TPO measurements associated with the INS reactor and the integrated intensity of the INS ν(C–H) feature (Fig. 6 (a)), leads to a carbon: hydrogen ratio of 2550 ± 204![[thin space (1/6-em)]](https://www.rsc.org/images/entities/char_2009.gif) :
:![[thin space (1/6-em)]](https://www.rsc.org/images/entities/char_2009.gif) 1. This value significantly exceeds that of 160 ± 13 reported previously for a Ni/Al2O3 catalyst which formed amorphous carbon.13 The database for C
1. This value significantly exceeds that of 160 ± 13 reported previously for a Ni/Al2O3 catalyst which formed amorphous carbon.13 The database for C![[thin space (1/6-em)]](https://www.rsc.org/images/entities/char_2009.gif) :
:![[thin space (1/6-em)]](https://www.rsc.org/images/entities/char_2009.gif) H ratios for methane reforming catalysts operating under specified conditions is small.12 The use of INS in this way establishes that the partitioning of hydrogen within the catalyst matrix is highly dependent on the regime in which that particular catalyst is operating. Characterization of carbonaceous/hydrocarbonaceous residues in heterogeneous catalysis remains a significant challenge; however the ability of INS to quantify hydrogen levels as well as being able to specify the form of the hydrogen, in this case exclusively coordinated to carbon atoms, is a useful addition to the catalytic chemist's armoury of techniques.
H ratios for methane reforming catalysts operating under specified conditions is small.12 The use of INS in this way establishes that the partitioning of hydrogen within the catalyst matrix is highly dependent on the regime in which that particular catalyst is operating. Characterization of carbonaceous/hydrocarbonaceous residues in heterogeneous catalysis remains a significant challenge; however the ability of INS to quantify hydrogen levels as well as being able to specify the form of the hydrogen, in this case exclusively coordinated to carbon atoms, is a useful addition to the catalytic chemist's armoury of techniques.
In a previous study, the authors considered a series of elementary reactions relevant to the operation of alumina-supported nickel catalysts active for the methane dry reforming reaction.13 The observed reaction trends were then encapsulated within a kinetic scheme. The isotopic substitution measurements presented in Section 3.4 permit further refinement, not least the inclusion of a more involved role for the oxidant. In order to develop these concepts within a generalized reaction scheme for methane dry reforming, the following groupings of elementary processes need to be considered.
(a). Dissociative adsorption of methane
| CH4(g) → CH3(ad) + H(ad). | (12) |
| CH3(ad) → CH2(ad) + H(ad). | (13) |
| CH2(ad) → CH(ad) + H(ad). | (14) |
| CH(ad) → C(ad) + H(ad). | (15) |
(b). Recombinative desorption of hydrogen
| 2 H(ad) → H2(g). | (16) |
(c). Other processes leading to retention of surface carbon
(i). Dissociative adsorption of CO2
| CO2(g) → C(ad) + 2 O(ad) | (17) |
(ii). Dissociative adsorption of CO
| CO(g) → C(ad) + O(ad) | (18) |
(iii). Boudouard reaction
| 2 CO(g) → C(ad) + CO2(g) | (19) |
(d). Oxidation of retained carbon atoms
| C(ad) + O(ad) → CO(g) | (20) |
(e). Oxidation of retained hydrogen atoms
| 2 H(ad) + O(ad) → H2O(g). | (21) |
Eqn (12)–(15) describe the stepwise dissociative adsorption of methane to yield surface hydrogen and carbon atoms. This reaction is activated, with Fig. 1 showing temperatures in excess of 600 K are required to dissociate the methane molecule. From the intensity distribution in the TPO profile of the 12CH4 and 13CO2 reaction (Fig. 11(b)), the process defined by eqn (15) is thought to be the prominent source of retained carbon but, nevertheless, the 13CO2 signal in Fig. 11(b) also indicates a significant role for the oxidant in the carbon laydown process. The INS spectra show very little hydrogen retention (Fig. 6), so eqn (16) is a highly labile process at reaction temperatures. As encountered with the amorphous carbon forming catalysts,11–13 alumina-supported nickel is very efficient at cycling hydrogen, less so with carbon. As discussed above, eqn (11) plays a dominant role in producing CO co-product and also in keeping the surface clean. It is the relative efficiency of this reaction that will determine the degree of carbon retention.
Although viaeqn (15) methane is thought to be the major source of retained carbon, Fig. 11(b) forces one to additionally consider a role for CO2 as a source of surface carbon. A direct route would be dissociative adsorption of CO2 (eqn (17)). It is also possible that CO2 could be cycled via the reverse water gas shift reaction to form CO (eqn (6)), which could then lead on to surface carbon via the dissociative adsorption of CO (eqn (18)). Further, CO2-derived CO (viaeqn (6)), could additionally contribute to the Boudouard reaction, eqn (19). This latter option is thought to be dominant on the basis that eqn (17) and (18) lead to chemisorbed oxygen atoms, which could oxidize residual carbon (eqn (20)) and hydrogen (eqn (21)) atoms.
It is noted that the INS spectrum of the catalyst under consideration here shows no contribution from hydroxyl groups (Fig. 6). The fact that hydroxyl signals have been seen in previous studies examining catalysts prepared using a different support material13 indicates that not all α-aluminas are the same. The fact that INS can discriminate between different catalyst formulations in this way is seen as beneficial. Moreover, the absence of a ν(O–H) mode in Fig. 6 (a) takes away the requirement to invoke reactions involving hydroxyl groups for the forward-going chemistry.
Whereas this work has required application of a wider number of elementary reactions than proposed for the catalyst exhibiting amorphous carbon laydown,13 the general reaction scheme proposed there is equally valid provided that eqn (4) is used to describe the carbon polymerization stage. However, that scheme can be elaborated upon to include the more complex physical transformations connected with whisker formation: Fig. 13 presents a schematic diagram illustrating how mass may be partitioned in this study. The principal reaction is described by eqn (2), whereas the inefficient oxidation of adsorbed carbon atoms (eqn (11)) permits the carbon polymerization process (eqn (4)) to prevail, that then forces the nickel crystallite to separate from the alumina support material. The INS measurements have shown minimal hydrogen partitioning in the catalyst matrix, which highlights the relative efficiency of the hydrogen desorption stage (eqn (16)). It is changes in the catalyst preparation stage, primarily a change in the α-alumina support material (specifically from Sumitomo α-Al2O311 to Alfa Aesar α-Al2O3 [this work]), that is thought to be responsible for the formation of filamentous carbon in this instance. Fig. 3 shows the carbon mass balance to be approaching steady state operation at ca. 95% at about 340 min time-on-steam. This suggests that the carbon retention process, as signified in Fig. 13, is sustained at a modest but fixed rate once the catalyst has undergone an initial conditioning period.
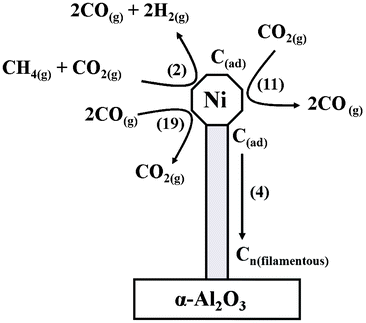 | ||
| Fig. 13 A schematic diagram illustrating some of the main reactions active during the dry reforming of methane and the formation of filamentous carbon as a by-product. The numbers in parenthesis correspond to chemical equations presented in the text. For reasons of clarity, only a limited number of reactions are presented. | ||
Illustrations similar to Fig. 13 have been reported previously. For instance, Ferreira-Aparicio et al. present a reaction scheme for the reforming of methane with carbon dioxide over a Ru/SiO2 catalyst which includes interchanges involving hydroxyl groups.49 Contrasting that outcome with the INS spectra reported here suggests hydroxyl-assisted transformations may be metal dependent. Rostrup-Nielsen and co-workers have examined details of whisker carbon formation and conclude that further understanding of the phenomenon is required.50 Froment's examination of producing synthesis gas by steam and CO2 reforming of natural gas includes a model outlining the elementary steps of methane cracking on a nickel/alumina catalyst.51
This study uniquely adds to an already significant volume of work by using INS to discern how hydrogen is positioned in the intricate sequence of reactions connected with the methane reforming process. The INS measurements of a catalyst operating in a regime favoring filamentous carbon formation supplements a previous study where the formation of amorphous carbon featured.
5. Conclusions
A 26 wt% Ni/Al2O3 catalyst active for the dry reforming of methane also forms filamentous carbon as an unwelcome by-product. Micro-reactor measurements were used to guide the selection of a reaction temperature that yielded significant CH4/CO2 conversions within the temperature range of an Inconel™ reactor compatible with the acquisition of INS spectra. The main results concerning analysis of the catalyst post-reaction can be summarized as follows.Weak INS spectra show minimal hydrogen retention by the Ni/Al2O3 catalyst after 6 h reaction at 898 K. The catalyst is very efficient at cycling hydrogen.
Carbon mass balance measurements indicate rapid carbon laydown on commencement of reaction but this rate diminishes with increasing time-on-stream. At steady-state operation, a carbon mass balance of 95% is observed.
From comparison with INS and TPO measurements, the carbonaceous overlayer formed during a six hour reaction period exhibits a C![[thin space (1/6-em)]](https://www.rsc.org/images/entities/char_2009.gif) :
:![[thin space (1/6-em)]](https://www.rsc.org/images/entities/char_2009.gif) H ratio of 2550 ± 204
H ratio of 2550 ± 204![[thin space (1/6-em)]](https://www.rsc.org/images/entities/char_2009.gif) :
:![[thin space (1/6-em)]](https://www.rsc.org/images/entities/char_2009.gif) 1. The hydrogen is thought to be decorating edges of the carbonaceous matrix and is not present as any identifiable molecular entity.
1. The hydrogen is thought to be decorating edges of the carbonaceous matrix and is not present as any identifiable molecular entity.
X-ray diffraction shows the presence of a graphitic phase.
Transmission electron microscopy, including energy dispersive mapping, confirm the presence of carbonaceous ‘whisker’ formation.
TPO measurements recorded after continuous flow isotopic substitution experiments (12CH4 and 13CO2) establish a role for CO2 in the carbon deposition process.
Temperature-programmed hydrogenation combined with in situ Raman scattering measurements show the carbonaceous overlayer to be homogeneous and not amenable to hydrogen accommodation.
A series of elementary reactions excluding hydroxyl groups are used to describe the experimental observations. A schematic diagram is proposed to account for the main transformations that take place within this dynamic catalytic system.
Carbon dioxide, an increasing component of our atmosphere that may contribute to unfavourable environmental events, can be used to effect the reforming of methane to produce syngas, a valuable chemical feedstock. Carbon mass balance measurements indicate this application to be an efficient use of carbon dioxide.
Acknowledgements
The EPSRC are thanked for project support (Grant EP/E028861/1). The STFC Rutherford Appleton Laboratory is thanked for access to the MAPS spectrometer. Jim Gallagher (Chemistry, University of Glasgow), Colin How and Donald MacLaren (Physics, University of Glasgow) are thanked for help with the TEM measurements.References
- J. A. Rabo, Catal. Today, 1994, 22, 201 CrossRef CAS.
- J. Rostrup-Nielsen and L. J. Christiansen, Concepts in Syngas Manufacture, Catalytic Science Series, Vol. 10, Imperial College Press, 2011 Search PubMed.
- J. R. Rostrup-Nielsen, Natural Gas: Fuel or Feedstock, Proc. NATO ASI, Sustainable Strategies for the Upgrading of Natural Gas: Fundamentals, Challenges and Opportunities, ed. E. G. Derouane, V. Parmon, F. Lemos and F. R. Ribeiro, Springer, 2005, Ch. 1, p. 3 Search PubMed.
- L. Wang, L. Yang, Y. Zhang, W. Ding, S. Chen, W. Fang and Y. Yang, Fuel Process. Technol., 2010, 91, 723 CrossRef CAS.
- M. E. Dry, Appl. Catal., A, 2004, 276, 1 CrossRef CAS.
- Q. Yan, H. Toghuani and M. G. White, J. Phys. Chem. C, 2007, 111, 18646 CAS.
- Z. Zhang, X. E. Verykios, S. M. MacDonald and S. J. Affrossman, J. Phys. Chem., 1996, 100, 744 CrossRef CAS.
- J. R. Rostrup-Nielsen and B. J. H. Hansen, J. Catal., 1993, 144, 38 CrossRef CAS.
- L. Xiancai, L. Shuigen, Y. Yifeng, W. Min and H. Fei, Catal. Lett., 2007, 118, 59 CrossRef.
- C. H. Bartholomew, Catal. Rev. Sci. Eng., 1982, 24, 67 CAS.
- I. P. Silverwood, N. G. Hamilton, J. Z. Staniforth, C. J. Laycock, S. F. Parker, R. M. Ormerod and D. Lennon, Catal. Today, 2010, 155, 319 CrossRef CAS.
- I. P. Silverwood, N. G. Hamilton, C. J. Laycock, J. Z. Staniforth, R. M. Ormerod, C. D. Frost, S. F. Parker and D. Lennon, Phys. Chem. Chem. Phys., 2010, 12, 3102 RSC.
- I. P. Silverwood, N. Hamilton, A. R. McFarlane, J. Kapitán, L. Hecht, E. L. Norris, R. M. Ormerod, C. D. Frost, S. F. Parker and D. Lennon, Phys. Chem. Chem. Phys., 2012, 14, 15214 RSC.
- D. L. Trimm, Catal. Today, 1997, 37, 233 CrossRef CAS.
- O.-S. Joo and K.-D. Jung, Bull. Korean Chem. Soc., 2002, 23, 1149 CrossRef CAS.
- S. Helveg, C. Lopez-Cartes, J. Sehested, P. L. Hansen, B. S. Clausen, J. R. Rostrup-Nielsen, F. Abild-Pedersen and J. K. Norskov, Nature, 2004, 427, 426 CrossRef CAS.
- J. R. Rostrup-Nielsen, in Catalysis Science and Technology, Springer-Verlag,Berlin, 1984, pp. 1–118 Search PubMed.
- T. Baird, J. R. Fryer and B. Grant, Carbon, 1974, 12, 591 CrossRef CAS.
- T. Baird, J. R. Fryer and B. Grant, Nature, 1971, 233, 329 CrossRef CAS.
- G. G. Tibbetts, M. G. Devour and E. J. Rodda, Carbon, 1987, 25, 367 CrossRef CAS.
- Y. Chen and J. Ren, Catal. Lett., 1994, 29, 39 CrossRef CAS.
- J. Guo, H. Lou, H. Zhao, D. Chai and X. Zheng, Appl. Catal., A, 2004, 273, 75 CrossRef CAS.
- J. Guo, H. Lou and X. Zheng, Carbon, 2007, 45, 1314 CrossRef CAS.
- X. Verykios, Appl. Catal., A, 2003, 255, 101 CrossRef CAS.
- J. Wei and E. Iglesia, J. Phys. Chem. B, 2004, 108, 7253 CrossRef CAS.
- V. C. H. Kroll, H. M. Swann and C. Mirodatos, J. Catal., 1996, 161, 409 CrossRef CAS.
- Y. Schuurman, V. C. H. Kroll, P. Ferreira-Aparicio and C. Mirodatos, Catal. Today, 1997, 38, 129 CrossRef CAS.
- Y. Schuurman, C. Mirodatos, P. Ferreira-Aparicio, I. Rodriguez-Ramos and A. Guerrero-Ruiz, Catal. Lett., 2000, 66, 33 CrossRef CAS.
- Y. Schuurman and C. Mirodatos, Appl. Catal., A, 1997, 151, 305 CrossRef CAS.
- R. J. Farrauto and C. H. Bartholomew, in Fundamentals of Industrial Catalytic Processes, Blackie, 1997 Search PubMed.
- S. F. Parker, D. Lennon and P. W. Albers, Appl. Spectrosc., 2011, 65, 1325 CrossRef CAS.
- I. P. Silverwood, N. G. Hamilton, A. R. McFarlane, R. M. Ormerod, T. Guidi, J. Bones, M. P. Dudman, C. M. Goodway, M. Kibble, S. F. Parker and D. Lennon, Rev. Sci. Instrum., 2011, 82, 034101 CrossRef.
- S. Chinta, T. V. Choudhary, L. L. Daemen, J. Eckert and W. D. Goodman, Angew. Chem., Int. Ed., 2002, 41, 144 CrossRef CAS.
- S. Chinta, T. V. Choudhary, L. L. Daemen, J. Eckert and D. W. Goodman, J. Am. Chem. Soc., 2004, 126, 38 CrossRef.
- R. Martinez, E. Romero, C. Guimon and R. Bilbao, Appl. Catal., A, 2004, 274, 139 CrossRef CAS.
- H. Li and J. Wang, Chem. Eng. Sci., 2004, 59, 4861 CrossRef CAS.
- A. Nandini, K. Pant and S. Dhingra, Appl. Catal., A, 2005, 290, 166 CrossRef CAS.
- F. Qi, Z. Chen, B. Xu, J. Shen, J. Ma, C. Joll and A. Heitz, Appl. Catal., B, 2008, 84, 684 CrossRef CAS.
- P. W. Albers, J. Pietsch, J. Krauter and S. F. Parker, Phys. Chem. Chem. Phys., 2003, 5, 1941 RSC.
- D. Lennon, J. McNamara, J. R. Philips, R. M. Ibberson and S. F. Parker, Phys. Chem. Chem. Phys., 2000, 2, 4447 RSC.
- J. K. Walters and R. J. Newport, J. Phys.: Condens. Matter, 1995, 7, 1755 CrossRef CAS.
- J. K. Walters, R. J. Newport, S. F. Parker and W. S. Howells, J. Phys.: Condens. Matter, 1995, 7, 10059 CrossRef.
- P. Albers, G. Prescher, K. Siebold, D. K. Ross and F. Fillaux, Carbon, 1996, 34, 903 CrossRef CAS.
- P. J. R. Honeybone, R. J. Newport and J. K. Walters, Phys. Rev. B: Condens. Matter, 1994, 50, 839 CrossRef CAS.
- P. Albers, S. Bösing, G. Prescher, K. Seibold, D. K. Ross and S. F. Parker, Appl. Catal., A, 1999, 187, 233 CrossRef CAS.
- M. A. Pimenta, G. Dresselhaus, M. S. Dresselhaus, L. G. Cançado, A. Jorio and R. Saito, Phys. Chem. Chem. Phys., 2007, 9, 1276 RSC.
- F. Tuinstra and J. L. Koenig, J. Chem. Phys., 1970, 53, 1126 CrossRef CAS.
- E. López-Honorato, P. J. Meadows, R. A. Shatwell and P. Xiao, Carbon, 2010, 48, 881 CrossRef.
- P. Ferreira-Aparicio, I. Rodriguez-Ramos, J. A. Anderson and A. Guerrero-Ruiz, Appl. Catal., A, 2000, 202, 183 CrossRef CAS.
- S. Helveg, J. Sehested and J. R. Rostrup-Nielsen, Catal. Today, 2011, 178, 42 CrossRef CAS.
- G. F. Froment, J. Mol. Catal. A: Chem., 2000, 163, 147 CrossRef CAS.
| This journal is © The Royal Society of Chemistry 2013 |
