 Open Access Article
 This Open Access Article is licensed under a
 Creative Commons Attribution 3.0 Unported Licence
Comparison of a low transition temperature mixture (LTTM) formed by lactic acid and choline chloride with choline lactate ionic liquid and the choline chloride salt: physical properties and vapour–liquid equilibria of mixtures containing water and ethanol†
María Franciscoa, Agustín S. B. Gonzáleza, Sara Lago García de Diosb, Wilko Weggemansa and Maaike C. Kroon*a
aEindhoven University of Technology, Department of Chemical Engineering and Chemistry, Separation Technology Group, Den Dolech 2, 5612 AZ, Eindhoven, Netherlands. E-mail: M.Kroon@tue.nl; Fax: +31-40-2463966; Tel: +31-40-247 5289
bUniversity of Santiago de Compostela, Department of Chemical Engineering, E.T.S.E., Av. Lope de Gómez de Marzoa, 15782 Santiago de Compostela, Spain
First published on 2nd October 2013
Abstract
A new group of nature-based solvents, i.e. low transition temperature mixtures (LTTMs), are evaluated in this work as entrainers for the separation of azeotropic mixtures. The effect of choline-based LTTMs on the vapour pressure of ethanol and water is compared to the effect of the corresponding lactate-based choline salt and a chloride-based choline salt. The changes with temperature and composition of the physical properties (density and viscosity) of the binary mixtures (entrainer + water–ethanol) are studied and compared. Also, the vapour–liquid equilibrium (VLE) data for binary mixtures of water–ethanol with the studied entrainers are reported. The phase diagrams of the ternary systems composed of water + ethanol + entrainer are shown and the experimental data are correlated by using the e-NRTL model.
Introduction
Azeotropic mixtures are involved in common chemical processes. One relevant example is the production of alcohols derived from the fermentation of carbohydrates, which form azeotropes with water, in the biofuel industry. Among those products, ethanol is the most important example, due to its excellent properties as alternative fuel.1 Several potential processes for separating various azeotropic mixtures have come to light such as azeotropic distillation,2 extractive distillation,3 liquid–liquid extraction4 or supported liquid membrane separation.5Extractive distillation is the most common technique, which involves the addition of a heavy component (entrainer) that interacts preferentially with one of the constituents of the azeotropic mixture. This interaction generates a difference in volatility between the two constituents of the mixture, making the azeotropic composition shift to higher concentration of the more volatile component in the vapour phase. In extreme cases, the azeotrope can even be broken.
Traditionally, very cheap and common salts were used as entrainers for azeotropic separations (water + alcohol) due to the well-known ebullioscopic effect, which strongly reduces the volatility of the water.6 However, salts show multiple disadvantages for large scale processes: they may erode the sieve plate, precipitate and build up in the tower due to causticity and limited solubility.
Extractive distillation with ionic liquids (ILs) as separating agents became very popular during the past decade.7–9 The use of these ionic substances integrates the advantages of a liquid solvent (easy operation) and solid salt (high separation ability).
Another advantage of these entrainers is their negligible vapour pressure near ambient conditions. This minimizes the chance of solvent emissions to the atmosphere, thus reducing the atmospheric pollutant effect of volatile solvents.
However, the scientific community started questioning the use of ILs for large scale applications. The synthesis of most ILs is not “green” and the costs of production as well as degree of recyclability or biodegradability are the main weak points of IL technologies.10,11
A new family of solvents was presented for the first time by Abbott et al. as suitable alternative to ILs.12 Originally, they were called “deep eutectic solvents” (DES),12 but this name does not cover the complete class of solvents, because many of them do not show (eutectic) melting points but glass transitions instead.13 Therefore, we coined them “low transition temperature mixtures” (LTTM).13 These new solvents can be formed by mixing two solid starting materials, which form a liquid by hydrogen bond interactions. They show very interesting properties as solvents to be explored for different applications in separation processes. They share many advantages with ILs, but their preparation is simple and cheap, since one only has to mix natural and readily available starting materials.14,15 LTTMs are formed by mixing a hydrogen bond donor (e.g. organic acid, alcohol) and a hydrogen bond acceptor (e.g. quaternary ammonium salt). One of the most popular hydrogen bond acceptors used to form LTTMs is choline chloride, because of its benign character, biodegradability and price.
In our previous work,16 lactic acid:choline chloride mixtures were investigated as solvents for separations. A complete characterization of the physical properties proved the tunability and phase behaviour by changing the composition. These mixtures formed a stable liquid in a wide range of compositions. Their promising properties as solvents, like wide liquid range, good salvation properties derived from hydrogen bonding interactions, recoverability and biodegradability, make lactic acid:choline chloride mixtures promising candidates as solvents for separations.16
In this work, we choose a representative LTTM formed by lactic acid and choline chloride in a molar ratio 2![[thin space (1/6-em)]](https://www.rsc.org/images/entities/char_2009.gif) :1 (LC2:1), and we compare its performance as entrainer in extractive distillation with the choline chloride salt and a lactate-based IL (choline lactate). For this purpose, we study the properties of binary mixtures of these three entrainers with water and ethanol in order to discuss the interactions involved. The VLE data of binary mixtures of LTTM (LC2:1), IL (choline lactate) and salt (choline chloride) with water and ethanol are also studied, as well as the azeotropic behaviour of the ternary system of ethanol + water + entrainer. The structures and phase transition temperatures of the three different entrainers studied are shown in Fig. 1.
:1 (LC2:1), and we compare its performance as entrainer in extractive distillation with the choline chloride salt and a lactate-based IL (choline lactate). For this purpose, we study the properties of binary mixtures of these three entrainers with water and ethanol in order to discuss the interactions involved. The VLE data of binary mixtures of LTTM (LC2:1), IL (choline lactate) and salt (choline chloride) with water and ethanol are also studied, as well as the azeotropic behaviour of the ternary system of ethanol + water + entrainer. The structures and phase transition temperatures of the three different entrainers studied are shown in Fig. 1.
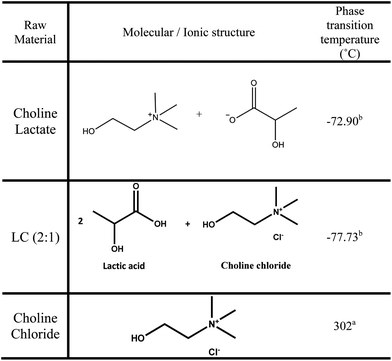 | ||
| Fig. 1 Molecular structure of the three entrainers studied in this work (the IL choline lactate, the LTTM formed by lactic acid and choline chloride (molar ratio 2:1), and the natural salt choline chloride) and their respective phase transition temperatures. (a Melting point. b Glass transition temperature.) | ||
Results and discussion
Physical properties: density, viscosity and mixing properties
In the field of separation processes, the study of the physical properties of the mixtures involved in a process is of crucial interest. In this way, the suitability of a solvent for a certain process can be evaluated and the design of the involved units can be made. Therefore, the characterization of the main physical properties of the binary mixtures composed of the solvent to be used as entrainer and water or ethanol are determined here. The deviation of the ideal behaviour of these mixtures is also discussed.Properties of binary mixtures with water
:1, or the salt choline chloride, respectively, are studied as a function of temperature and composition. Fig. 2 shows the dependency of the density on temperature for all three choline-derived components studied in this work at two representative mole fractions of entrainer (0.1 and 0.3). The experimental values for the three binary systems are included in the ESI (Table S1†).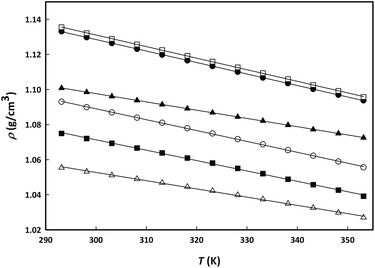 | ||
| Fig. 2 Linear density change with temperature for aqueous binary mixtures of choline lactate (○, xIL = 0.1002; ●, xIL = 0.2990), LC2:1 (■, xLC2:1 = 0.1003; □, xLC2:1 = 0.2944) and choline chloride (△, xSALT = 0.0991; ▲, xSALT = 0.3033). | ||
The density follows a linear trend with temperature as expressed in eqn (1):
| ln(ρ) = A + B(T) | (1) |
The fitting parameters of eqn (1) obtained at different molar compositions of the entrainer + water binary mixtures, including the deviations between the calculated and the experimental density values, are reported as ESI (Table S2†).
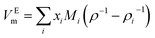
The study of molar excess volume of the binary mixtures and their change with temperature and composition is very useful for a better understanding of the interactions involved in the mixing behaviour of real solutions. The experimental values of excess molar volume, VEm (cm3 mol−1) of the mixtures were calculated from the measured densities of binary mixtures using the following expression:
 | (2) |
Fig. 3 presents the experimental excess molar volumes, VEm, of the three binary water + entrainer (IL/LTTM/salt) systems as a function of molar fraction at two representative temperatures (293.15 and 348 K). All experimental data can be found in the ESI (Table S3†).
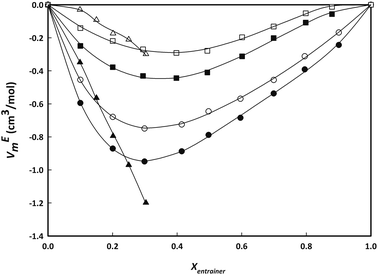 | ||
| Fig. 3 Experimental excess molar volume VEm (cm3 mol−1) of aqueous binary mixtures of choline lactate (circles), LC2:1 (squares) and choline chloride (triangles) as a function of composition for two representative temperatures (293.15 K, black; 348.15 K, white). Lines represent the fitting with Redlich–Kister equation (3). | ||
The experimental VEm data were fitted by the often used Redlich–Kister equation17 described as follows:
 | (3) |
| Ai(T) = bi + ci(T) | (4) |
From Fig. 3 it can be observed that larger negative deviations from ideality are found at lower temperatures and higher water concentrations. This graph also depicts the strong asymmetrical behaviour of the excess molar volumes with composition. The minimum value of VEm is found at mole fraction close to 0.3 and is slightly shifting to lower values with increasing temperatures. The negative VEm values are indicative of a highly attractive interaction with water. The IL or salt + water mixtures show a larger deviation from ideality compared to the LC(2:1) + water mixture.
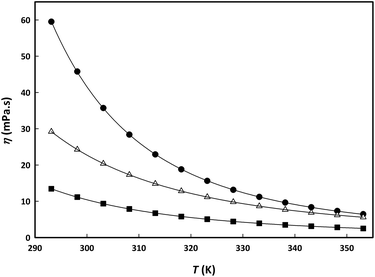 | ||
| Fig. 4 Viscosity change with temperature for aqueous binary mixtures of choline lactate (circles), LC2:1 (squares) and choline chloride (triangles) at the same molar fraction (0.3). Lines represent fitting of the experimental data using VFT equation (5). | ||
The viscosity dependency on temperature was successfully fitted to the Vogel–Fulcher–Tamman (VFT) equation (5), which was previously applied for ILs:18
 | (5) |
From Fig. 4, it can be observed that viscosity of the IL + water mixture is highest, followed by the salt + water mixture, and the viscosity of the LC(2:1) + water mixture is the lowest. The same trend (IL > salt > LTTM) was found for the dependency of the viscosity on the temperature; the IL viscosity being most influenced by temperature.
The deviation in the viscosity for the binary mixtures, Δη, was obtained from the relation:
 | (6) |
The experimental values of Δη for the binary aqueous mixtures of the IL choline lactate and the LTTM LC2:1 are displayed as ESI in Table S7.† The viscosity deviation of the salt + water mixture cannot be determined because the pure salt is a solid with infinite viscosity. The experimental values were fitted to a Redlich–Kister polynomial equation similar to the one used for excess molar volumes:
 | (7) |
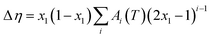
The fitting parameters are summarized in Table S8 together with the deviations defined in Table S2.†Fig. 5 shows the experimental data and fitting curves for two representative temperatures (293.15 and 318.15 K). In all cases, the deviation in viscosity is negative. For the IL + water system, the minimum in viscosity deviation can be found at a mole fraction of approximately 0.5, while the minimum for the LTTM + water system is present at a mole fraction of 0.7. For both systems, the viscosity deviation decreases as the temperature increases; this behaviour is similar compared with other systems found in literature.18
 | ||
| Fig. 5 Viscosity deviations of aqueous binary mixtures of choline lactate (circles) and LC2:1 (squares) as a function of composition for two representative temperatures (293.15 K, black; 318.15 K, white). Lines represent fitting with Redlich–Kister equation (7). | ||
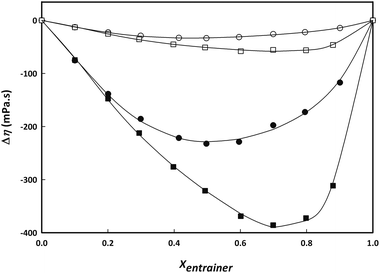
Fig. 6 shows an interesting comparison between the change in properties of aqueous binary mixtures of IL and LTTM at a mole fraction of 0.5 as a function of temperature. More negative values were found for the excess molar volume of the IL choline lactate compared to those of the LTTM LC2:1, while the viscosity deviations were found to be lower in the whole range of temperatures. The addition of water thus has a stronger effect on the LTTM viscosity while the presence of water has a larger effect on the density of the IL.19
 | ||
| Fig. 6 Viscosity deviations, Δη (circles) and excess molar volume, VEm (triangles) for aqueous mixtures of 0.5 molar fraction of binary mixtures of choline lactate (black) and LC2:1 (white) with water. | ||
Properties of binary mixtures with ethanol
In this section, a comparative study is made between the properties of the binary mixture of the IL choline lactate with ethanol and the IL + water system (in the previous section).Similar conclusions would be obtained for comparison of the other choline-based compounds with water and ethanol, so only one of the binary mixtures with ethanol is discussed.
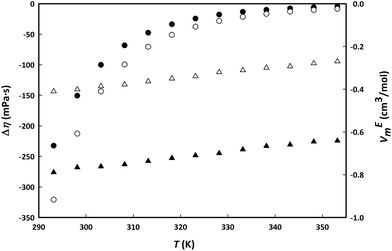
Fig. 7 shows a comparison between the deviations from ideal behaviour (represented by VEm and Δη) for the IL mixtures with ethanol and water at a temperature of 293.15 K. Both show similar behaviour with negative deviations for both properties pointing to stronger interactions of IL–water–ethanol compared to cation–anion interactions. In both cases the minimum of the curve is located at the same IL composition, which can be interpreted as a similar solvation number for the aggregation state of cation/anions in water or ethanol.
 | ||
| Fig. 7 Viscosity deviations, Δη (white) and excess molar volume, VEm (black) for binary mixtures of choline lactate and water (circles) or ethanol (squares) at 293.15 K. | ||
Vapour–liquid equilibria
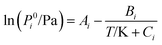
:1 and the salt choline chloride with water and ethanol.The change in vapour pressure of water in the presence of each one of the choline-based entrainers is studied first. These data are useful for a comparison of the effect of the addition of entrainer on the activity coefficient of water. Table 1 reports the VLE experimental data for the binary mixtures of water with the three entrainers. The Antoine equation20 was used to correlate the vapour pressure data:
 | (8) |
:1) + water and (iii) choline lactate + water
| Choline chloride (1) + water (2) | |||||||||
|---|---|---|---|---|---|---|---|---|---|
| X1 | T (K) | P (kPa) | aH2O | γH2O | X1 | T (K) | P (kPa) | aH2O | γH2O |
| 0.0708 | 313.02 | 6.61 | 0.9045 | 0.9735 | 0.1998 | 320.55 | 6.31 | 0.5841 | 0.7299 |
| 318.36 | 8.63 | 0.8932 | 0.9613 | 327.02 | 9.50 | 0.6389 | 0.7985 | ||
| 323.10 | 11.09 | 0.9039 | 0.9728 | 331.91 | 12.19 | 0.6499 | 0.8122 | ||
| 327.54 | 14.27 | 0.9356 | 1.0069 | 335.26 | 15.77 | 0.7202 | 0.9001 | ||
| 332.49 | 18.03 | 0.9356 | 1.0069 | 340.86 | 19.85 | 0.7056 | 0.8818 | ||
| 337.45 | 22.71 | 0.9394 | 1.0109 | 346.91 | 24.90 | 0.6820 | 0.8524 | ||
| 341.59 | 28.55 | 0.9826 | 1.0575 | 351.64 | 31.15 | 0.7010 | 0.8761 | ||
| 347.58 | 35.35 | 0.9414 | 1.0131 | 356.40 | 38.31 | 0.7115 | 0.8892 | ||
| 352.57 | 43.66 | 0.9455 | 1.0176 | 361.77 | 47.25 | 0.7113 | 0.8889 | ||
| 357.61 | 53.41 | 0.9453 | 1.0173 | 366.60 | 57.50 | 0.7209 | 0.9009 | ||
| 362.69 | 64.76 | 0.9410 | 1.0127 | 371.52 | 69.93 | 0.7317 | 0.9144 | ||
| 367.50 | 78.23 | 0.9486 | 1.0209 | 376.47 | 83.69 | 0.7340 | 0.9173 | ||
| 372.67 | 93.92 | 0.9429 | 1.0148 | ||||||
| LC(2:1) (1) + water (2) | Choline chloride (1) + water (2) | ||||||||
|---|---|---|---|---|---|---|---|---|---|
| X1 | T (K) | P (kPa) | aH2O | γH2O | X1 | T (K) | P (kPa) | aH2O | γH2O |
| 0.1961 | 313.82 | 6.29 | 0.8244 | 1.0256 | 0.1938 | 322.95 | 6.31 | 0.5178 | 0.6423 |
| 318.46 | 8.65 | 0.8904 | 1.1075 | 328.59 | 9.52 | 0.5939 | 0.7367 | ||
| 323.49 | 11.12 | 0.8884 | 1.1051 | 332.27 | 12.30 | 0.6446 | 0.7995 | ||
| 328.28 | 14.28 | 0.9039 | 1.1244 | 337.99 | 15.71 | 0.6342 | 0.7866 | ||
| 333.03 | 17.96 | 0.9092 | 1.1310 | 344.02 | 19.94 | 0.6177 | 0.7662 | ||
| 337.51 | 22.61 | 0.9327 | 1.1602 | 348.14 | 24.88 | 0.6472 | 0.8028 | ||
| 342.61 | 28.41 | 0.9353 | 1.1634 | 353.08 | 31.17 | 0.6612 | 0.8202 | ||
| 347.72 | 35.32 | 0.9350 | 1.1631 | 359.68 | 38.46 | 0.6277 | 0.7786 | ||
| 352.45 | 43.50 | 0.9469 | 1.1779 | 364.30 | 47.32 | 0.6468 | 0.8023 | ||
| 357.26 | 53.35 | 0.9574 | 1.1910 | 368.94 | 57.74 | 0.6639 | 0.8235 | ||
| 362.34 | 64.64 | 0.9521 | 1.1843 | 374.91 | 70.03 | 0.6490 | 0.8050 | ||
| 367.37 | 78.19 | 0.9527 | 1.1851 | ||||||
| 372.60 | 93.94 | 0.9455 | 1.1761 | ||||||
The Antoine parameters of eqn (8) and the deviations between the correlation and the experimental data for the studied mixtures are included as ESI (Tables S17 and S18†).
Fig. 8 shows a comparison in the change of the vapour pressure of water by addition of the IL choline lactate, the LTTM LC2:1 and the salt choline chloride. The presence of the salt shows the highest effect on the vapour pressure of water compared to the IL and the LTTM. Reason for the higher effect of the salt compared to the IL is the difference in the strength of the hydrogen bond interaction between the anion and the water. Higher interactions are expected for the chloride ion due to its higher charge/size ratio and, therefore, its higher ability for polarization. The lowest effect on the vapour pressure was found for the LTTM LC2:1 using the same molar ratio. Because only 1/3 of the moles of LC2:1 consists of choline chloride (and 2/3 of lactic acid), the LTTM only has a maximum of 1/3 of the salt's ebullioscopic effect. This point could evidence that the ability of the LTTM to affect the vapour pressure of water is mainly determined by the ebullioscopic effect of the constituent salt. Further studies are required to confirm this conjecture.
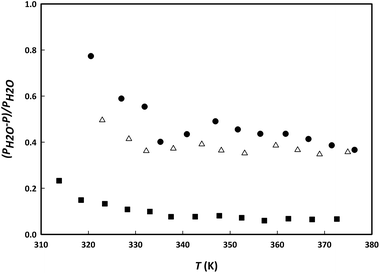 | ||
| Fig. 8 Relative water vapour pressure change by addition of the IL choline lactate (triangles), the LTTM LC2:1 (squares) and the salt choline chloride (circles). | ||
Table 2 shows the VLE data for binary mixtures with ethanol. A similar plot to the one discussed above could be made for the binary mixtures with ethanol, but the relative change in vapour pressure is close to zero in all cases. This difference in behaviour points to a much higher effect of the entrainers on the volatility of water compared to that of ethanol. It would be, in principle, reasonable to assume that LTTMs (just like ILs and salts) could be useful entrainers for water–ethanol separation by increasing their relative volatility and so, breaking the azeotropic behaviour. However, the effect of the IL on the relative volatility is much higher (3×) compared to the LTTM. Therefore, in the next section, only ternary VLE data are measured for the IL + water + ethanol system.
:1) + ethanol
| Choline lactate (1) + ethanol (2) | LC (2:1) (1) + ethanol (2) | ||||||||
|---|---|---|---|---|---|---|---|---|---|
| X1 | T (K) | P (kPa) | aEtOH | γEtOH | X1 | T (K) | P (kPa) | aEtOH | γEtOH |
| 0.2000 | 313.17 | 17.78 | 0.9927 | 1.2409 | 0.1999 | 313.05 | 17.77 | 0.9985 | 1.2480 |
| 318.61 | 23.50 | 0.9960 | 1.2450 | 318.46 | 23.41 | 1.0002 | 1.2502 | ||
| 323.21 | 29.43 | 0.9969 | 1.2462 | 323.10 | 2946 | 1.0033 | 1.2540 | ||
| 328.54 | 37.93 | 0.9993 | 1.2491 | 328.34 | 37.86 | 1.0068 | 1.2584 | ||
| 332.97 | 46.43 | 0.9996 | 1.2495 | 332.77 | 46.42 | 1.0086 | 1.2607 | ||
| 337.15 | 55.85 | 0.9996 | 1.2496 | 336.94 | 55.77 | 1.0073 | 1.2591 | ||
| 340.24 | 63.89 | 1.0006 | 1.2508 | 339.96 | 63.75 | 1.0104 | 1.2629 | ||
| 343.88 | 74.46 | 1.0002 | 1.2503 | 343.70 | 74.58 | 1.0092 | 1.2614 | ||
| 346.34 | 82.47 | 1.0004 | 1.2505 | 346.26 | 82.30 | 1.0017 | 1.2521 | ||
| 349.52 | 93.83 | 1.0003 | 1.2504 | 34 928 | 93.51 | 1.0066 | 1.2582 | ||
| 351.32 | 100.71 | 0.9993 | 1.2492 | 351.40 | 101.45 | 1.0035 | 1.2542 | ||
 | (9) |
 | (10) |
| x3 | x1′ | y1 | T (K) | αVLE12 | SVLE12 |
|---|---|---|---|---|---|
| 0.2031 | 0.000 | 0.000 | 378.79 | — | — |
| 0.2000 | 0.031 | 0.080 | 369.23 | 2.707 | 0.447 |
| 0.2000 | 0.063 | 0.197 | 366.12 | 3.677 | 0.641 |
| 0.2000 | 0.125 | 0.367 | 361.27 | 4.070 | 0.798 |
| 0.2000 | 0.156 | 0.458 | 359.66 | 4.557 | 0.991 |
| 0.2000 | 0.195 | 0.506 | 357.01 | 4.228 | 1.235 |
| 02000 | 0.328 | 0.630 | 352.10 | 3.496 | 1.275 |
| 0.2009 | 0.438 | 0.697 | 351.61 | 2.957 | 1.640 |
| 0.2008 | 0.500 | 0.740 | 351.53 | 2.844 | 1.900 |
| 0.2007 | 0.563 | 0.774 | 351.24 | 2.668 | 1.936 |
| 0.2007 | 0.687 | 0.833 | 351.18 | 2.273 | 2.324 |
| 0.2007 | 0.842 | 0.925 | 351.17 | 2.307 | 2.270 |
| 0.2007 | 0.875 | 0.940 | 351.11 | 2.254 | 2.065 |
| 0.2007 | 0.906 | 0.952 | 351.06 | 2.050 | 1.607 |
| 0.2009 | 0.938 | 0.960 | 351.05 | 1.595 | 1.313 |
| 0.2008 | 0.969 | 0.976 | 351.03 | 1.304 | 0.447 |
| 0.2009 | 1.000 | 1.000 | 351.01 | — | — |
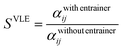
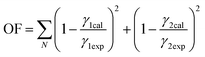
Fig. 9 shows the evolution of the azeotrope with the addition of choline lactate as entrainer at different molar fractions of IL, while Fig. 10 shows the activity coefficients of ethanol and water as a function of ethanol composition. The electrolyte non-random two-liquid (e-NRTL) model is used to correlate the VLE data. This model is an extension of the nonrandom two-liquid local composition proposed by Renon and Prausnitz21 for liquid-phase activity coefficients. These activity coefficients can be obtained by adjusting the VLE data of the ternary system through the minimization of the objective function OF described as follows:
 | (11) |
| yip = XiγiP0i | (12) |
![Salting out effect of choline lactate on the VLE of the ethanol (1) + water (2) system at 100 kPa for IL mole fraction of 0.2 (●), 0.15 (□) and 0.1 (▲) [this work] compared to IL-free system (○).22 Solid lines represent fitting of the experimental data using e-NRTL model.](/image/article/2013/RA/c3ra40303c/c3ra40303c-f9.gif) | ||
| Fig. 9 Salting out effect of choline lactate on the VLE of the ethanol (1) + water (2) system at 100 kPa for IL mole fraction of 0.2 (●), 0.15 (□) and 0.1 (▲) [this work] compared to IL-free system (○).22 Solid lines represent fitting of the experimental data using e-NRTL model. | ||
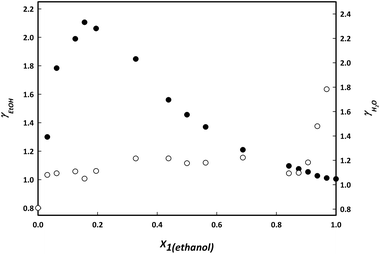 | ||
| Fig. 10 Activity coefficients γ of ethanol (black) and water (white) in the ternary mixture with 0.2 mole fraction of IL. | ||
Using the relative volatility as separation factor at an ethanol mole fraction of 0.95 and 100 kPa, most of the ionic liquids achieve an average relative volatility of 1.33.23–26 As can be seen in Table 3, the relative volatility of ethanol when using choline lactate is in agreement with this average value.
Fig. 10 shows how the presence of the IL changes the relative volatility of the ethanol + water system. The binary system in absence of IL shows azeotropic behaviour. Addition of the IL results in an azeotropic composition shift to higher concentrations of ethanol (as observed for the mixture containing 0.10 and 0.15 mole fractions of IL) until the azeotrope completely disappears at a mole fraction of 0.2.
Conclusions
In this work, the use of a LTTM (mixture of lactic acid + choline chloride in the ratio 2:1) as possible entrainer for azeotropic distillation was evaluated and compared to a lactate-based IL (choline lactate) and the choline chloride salt. The main interactions between these entrainers with the azeotropic mixture ethanol + water are discussed. The strong negative values found for the deviations of their properties from ideal behaviour point to strong hydrogen-bond interactions between the entrainer and ethanol–water. The vapour pressure of water was strongly reduced by addition of all three entrainers. The highest effect was found for the salt choline chloride. The salting out effect of the LTTM was found to be lower caused by the lower concentration of choline chloride in the mixture. The study of the azeotropic behaviour of the ternary IL + ethanol + water shows a shift of the azeotropic point to higher concentrations of ethanol upon the addition of the IL, until the azeotrope completely disappears at a IL mole fraction of 0.2.Experimental section
Chemicals
The IL choline lactate with a purity of >98 wt% was supplied by Iolitec, synthesized on request. It was used without any further purification. Ethanol (≥99.5 wt%) was purchased from TechniSolv. Ultra-pure crystalline DL-lactic acid at pharmaceutical grade was kindly provided by PURAC Biochem B.V. (Gorinchem, Netherlands). Choline chloride was obtained from Aldrich (≥98 wt%). Deionized MilliQ water was used in all the studied mixtures (<18.2 MΩ cm). Choline lactate, choline chloride and lactic acid were dried under vacuum before use. The water content was measured by using Karl Fischer (KF796) titration to be <1 wt% in all experiments.Preparation of LTTM
LTTM formed by mixing lactic acid and choline chloride were prepared following a similar procedure previously reported by our group.13 The mixtures were weighted using a Mettler AX205 balance with a precision of ±0.02 mg, whereby the water content of the starting materials was always measured and taken into account. Both the hydrogen bond donor (lactic acid) and acceptor (choline chloride) were added to a closed 25 mL glass flask and homogeneously mixed before heating. The temperature was set to 60 ± 0.1 °C using a thermostatic oil bath with a IKA ETS-D5 temperature controller. Once a transparent liquid was formed, the mixture was cooled down. In our previous works,13,15 a TGA analysis (TGA Q500 by TA Instruments) was carried out to check the thermal stability at a scan rate of 10 °C min−1 under a nitrogen flow with a weighing precision of ±0.01% a sensitivity of 0.1 μg, and an isothermal temperature precision of ±0.1 °C. Differential Scanning Calorimetry (DSC) Q1000 was used to obtain the glass transition temperature of the formed LTTM with a scan rate of 10 °C min−1 a sensitivity of 0.2 μW and a temperature precision of ±0.1 °C. The water content was measured with the Karl-Fischer titration method on a Metrohm 870 KF Titrino plus.Determination of physical properties: density and viscosity
The density and the viscosity of the three entrainers were determined at atmospheric pressure and at temperatures ranging from 298 to 353 K. Due to the high hygroscopicity of the samples, both properties were measured using an Anton Paar SVM 3000/G2 Stabinger viscometer. This equipment requires only a total volume of sample of 2.5 mL, which is not in contact with the atmosphere during the measurement, so that moisture capture from the air is avoided. The equipment is provided with a high-precision thermostat with a stability of 0.005 K and calibrated by the manufacturer. The uncertainties of the density (with viscosity correction) and viscosity measurements are ±0.0005 g cm3 and ±0.35% respectively.Determination of VLE
An all-glass ebulliometer (Fischer VLE 602D) was used for the determination of the experimental VLE data. In this device, the equilibrium chamber is a dynamic recirculating still, equipped with a Cottrell circulation pump. The operation procedure is based on the principle of the circulation method.27 A control unit (Fischer VLE 2+) was used to set the pressure and heating power in the immersion heater. The equilibrium was reached after 30 minutes or longer, when the condensation rate (1–2 drops per second) and equilibrium temperature were constant in order to ensure a stationary state. Pressure and equilibrium temperature could be determined with an accuracy of ±0.01 kPa and ±0.01 K, respectively. Two or three replicate runs were performed for each sample.All solutions were prepared gravimetrically with an electronic balance (Mettler Toledo AX 205) with a readability of ±10−4 g. VLE data of 5 binary systems were measured i.e., water + IL, water + LTTM, water + salt, ethanol + IL and ethanol + LTTM. The salt choline chloride was found to be immiscible with ethanol. The VLE data of the ternary system consisting of water + ethanol + IL were also measured. Mixtures of water + IL or ethanol + IL were added to the initial sample in order to maintain a constant IL mole fraction in the system.
Samples of the condensed vapour phase were periodically analyzed by gas chromatograph (GC) and High Pressure Liquid Chromatography (HPLC, Varian Prostar) in order to guarantee the absence of entrainer in the vapour phase.
Vapour phase samples were injected in a Varian Prostar HPLC equipped with a silica-based Grace Prevail™ Organic Acid column (250 mm × 4.6 mm) with a particle size of 5 μm. The temperature of the column was kept constant in an oven (Varian Prostar Model 510) at 313.2 K for all measurements. Detection of entrainers was done using a UV detector (Varian Prostar model 310) at 210 nm. Each sample was injected twice.
The amount of ethanol in the condensed vapour phase was analysed using a Varian CP-3800 gas chromatograph (GC) equipped with a flame ionization detector (250 °C) and a Varian CP-SIL 5CB column (25 m × 1.2 μm). The injector temperature was 275 °C and the carrier gas was helium with a constant flow rate of 4.0 mL min−1. The water mole fraction was obtained from a mass balance calculation. Due to the negligible volatility of the salt/IL/LTTM, no presence of any of the studied entrainers was detected in the vapour phase. With this method, the detection limits for ethanol and lactic acid are, respectively, 0.003 and 0.0002 in mole fraction.
The liquid phase of the ternary system is composed of ethanol, water and the IL choline lactate. The ethanol mole fraction in the liquid phase was determined using the same GC, while the water content in the liquid phase was analysed using Karl-Fischer titration on a Metrohm 870 KF Titrino plus. The concentration of all components in both phases could be determined with an average overall deviation in mole fraction of ±0.004.
Notes and references
- A. Pandey, Handbook of Plant-based Biofuels, CRC, 2008 Search PubMed
.
- V. Gomis, R. Pedraza, O. Francés, A. Font and J. C. Asensi, Ind. Eng. Chem. Res., 2007, 46, 4572–4576 CrossRef CAS
- M. Errico and B. G. Rong, Sep. Purif. Technol., 2012, 96, 58–67 CrossRef CAS PubMed
- H. Habaki, O. Tabata, J. Kawasaki and R. Egashira, J. Chem. Eng. Jpn., 2010, 43(2), 214–223 CrossRef
- P. Christen, M. Minier and H. Renon, Biotechnol. Bioeng., 1990, 36, 116–123 CrossRef CAS PubMed
- Z. Lei, H. Wang, R. Zhou and Z. Duan, Chem. Eng. J., 2002, 87, 149–156 CrossRef CAS
- A. Pereiro, J. Araújo, J. Esperancca, I. Marrucho and L. Rebelo, J. Chem. Thermodyn., 2012, 46, 2–28 CrossRef CAS PubMed
- W. Arlt, M. Seiler, C. Jork and T. Scheiner, Ionic Liquids as Selective Additives for the Separation of Close-Boiling or Azeotropic Mixtures, PCT Int. Appl. WO 02747 18 A2, 2002
- C. Jork, M. Seiler, Y.-A. Beste and W. Arlt, J. Chem. Eng. Data, 2004, 52, 852–857 CrossRef
- R. P. Swatloski, J. D. Holbrey and R. D. Rogers, Green Chem., 2003, 5, 361–363 RSC
- M. Freemantle, An Introduction to Ionic Liquids, Royal Society of Chemistry, 2009 Search PubMed
- A. P. Abbott, D. Boothby, G. Capper, D. L. Davies and R. K. Rasheed, J. Am. Chem. Soc., 2004, 126, 9142–9147 CrossRef CAS PubMed
- M. Francisco, A. van den Bruinhorst and M. C. Kroon, Green Chem., 2012, 14(8), 2153–2157 RSC
- Q. Zhang, K. D. O. Vigier, S. Royer and F. Jérôme, Chem. Soc. Rev., 2012, 41, 7108–7146 RSC
- M. Francisco, A. van der Bruinhorst and M. Kroon, Angew. Chem., Int. Ed., 2013, 52, 3074–3085 CrossRef CAS PubMed
- M. Francisco, A. van der Bruinhorst, L. F. Zubier, C. J. Peters and M. Kroon, Fluid Phase Equil., 2013, 340, 77–84 CrossRef CAS PubMed
- O. Redlich and A. Kister, Ind. Eng. Chem., 1948, 40, 345–348 CrossRef
- H. Rodríguez and J. F. Brennecke, J. Chem. Eng. Data, 2006, 51, 2145–2155 CrossRef
- U. Domanska and M. Królikowska, J. Solution Chem., 2012, 41, 1422–1445 CrossRef CAS PubMed
- C. Antoine, C. R. Acad. Sci., 1888, 107, 681 Search PubMed
- H. Renon and J. M. Prausnitz, AIChE J., 1968, 14, 135–144 CrossRef CAS
- P. T. Ngema, Separation Processes for High Purity Ethanol Production, 2010 Search PubMed
- A. V. Orchilles, P. J. Miguel, E. Vercher and A. Martínez-Andreu, J. Chem. Eng. Data, 2010, 55, 1669–1674 CrossRef CAS
- W. Geng, L. Z. Zhang, D. S. Deng, Y. Ge and J. B. Li, J. Chem. Eng. Data, 2010, 55, 1679–1683 CrossRef CAS
- L. Z. Zhang, Y. Ge, D. X. Ji and J. B. Li, J. Chem. Eng. Data, 2009, 54, 2322–2329 CrossRef CAS
- Y. Ge, L. Z. Zhang, X. C. Yuan, W. Geng and J. B. Li, J. Chem. Thermodyn., 2008, 40, 1248–1252 CrossRef CAS PubMed
- D. Sunita, G. Shamla and P. L. V. N. Saichandra, National Conference, CHEMCON, 2010.
Footnote |
| † Electronic supplementary information (ESI) available. See DOI: 10.1039/c3ra40303c |
| This journal is © The Royal Society of Chemistry 2013 |