 Open Access Article
Emission spectroscopy of uranium(IV) compounds: a combined synthetic, spectroscopic and computational study†
Emtithal
Hashem
a,
Adam N.
Swinburne
b,
Carola
Schulzke
a,
Rachel C.
Evans
a,
James A.
Platts
*c,
Andrew
Kerridge
*d,
Louise S.
Natrajan
*b and
Robert J.
Baker
*a
aSchool of Chemistry, University of Dublin, Trinity College, Dublin, Ireland. E-mail: bakerrj@tcd.i.e.; Fax: +353-1-712826; Tel: +353-1-8963501
bSchool of Chemistry, The University of Manchester, Oxford Road, Manchester, UK. E-mail: Louise.Natrajan@manchester.ac.uk; Fax: +44 (0)161 2754 616; Tel: +44 (0)161 2751 426
cSchool of Chemistry, Main Building, Cardiff University, Park Place, Cardiff, CF10 3AT, U. K.. E-mail: platts@cf.ac.uk; Fax: +44 (0)29 208 74030; Tel: +44 (0)2920874950
dDepartment of Chemistry, University College London, 20 Gordon Street, London WC1H 0AJ, UK. E-mail: a.kerridge@ucl.ac.uk; Fax: +44(0)2076797463; Tel: +44 (0)2076795814
First published on 23rd January 2013
Abstract
Emission spectroscopy has been used for the first time in a spectroscopic study of a family of uranium(IV) halide complexes in non-aqueous media. The room temperature electronic absorption spectra of the simple coordination compounds [Li(THF)4][UX5(THF)] (X = Cl, Br, I), [Et4N]2[UCl6] and UCl4 in THF have been recorded and all transitions assigned with the aid of a comprehensive computational study using CASSCF and CASPT2 techniques. Excitation into a band of f-d and LMCT character followed by energy transfer into the 5f-orbital manifold accounts for the UV-visible radiative transitions observed in the emission spectra, which have been fully assigned as arising from transitions from the 5f16d1 electronic configuration to envelopes of states arising from the ground state 5f2 configuration. The bonding in [Li(THF)4][UCl5(THF)] has been further elucidated utilising NBO and AIM calculations which describe the nature of the U–Cl bond as predominantly ionic with some dative covalent character and substantial overlap between the Cl 3p orbitals and 5f and 6d orbitals on uranium. These studies indicate that the emission spectral fingerprint of simple U(IV) compounds of Oh, C4v and C2v symmetry are similar and characteristic and may be used as a diagnostic tool to assign U(IV) species in solution and by inference, in the environment, in the presence of [UO2]2+.
Introduction
Photoluminescence spectroscopy of complexes of the lanthanide(III) metals has had a significant and important impact on materials and bioinorganic chemistry and the physical processes that give rise to these emissions are well known and understood.1 Current understanding of the corresponding photoluminescence processes of actinide complexes does not approach this level of sophistication.2 The most well defined is the green emission of the uranyl, [UO2]2+, ion which occurs from deactivation of a formally triplet ligand to metal charge-transfer (LMCT) excited state. Whilst the majority of studies have focused on aqueous compounds, this technique has only recently been applied to non-aqueous uranyl compounds.3 What is clear from these studies is that the position of the emission band and the radiative lifetimes can provide valuable insight into the electronic environment at the uranium centre and, more recently, the degree of aggregation in solution.3 The later actinide ion Cm3+ (and to a lesser extent Am3+) is routinely characterised by time-resolved laser-induced emission spectroscopy in certain laboratories2c as the sensitivity of this technique is useful in studying small quantities of these highly radioactive materials in low concentrations.2a,4 There is no obvious physical reason why uranium(IV) compounds should not also show photoluminescence in fluid solution; in solid-state materials (e.g. in cubic U4+ doped LiYF4 and Cs2ZrBr6) there are a number of studies that show emission from the highest energy 3F2 energy charge-transfer excited-state manifold (5f16d1) to the Russell-Saunders coupled 3H4 5f2 ground state and higher lying energy states derived from the 5f2 electronic configuration.5 Kirishima et al. reported the only comprehensive photoluminescence spectrum of U4+, as the hydrated ion and suggested that the ten emission bands originated from the highest energy 1S0 Russell-Saunders coupled state to the lower lying 5f2 spin–orbit coupled levels.6 Interestingly, computational studies indicate that when the highest energy term is corrected for a large Stoke's shift (i.e. solvation effects), the assignment of the emission bands changes considerably,7 highlighting the fact that the intra 5f electronic transitions are very sensitive to the coordination environment, crystal field and symmetry.6a The open shell nature of these compounds make the assignment of absorption and emission bands challenging, although analysis based upon the Russell-Saunders coupling scheme can be used as a good approximation.4bIn terms of synthetic inorganic and organometallic chemistry, there has been a substantial body of work published on U(IV) compounds, and fundamental studies have given greater insight into the reactivity and electronic structures of these compounds. In particular organometallic compounds have been used as a readily tuneable platform for comprehensive studies on the electronic structure of [Cp*2AnX2] (An = Th, U). The effect of the σ- and π- type X ligands on the electronic and magnetic properties has been thoroughly elucidated in a number of elegant studies.8 A probable explanation for the lack of reports on the photoluminescence of U(IV) species is that in general the coordinated ligands possess low energy charge transfer absorptions that can mask f–f transitions. This is exemplified by the reports of the metallocene ketimide system [Cp*2U{N![[double bond, length as m-dash]](https://www.rsc.org/images/entities/char_e001.gif) C(Ph)(CH2Ph)}2], where no 5f-centered emission was observed following photoexcitation since decay from the ligand centered singlet state proceeds directly through the 5f-electron manifold, resulting in efficient quenching of the emission and lifetimes of picosecond order.8d With the correct choice of ligands, we postulate that photoluminescence spectroscopy should be a very useful technique in fingerprinting the +IV oxidation state of uranium, and for further elucidation of the electronic structure of uranium(IV) compounds that is complementary to conventional absorption spectroscopy. In addition, if U(IV) can be detected in the presence of the uranyl ion, the qualitative and quantitative discrimination of these two oxidation states would have a significant and substantial impact upon the environmental detection of these important ions for example, under nuclear waste repository or soil contamination conditions. There is currently no simple and scalable analytical technique that can do this.
C(Ph)(CH2Ph)}2], where no 5f-centered emission was observed following photoexcitation since decay from the ligand centered singlet state proceeds directly through the 5f-electron manifold, resulting in efficient quenching of the emission and lifetimes of picosecond order.8d With the correct choice of ligands, we postulate that photoluminescence spectroscopy should be a very useful technique in fingerprinting the +IV oxidation state of uranium, and for further elucidation of the electronic structure of uranium(IV) compounds that is complementary to conventional absorption spectroscopy. In addition, if U(IV) can be detected in the presence of the uranyl ion, the qualitative and quantitative discrimination of these two oxidation states would have a significant and substantial impact upon the environmental detection of these important ions for example, under nuclear waste repository or soil contamination conditions. There is currently no simple and scalable analytical technique that can do this.
With this in mind, it is noteworthy that Maldivi et al. reported that absorption spectroscopy in trivalent uranium compounds can provide insight into the degree of 5f-orbital participation in bonding to ligands.9 The participation of the 5f and 6d orbitals in forming covalent bonds is now of great experimental and theoretical interest.10 Enhanced covalency is not just of academic interest as it is also postulated to allow for a methodology to separate the minor actinides Am3+ and Cm3+ from the lanthanides for applications towards current and future nuclear waste streams.11 In particular it has been noted that ligands containing softer donor atoms have a higher affinity for trivalent actinides (U3+, Am3+, Cm3+) over trivalent lanthanides,11a and this is thought to be due, in part, to a greater covalent character to the actinide–ligand bond.12 However, recent computational studies cast some doubt on the origins of this perceived covalency and suggest that enhancements in separation factors for the isoelectronic pair Am(III)/Eu(III) in particular are due to the coincidental match of ligand and metal orbitals and not enhanced overlap of the f-orbitals. This has been termed “near-degeneracy driven covalency”.10q
A thorough understanding of the electronic structure of the actinides is still lacking in some areas. However it is of great importance since it underpins separation science studies and further experimental and theoretical studies are required to fully understand the subtleties of actinide chemistry. In this contribution we report for the first time the photoluminescent properties of some simple U(IV) coordination compounds that have previously been prepared, viz. [Et4N]2[UCl6] and [UCl4(THF)3], and the synthesis and comprehensive characterisation of [Li(THF)4][UCl5(THF)]. A comprehensive computational study on the electronic absorption and emission spectra of these compounds has been carried out using CASSCF techniques. In addition a thorough analysis of the bonding in the U–Cl bond is explored via an NBO (Natural Bond Order) and AIM (atoms-in-molecules) approach.
Results and discussion
Synthesis and structure
In order to probe the use of photoluminescence spectroscopy of non-aqueous U(IV) species, simple model compounds are required that have no quenching processes arising from ligands containing aromatic groups or conjugated entities. It occurred to us that the well defined [UCl6]2− anion would be a useful starting point; however the high symmetry of this compound may suggest that any formally symmetry forbidden bands would not be seen. A reduction in the symmetry around the metal ion would therefore be more informative. We reasoned that compounds such as [UCl5(THF)]− and [UCl4(THF)3] (of C4v and C2v symmetry, respectively) would be more amenable for our initial studies. The compound UCl4 was prepared as described in the literature and all characterisation data were in agreement with those previously reported. The reaction of UCl4 with one equivalent of dry LiCl in THF, followed by filtration and recrystallisation yielded [Li(THF)4][UCl5(THF)], 1 in excellent yield as a pale green air sensitive crystalline solid. The structure of this compound has previously been reported as a by-product formed during a salt metathesis reaction.13 The analogous compound [nBu4N][UCl5(THF)] has also been previously reported.14 The corresponding halides [Li(THF)n][UBr5(THF)], 2, and [Li(THF)n][UI5(THF)], 3, were prepared by the reaction of 1 with Me3SiX (X = Br, I). Whilst the bromide compound was stable in solution, we found that the iodide was substantially more air sensitive and only mixtures of [UI5(THF)]− and [UO2I4]2−, the latter as the major product, were observed by UV-vis absorption spectroscopy (vide infra), even under rigorously anhydrous and oxygen-free conditions. Hayton et al. have prepared the related compound [H(OEt2)2][UI5(OEt2)] and reported that it decomposes in donor solvents, but the nature of this decomposition was not described.15 The 1H NMR spectra of 1 and 2 in pyridine-d6 show the presence of uncoordinated THF suggesting that this ligand is rather labile. Due to this, we have been unable to obtain reproducible elemental analyses as they are consistently low in carbon and hydrogen. There is a single resonance in the 7Li NMR spectra of 1 and 2 in THF at δLi = −2.64 ppm and −0.97 ppm, respectively, which indicates that in solution they exist as separated ions, as any interaction with the paramagnetic uranium centre would be expected to induce large pseudocontact chemical shifts. The infrared and Raman spectra show bands that can be assigned to the coordinated THF molecule, whilst a U–Cl stretch can be seen at 305 cm−1 in the Raman spectrum. Confirmation of the U(IV) oxidation state comes from the variable temperature and variable field magnetic susceptibility of 1, with a region of temperature independent paramagnetism from 300 to 100 K (μeff = 2.04 μB at 300 K) followed by a precipitous drop in the magnetic moment (μeff = 0.40 μB at 10 K)16 (Fig. S1 and S2, ESI†). This compares well to the magnetic susceptibility recorded for [Ph3PBu]2[UCl6] (2.22 μB at 295 K),17 and lower than the value of 3.38 μB expected for a pure 3H4 ground state. This reduction in effective moment compared to the free ion at room temperature is common in U(IV) compounds and has been ascribed to quenching of spin–orbit coupling due to covalent metal–ligand interactions.Crystals of 1 suitable for X-ray diffraction were grown and the metric parameters around the uranium are as reported previously.13,14 One interesting structural feature is that the Cleq–U–O angles are 85.3° (average) as the uranium atom sits slightly above the equatorial plane by 0.2 Å. The average bond length (2.60 Å) can be compared to the U(III) compound K2UCl5 (2.80 Å)18 and the U(V) compound [UCl5(OPPh3)] (2.47–2.50 Å).19 The expected bond lengths, on the basis of the 6-coordinate ionic radii,20 are 2.43 Å, 2.56 Å and 2.695 Å for U(V), (IV) and (III) respectively, suggesting the bonding in 1 is primarily ionic. The nature of the bonding in [Cp*2MCl2]10d and [MCl6]2− (Cp* = C5Me5; M4+ = Ti, Zr, Hf, Th, U)21 has recently been experimentally investigated using Cl K-edge X-ray absorption (XAS) spectroscopy and for uranium a contribution of 9% and 18% Cl 3p orbital are involved in the U–Cl bonds, respectively; i.e. a small degree of covalency.
Electronic spectroscopy
 | ||
| Fig. 1 UV absorption spectra of 1 (red line) and 2 (black line) in THF at ca. 1 mmol concentration (* indicates uranyl impurity). | ||
The band at 303 nm exhibits a red-shift on halide substitution (to 322 nm in 2), which indicates that this is likely to be a CT band containing a contribution from a halide to uranium charge transfer process. In order to ascertain the presence and direction of a charge transfer band (i.e. LMCT or MLCT) we have used cyclic voltammetry (CV). The electrochemistry of 1 has been previously reported, with a reduction potential of −2.75 V (vs. Ag/Ag+ at 298 K) and no observable oxidation wave.14 We observe identical electrochemical behaviour, and have re-examined the electrochemistry at variable temperatures as this enables the thermodynamic parameters to be extracted. Thus, a plot of the redox potential vs. temperature allows ΔS and ΔH to be determined.221 shows a well-defined temperature dependence and the thermodynamic parameters are ΔH = 464 kJ mol−1 and ΔS = 666 J mol−1 K−1 (Fig. S4, ESI†). Entropy is measured directly in this technique, whilst there are some errors associated with the enthalpy, it should be taken as a relative measure rather than an absolute one. Nevertheless, the large enthalpy is to be anticipated as the redox potential of −2.75 V suggests that 1 is difficult to reduce. We suggest that the use of temperature dependent CV may become a useful tool in studying the thermodynamics of actinide compounds. The electrochemistry of 2 shows analogous behaviour (Fig. S5, ESI†), with the reduction potential of −2.03 V for the reduction wave. This indicates that any charge transfer must be LMCT in character, and the decrease in the reduction potential for 2 is in accord with the bathochromic shift observed in the UV absorption spectrum. The variable temperature electrochemistry gives ΔH = 336 kJ mol−1 and ΔS = 471 J mol−1K−1, in keeping with the less negative redox potential observed in 1. Of note is that under no experimental conditions were we able to observe a U(IV)/U(V) oxidation in either 1 or 2; the lack of an oxidation potential has commonly been observed in previous systematic reports of CV investigations of U(IV) compounds with σ-donating ligands8h as the U(V) species formed is unstable with respect to disproportionation on the CV timescale. Important exceptions to this observation are [Cp3U(NEt2)],23 and [(C5H4R)3UCl] (R = H, Me, tBu, SiMe3).24 Except for the mono(amide) complex, the U(IV)/U(V) couple is proposed to be linked to a subsequent chemical reaction, which presumably involves disproportionation of the U(V) species. Notably the UV-vis absorption spectra of the compounds [Et4N]2[UCl6] and UCl4 in anhydrous THF are remarkably similar to 1 and display absorption maxima at 280 nm, 307 nm, 331 nm ([Et4N]2[UCl6]) and 260, 290 and 334 nm for [UCl4(THF)3]25 (Fig. S6, ESI†), suggesting that the change in symmetry does not have a noticeable effect and that a THF to uranium charge transfer band can be discounted.
The bands observed in the visible and NIR region for 1 are the formally Laporte forbidden f → f transitions of the U4+ 5f2 ion (Fig. 2). The molar absorptivity of these bands is typical for this type of actinide compound (ε ≈ 5–40 M−1 cm−1) and higher than observed in lanthanide(III) complexes due to the greater radial extension of the 5f orbitals compared to the 4f orbitals. The spectrum of 1 can be deconvoluted and, using previously published energy level diagrams derived from experimental data26 and computational studies (vide infra), the f–f transitions in 1 can be fully assigned. The highest energy f–f transition to the 1S0 state is likely to be buried under the more intense bands in the UV region. Interestingly, this band is significantly lowered upon solvation (U4+(g), 221 nm (45![[thin space (1/6-em)]](https://www.rsc.org/images/entities/char_2009.gif) 316 cm−1); U4+(aq), 245 nm (40820 cm−1)),7,27 and suggests it may be sensitive to the coordination environment.
316 cm−1); U4+(aq), 245 nm (40820 cm−1)),7,27 and suggests it may be sensitive to the coordination environment.
 | ||
| Fig. 2 Assignment of intraconfigurational f–f transitions in 1 (insert shows bands in the region 1750–2000 nm). | ||
An interesting comparison can be made to the [UCl6]2− anion. Hydrogen bonding is generally sufficient to distort the geometry so that symmetry forbidden bands can be observed, albeit with molar absorption coefficients ε = 2–5 M−1 cm−1.28 We initially postulated that a lowering of the local symmetry from Oh to C4v in 1 would allow any symmetry-forbidden bands to be observed. Due to the air-sensitive nature of these solutions, it was difficult to accurately determine the concentration, and we anticipate that there may be a reasonable error associated with our determined ε values. However, the observed colour of equimolar solutions of 1 and [UCl6]2− (Fig. S7, ESI†) supports the rather surprising outcome that molar absorption coefficients of 1 are lower than [UCl6]2−. Interestingly, there appears to be little difference in the energy of the bands for both 1 and [UCl6]2−, which suggests that the local symmetry is not as important as the coordination geometry and crystal field effects are not large. Whilst the uranyl was the major decomposition product in the isolation of 3, the f–f transitions occur in a region where this ion does not absorb. These transitions for 2 and 3 are rather similar, as seen in Fig. S3, ESI†. This is as expected if the crystal field effects are small, resulting in negligible perturbation of the 5f manifold.
:LiYF4,5a although the photoluminescent spectra are considerably more resolved; an effect of increased vibrational coupling of the excited electronic states in fluid solution. The compounds 2 and 3 also exhibit broadly similar emission profiles, albeit with small blue shifts (ca. 20 nm for 2, Fig. 3b). The emission spectra for [UCl6]2− (Fig. S8, ESI†) and [UCl4(THF)3] (Fig. 3c) are comparable, as expected from the similarities in the absorption spectra. Using the assignments from the absorption spectra and CASPT2 calculations (vide infra), the bands in the emission spectra can be assigned as transitions from the 5f16d1 state to the 3F3 (1, 365 nm; 2, 384 nm; [UCl6]2−, 364 nm; [UCl4(THF)3], 365 nm), 1G4 (1, 421 nm; 2, 442 nm; [UCl6]2−, 424 nm; [UCl4(THF)3], 408 nm) and 3P1 (1, 518 nm; 2, 541 nm; [UCl6]2−, 510 nm; [UCl4(THF)3], 500 nm) 5f2 states. However as the bands are quite broad the emissions are most probably due to an envelope of energy levels; this is borne out to a certain extent by analysis of the CASPT2 calculated transitions and comparison to the assignments in earlier reports on doped systems. We were unable to measure the quantum yield for all compounds in this study as the emissions are weak, but the intensity of these emissions are comparable to the Raman bands from the solvent; the data in Fig. 3 has these bands removed, (Fig. S9, ESI† displays the raw data).
![(a) Emission spectrum of 1 in THF (λex = 303 nm); (b) emission spectrum of 2 in THF (λex = 325 nm); (c) emission spectrum of [UCl4(THF)3] in THF (λex = 290 nm), all measured at 298 K (Raman bands have been subtracted).](/image/article/2013/RA/c3ra22712j/c3ra22712j-f3.gif) | ||
| Fig. 3 (a) Emission spectrum of 1 in THF (λex = 303 nm); (b) emission spectrum of 2 in THF (λex = 325 nm); (c) emission spectrum of [UCl4(THF)3] in THF (λex = 290 nm), all measured at 298 K (Raman bands have been subtracted). | ||
All excitation spectra recorded at the respective emission maxima (ca. 365, 420 and 510 nm) are wavelength independent and strongly suggest that the emission bands originate from a common excited state (Fig. S10 and S11, ESI†), which is in broad agreement with the emission lifetime data. Under the concentrations measured (absorbance units of 0.2 for the CT band at 303 nm; ca. 1 μM) there is a small Stokes shift of 10 nm, that may be due to the comparatively high concentration. The observed emission lifetime of 1 is ∼4 ns and is independent of emission wavelength (365 nm, 421 nm and 518 nm) confirming that each band originates from the same emissive state. Comparable emission lifetimes are observed for 2, 3, [UCl6]2− and [UCl4(THF)3]. We note that the lifetimes are multiexponential when reconvolution of the kinetic data is employed (Fig. S12, ESI†) giving lifetime values in the range 2–10 ns. Such behaviour may suggest that multiple radiative processes are occurring in fluid solution and that radiative decay may involve more than one excited state. This is possibly due to the fact that the emission bands encompass an envelope of excited state configurations, however we cannot eliminate a contribution from aggregate emission as the cause of this deviation from monoexponentiality and further studies are being conducted. Similar decay kinetics for the analogous emission bands in [UCl4(THF)3] and [UCl6]2− were also measured. By comparison, the emissive lifetimes of the seven resolvable 5f16d1 → 5f2 charge transfer bands in the system U:LiYF4 are 17 ns and for the macrocyclic complex [U(DO3A)]Br (DO3A = [4,7,10-tris-carboxymethyl-1,4,7,10-tetraaza-cyclododec-1-yl]-acetic acid) the radiative lifetimes range 8–12 ns. This indicates that photo-induced electron transfer from the chloride ions in the complexes 1, [UCl6]2− and UCl4 may act to quench the emission to a certain degree and/or bimolecular deactivation with labile THF solvent molecules may increase the rate of radiative decay. However, when compared to the organometallic compound in the metallocene ketimide system [Cp*2U{NC(Ph)(CH2Ph)}2] (Cp* = C5Me5), the lifetimes are long and easily measured using commercial instrumentation. Unfortunately, we have been unable to directly excite into the visible and near infra-red f–f U(IV) transitions (e.g. at ca. 420, 640, 880 and 980 nm) and observe emission in all complexes studied, even in more concentrated solutions (millimolar rather than micromolar) using our current equipment. This is not unexpected due to the low molar absorption coefficients observed for these transitions (Fig. 2).
Low temperature (77 K) emission experiments were also conducted to enable better spectral resolution such that transitions to individual energy levels may be assigned. The 77 K emission spectra of all compounds in this study were consistently observed to be a mixture of U(IV) and a uranyl moiety, assigned on the basis of the diagnostic vibronically coupled uranyl peak centred at 524 nm (Fig. 4). In order to ensure that the U(IV) spectrum we observe does not come from a [UVIO2]2+ species, a solution of [Li(THF)4][UCl5(THF)] in THF/pyridine was exposed to air and the room temperature emission spectrum observed over time (Fig. 5). This clearly shows the decrease in intensity of the U(IV) species and an increase in the vibronically coupled [UO2]2+ band. After standing for a period of time, small yellow crystals suitable for X-ray analysis were deposited in the cuvette and the structure was determined to be [PyH]2[UO2Cl6] (Fig. S13, ESI†); the structure is unremarkable, with metric parameters typical for this ion.30 This structure determination proved our hypothesis that the spectrum is due to the uranyl(VI) ion as the low temperature emission spectrum of these crystals dissolved in THF show features that are identical to that shown in Fig. 5.
 | ||
| Fig. 4 Emission spectrum of 1 in THF at 77 K (λex = 303 nm). | ||

CASPT2 study of 5f16d1–5f2 transitions.
State averaged CASSCF (complete-active-space self-consistent-field)31 calculations were performed using version 7.6 of the MOLCAS code.32 Dynamic correlation was included via multiconfigurational 2nd order perturbation theory (CASPT2).33 Whilst DFT calculations show a small degree of covalency in the U–Cl bond (vide infra), the bonding is essentially ionic and therefore the Cl orbitals are not included in these calculations.34 All possible 5f2 and 5f16d1 configurations were considered, resulting in 119 states in the absence of spin orbit coupling, which was included using the RASSI formalism.35 This resulted in a total of 231 spin–orbit coupled states. Although the reduced symmetry of the complexes considered in this study means that atomic term symbols cannot be rigorously defined, the weak ligand field experienced by the uranium ion means that those dominated by 5f2 configurations can be approximated, and these approximate term symbols are quoted here. Throughout this discussion energies and states will be given only for [UCl5(THF)]−; for the corresponding [UCl6]2− and [UCl4(THF)3] data, the reader is referred to Table 1.| 5f2 State | λ (nm) [UCl6]2− | λ (nm) [UCl5(THF)]− | λ (nm) [UCl4(THF)3] |
|---|---|---|---|
| 3H4 | 256 (1) | 251 (1) | 241(1) |
| 3F2 | 291 (0.33) | 290 (0.29) | 275 (0.38) |
| 3H5 | 304 (0.14) | 292 (0.16) | 284 (0.17) |
| 3F4 | 310 (0.14) | 310 (0.086) | 319 (0.17) |
| 3F3 | 337 (0.14) | 334 (0.14) | 323 (0.12) |
| 364 | 365 | 365 | |
| 3H6 | 325 (0.04) | 334 (0.029) | 327 (0.030) |
| 1G4 | 439 (0.017) | 428 (0.018) | 413 (0.026) |
| 424 | 421 | 408 | |
| 1D2 | 468 (5.3 × 10⁻³) | 453 (5.0 × 10⁻³) | 388 (0.01) |
| 3P1 | 600 (2.7 × 10⁻³) | 554 (3.2 × 10⁻³) | 494 (5.0 × 10⁻³) |
| 510 | 518 | 500 |
The CASPT2 calculations (Fig. 6) reveal that the 5f2 and 5f16d1 manifolds interact only very weakly in the presence of spin orbit coupling, with the exception of the high energy 1S0 5f2 state. In the absence of any 5f16d1 contribution this state is calculated to lie 49500 cm−1 (202 nm) above the ground state; inclusion of the 5f16d1 states results in significant stabilisation, to 42600 cm−1 (235 nm). The extent of the mixing is revealed when the contribution of the 5f2 spin–orbit free terms to the latter states is considered; this contribution is 24%. The lowest lying 5f16d1 state is calculated to lie at 38600 cm−1 (259 nm; cf. 277 nm in the experimental spectrum) and so clearly, the 5f16d1 manifold begins at a lower energy than the 1S0 state (Fig. 6). Of the other 5f2 states, the highest in energy is calculated to lie at 28500 cm−1 (351 nm) and analysis of the calculated emission spectrum strongly supports the view that the observed emissions are due to 5f16d1 → 5f2 transitions. Furthermore, the excitation wavelength (λex = 260 to 390 nm) implies that the observed transitions originate from the lower part of the 5f16d1 manifold, most probably the 3F2 state. Bearing this in mind, a subgroup of all calculated transitions was used in order to interpret the observed emission spectra. This subgroup consisted only of transitions originating from states in the 5f16d1 manifold lying ≤44400 cm−1 (≥225 nm) above the ground state (i.e. just above the calculated position of the 5f2 1S0 state) and having an oscillator strength f ≥ 10−5. This reduced the number of considered transitions from 24627 to 915. The analysis reveals that the effect of the ligand environment is to significantly broaden all transitions, and so the positions quoted here are obtained as the peak value of all transitions to a given 5f2 state combined.
![Computed mean ground and excited state energy levels and assignments for U4+ in H2O, [UCl6]2−, [UCl5(THF)]− and [UCl4(THF)3]. Note a PCM solvent continuum of H2O was used in the calculations of U4+, but no explicit water molecules ligated to the U(iv) centre were included, meaning the 1S0 state may be artificially high in energy.](/image/article/2013/RA/c3ra22712j/c3ra22712j-f6.gif) | ||
| Fig. 6 Computed mean ground and excited state energy levels and assignments for U4+ in H2O, [UCl6]2−, [UCl5(THF)]− and [UCl4(THF)3]. Note a PCM solvent continuum of H2O was used in the calculations of U4+, but no explicit water molecules ligated to the U(IV) centre were included, meaning the 1S0 state may be artificially high in energy. | ||
An intense peak is calculated at 251 nm and corresponds to a transition into the 3H4 ground-state of the 5f2 manifold. Two strong peaks are calculated at 290 and 292 nm and correspond to transitions into the 3F2 and 3H5 states, respectively. An intense peak is calculated at 334 nm and is primarily due to a transition into the 3F3 state, with a small component corresponding to a transition into 3H6. Since there are no other transitions calculated to be in this energy range, we assign the experimentally observed transition at 365 nm as being into the 3F3 state. A weaker transition into the 1G4 state is calculated at 428 nm and is assigned to the observed transition at 421 nm. There is also a very weak contribution to this peak from a transition into the 1D2 state at 453 nm. At longer wavelengths, transitions become very broad and weak; the strongest transition is into the 3P1 state at 554 nm, which we assign to the observed transition at 518 nm. No significant peaks are calculated at longer wavelengths.
On the basis of the experimental and computational results presented herein, we propose that excitation into a band of charge transfer and 6d orbital character leads to electron transfer into the f-orbital manifold. Final evidence that the emission arises from the f-orbitals comes from the observation that no photoluminescence spectra are obtained when [ThCl4(DME)2]36 is examined.37 The f-orbitals on the closed shell Th(IV) ion are known to be much higher in energy and generally not involved in bonding. Notably, the absorption, excitation and emission spectra for all the chloride complexes studied are similar, which supports the argument that in fluid solution at least, the geometry and local symmetry at the U(IV) ion have a minor effect on the optical properties of the complex. However, the CASPT2 data indicate that the energies and the relative ordering of the Russell-Saunders coupled levels derived from the 5f2 configuration show a degree of sensitivity to site symmetry and crystal field effects as might be anticipated for this 5f ion. The observation that emission spectra of U(IV) can be measured in the presence of [UVIO2]2+ may be of substantial benefit in environmental applications. Importantly, the relatively large quantum yield of uranyl(VI) emission in a frozen glass means that trace quantities can be detected alongside U(IV); the U(IV) emission can be removed by applying a time gate and time delay (e.g. 0.05 μs).
Computational study of the bonding in 1.
In order to gain further insight into the electronic structure of these compounds, especially degree of covalency in the U–Cl bonds, we turn to density functional theory (DFT), which is increasingly being utilised in this field.38 Geometry optimisation of triplet [UCl5(THF)]− at a number of levels of theory results in a distorted octahedral geometry with C2 symmetry. A comparison between the calculated and experimentally determined bond lengths and angles are reported in Table S1, (ESI†). The DFT geometries generally reproduce the solid-state geometry, with one short U–Cl bond and Cl–U–O angle of less than 90°, but overestimate the U–O bond length. In addition, comparison of the experimentally determined U–Cl stretch in the Raman spectrum (305 cm−1) against BP86 (289.8 cm−1) and B3LYP (294.5 cm−1) (Fig. S14–S16, ESI†) confirms the suitability of these methods to describe the bonding in 1.With this in mind, comparison of α- and β-spin NBOs demonstrates that the two unpaired electrons in the triplet state reside in orthogonal f-orbitals on U, thus giving rise to a highly localised distribution of spin density (Fig. 7a). NBO analysis leads to an electron configuration on U of [core]7s0.275f3.046d1.687p0.50, and an overall atomic charge on U of −0.033. Charges on Cl vary slightly between −0.244 and −0.230, and the overall charge on THF is +0.202. Thus, NBO analysis indicates significant charge transfer from THF to U, and much smaller atomic charges than the formal U(IV) assignment would suggest. One or more natural bonding orbitals are found between U and each Cl, and within the THF unit, but no such overlap is located between U and O. A single NBO is located between U and the axial chloride, weighted heavily (83%) in favour of Cl and involving both s- and p-orbitals on Cl interacting with s-, p-, d- and f-orbitals on U (Table 2 and Fig. 7b). Orbitals with similar make-up are found between U and all four equatorial chlorides (Fig. 7c), but here a second set of orbitals with π-symmetry that consist of Cl p-orbitals donating into U d- and f-orbitals (Fig. 7d) are also found.
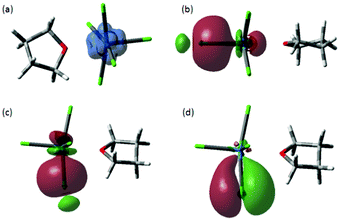 | ||
| Fig. 7 (a) DFT spin density and isosurfaces for σ-natural bonding orbitals in (b) U–Clax and (c) U–Cleq and (d) π-natural bonding orbitals in orbitals in U–Cleq of the anionic component of 1. | ||
| U / Cl | U s / p / d / f | Cl s / p | |
|---|---|---|---|
| U–Clax | 16.9 / 83.1 | 20 / 26 / 41 / 14 | 54 / 46 |
| U–Cleq | 17.5 / 82.5 | 15 / 17 / 35 / 32 | 52 / 48 |
| U–Cleq | 10.6 / 89.4 | 0 / 10 / 47 / 43 | 1 / 99 |
| U–Cleq | 17.5 / 82.5 | 16 / 17 / 35 / 32 | 52 / 48 |
| U–Cleq | 10.8 / 89.2 | 0 / 10 / 47 / 43 | 1 / 99 |
NBO analysis proceeds by first defining a Lewis structure that best describes the molecule, and then reporting deviations from this in terms of donor–acceptor interactions between formally occupied and vacant NBOs. This 2nd-order perturbation theory analysis indicates significant overlap between U and O, despite the lack of a formal orbital for this interaction. This consists of donation from a p-type lone pair on O into a mixture of d- and f-orbitals on U, whose bond energy is estimated at 49.6 kcal mol−1. This perturbation analysis also identifies numerous but weak donor–acceptor interactions from chloride lone pairs into formally empty d- and f-orbitals on U. These are present for all five chlorides, but their sum is noticeably larger for U–Clax (55 kcal mol−1) than the four equatorial chlorides (39–43 kcal mol−1).
The HOMO consists of an f-orbital localised on the uranium centre with an antibonding contribution to the axial chloride, whilst the LUMO is a different f-orbital with an antibonding contribution to the equatorial chlorides (Fig. 8). The HOMO–LUMO gap of the α-spin is calculated to be 3.83 eV (30891cm−1); the corresponding gap for the β-spin is 3.41 eV (39572cm−1).
 | ||
| Fig. 8 HOMO and LUMO α-spin orbitals of 1 at the BP86 level. | ||
Atoms in molecules description
Atoms in molecules (AIM) analysis concentrates on the topology of the electron density, and gives complementary information to that from NBO. It has begun to be utilised for actinide compounds.39 AIM analysis looks for bond critical points (BCP) between two atoms, and the chemical bonding can be characterised by the properties of these BCPs. Table 3 reports properties evaluated at bond critical points for U–X bonds in a series of compounds, and for comparison ThCl4 and LaCl3. For 1, ρ and ∇2ρ suggest that these bonds are predominantly ionic. Variations in ρ within symmetry-unique U–Cl bonds are small, but more significant changes are apparent in∇2ρ and ε between axial and equatorial bonds. This reflects the significant π-character of the latter, which reduces the overall curvature but increases the asymmetry of the density at the BCP, but by symmetry, cannot directly affect ρ. However, energy density and bond order do not show the expected increase in strength of the equatorial bonds relative to the axial one, perhaps reflecting the importance of the greater second-order interactions in the latter. ρ in the U–O bond is significantly less than in all U–Cl bonds. Further evidence for the relative weakness of this bond comes from the zero value of H, indicating a balance of kinetic and potential energies, and the low value of the integrated bond order; this supports the experimental observation of the lability of the coordinated THF. AIM also defines atomic charge by numerical integration of the electron density within each atomic basin: values calculated in this way are significantly different to those from NBO and suggest much greater ionicity. U is found to have an overall charge of +2.26, and chlorides vary −0.66 to −0.67. THF is very close to neutral (overall charge of +0.04).| Compound | ρ | ∇2ρ | ε | H | Bond Order | Ref. | |
|---|---|---|---|---|---|---|---|
| 1 | U–Clax | 0.072 | +0.165 | 0.004 | −0.019 | 0.78 | this work |
| U–Cleq | 0.070 | +0.142 | 0.090 | −0.017 | 0.75 | ||
| U–Cleq | 0.071 | +0.143 | 0.096 | −0.018 | 0.76 | ||
| U–O | 0.046 | +0.132 | 0.132 | 0.000 | 0.31 | ||
| Cp4U | U–C | 0.034 | +0.089 | 2.11 | −0.001 | n.r. | 39a |
| Cp3U | U–C | 0.040 | +0.115 | 1.31 | −0.003 | n.r. | 39a |
| ThCl4 | Th–Cl | 0.081 | +0.157 | 0.011 | −0.024 | n.r. | 39a |
| LaCl3 | La–Cl | 0.066 | +0.159 | 0.009 | −0.011 | n.r. | 39a |
| [(Tren)U-RuCp(CO)2] | U–Ru | 0.0425 | +0.0605 | n.r. | −0.008 | n.r. | 39d |
Conclusions
In conclusion, we have shown that simple U(IV) coordination compounds are emissive at room temperature and these transitions can be assigned on the basis of experimental and computational assignments of the absorption spectrum. Notably for the first time the f–f transitions in the electronic absorption and emission spectra can be unambiguously assigned via a CASSCF study. The emission spectra can be explained by excitation into a band of charge transfer and d-orbital character followed by rather inefficient electron transfer to the 5f-orbitals. The lifetimes for these compounds are all in the range of 2–10 ns and multiexponential, hinting at complex deactivation and/or quenching processes. Interestingly the emission for U(IV) can be observed in the presence of U(VI), which may be of significant interest in environmental applications. Finally a comprehensive computational investigation of the bonding in [Li(THF)4][UCl5(THF)] (1) has shown that although mainly ionic, there is a contribution to the U–Cl bond from the 5f and 6d orbitals of up to 17%. A π-interaction of mainly U 5f and 6d character and Cl p orbital has been observed. An AIM analysis of the bonding confirms the presence of this interaction.Experimental details
General methods
Caution! Natural uranium was used during the course of these experiments. As well as the radiological hazards, uranium is a toxic metal and care should be taken with all manipulations. Experiments using uranium materials were carried out using pre-set radiological safety precautions in accordance with the local rules of The University of Manchester or Trinity College Dublin.All manipulations were carried out using standard Schlenk and glove box techniques under an atmosphere of high purity argon. 1H and 7Li NMR spectra were recorded on a Bruker AV400 spectrometer operating at 400.23 MHz and 155.54 MHz, respectively, and were referenced to the residual 1H resonances of the solvent used or external LiCl. IR spectra were recorded on a Perkin Elmer Spectrum One spectrometer with attenuated total reflectance (ATR) accessory. Raman spectra were obtained using 785 nm excitation on a Renishaw 1000 micro-Raman system in sealed capillaries. Thermal scans of magnetization in a 100 mT field from 4–300 K were carried out using a 5T Quantum Design MPMS XL SQUID magnetometer. Powdered samples were mounted in gel caps, which have a temperature-independent diamagnetic susceptibility, in a glove box and the gel caps were placed in sample straws for the measurement. Diamagnetic corrections were made using Pascal's constants.40 Multiple measurements were taken to ensure reproducibility. Electrochemical measurements were undertaken with an AUTOLAB PGSTAT12 potentiostat/galvanostat using a platinum disc electrode with a reaction surface of 1 mm2 as working electrode. A platinum rod electrode (together with internal referencing versus [Cp2Fe]0/+) was used as a reference electrode and a platinum knob electrode as auxiliary electrode. All measurements took place in a glove box under an atmosphere of high purity nitrogen, [nBu4N][BPh4] (0.1 M) was used as electrolyte. X-ray crystallography was measured on a Rikagu Saturn diffractometer. The structures were solved by direct methods and refined on F2 by full matrix least squares (SHELX97)41 using all unique data. Crystal data, details of data collections and refinement are given in Table S2, ESI†. UV-vis/NIR measurements were made on either a Perkin Elmer Lambda 1050 spectrometer or a double-beam Cary Varian 500 scan UV-vis–NIR spectrophotometer over the range 300–1300 nm using fused silica cells with a path length of 1 cm. Steady-state emission spectra were recorded in Young's tap appended quartz cuvettes on an Edinburgh Instrument FP920 Phosphorescence Lifetime Spectrometer equipped with a 5 watt microsecond pulsed xenon flashlamp (with single 300 mm focal length excitation and emission monochromators in Czerny Turner configuration) and a red sensitive photomultiplier in peltier (air cooled) housing (Hamamatsu R928P) or on a Horiba-Jobin-Yvon Fluorolog-3 spectrometer. Lifetime data were recorded following 375 nm and 405 nm excitation with an EPL 375 and EPL 405 picosecond pulsed diode laser (Edinburgh Instruments), using time correlated single photon counting (PCS900 plug-in PC card for fast photon counting). Lifetimes were obtained by tail fit on the data obtained or by a reconvolution fit using a solution of Ludox® in water as the scatterer, and quality of fit judged by minimization of reduced chi-squared and residuals squared.
Uranium stocks were obtained from the Centre for Radiochemistry Research (CRR) isotopes store at The University of Manchester or TCD's stocks. THF was distilled over potassium whilst d5-pyridine was dried over Na, distilled and degassed immediately prior to use. Spectroscopic measurements used spectroscopic grade solvents which were purchased from commercial sources and dried over potassium or potassium/benzophenone, molecular sieves and thoroughly degassed before use. [UCl4(THF)3]42 and [Et4N]2[UCl6]43 were made via the literature procedures whilst all other reagents were obtained from commercial sources. LiCl was dried by refluxing in freshly distilled SOCl2 overnight, washing with copious CH2Cl2 and finally drying under vacuum. Me3SiX (X = Br, I) was dried over 4 Å molecular sieves and freeze–pump–thaw degassed immediately prior to use. Attempts at obtaining elemental analysis were consistently low in C, H and O, due to the lability of the solvated THF.
Preparation of [Li(THF)4][UCl5(THF)], 1. To a suspension of LiCl (11 mg, 0.26 mmol) in THF (10 cm3) was added a solution of UCl4 (100 mg, 0.26 mmol) in THF (10 cm3) and this was stirred for 24 h. The resulting green solution was filtered and the solvent reduced in volume. Placement at −30 °C overnight yielded pale green crystals suitable for X-ray diffraction (150 mg, 0.19 mmol, 74%). MPt: 145–148 °C; Raman (cm−1): 1185, 1138, 1027, 997, υ(THF) 305, υ(U–Cl); UV-vis--NIR (ε (mol dm−3 cm−1): (THF, ∼0.36 mmol) 277 (832), 303 (1384), 331 (258), (THF, ∼3.6 mmol) 404 (0.76), 428 (1.11), 452 (2.39), 484 (0.87), 599 (3.72), 627 (2.25), 655 (1.21), 667 (2.14), 778 (1.59), 909 (0.59), 1098 (7.81), 1227 (0.62), 1356 (1.60), 1571 (4.80), 1843 (15.83), 1970 (7.14) nm. δLi (THF, 298 K): −2.64 ppm.
Preparation of [Li(THF)4][UBr5(THF)], 2. To a solution of 1 (50 mg, 0.064 mmol) in THF (5 cm3) was added Me3SiBr in excess. The solution was stirred for 24 h and the solvent removed in vacuo. Dissolution in THF and placement at −30 °C overnight yielded dark green powder (42 mg, 0.042 mmol, 66%) UV-vis-NIR (ε (mol dm−3 cm−1): (THF, ∼0.36 mmol): 277 (889), 325 (617), 350 (170), 433 (0.22), 464 (1.05), 483 (0.37), 554 (0.11), 614 (0.98), 632 (1.05), 664 (0.31), 670 (0.56), 795 (0.36) nm; δLi (THF, 298 K): −0.97 ppm.
Preparation of [Li(THF)4][UI5(THF)], 3. To a solution of 1 (50 mg, 0.064 mmol) in THF (5 cm3) was added Me3SiI in excess. The solution was stirred for 24 h to give a pale yellow solution. The solvent was removed in vacuo and dissolution in THF followed by placement at −30 °C overnight yielded a yellow powder that contained 3 and [Li(solv)]2[UO2I4] which could not be separated. Spectroscopic data were obtained on this mixture. UV-vis: 252, 295, 365, 597, 626, 653, 669, 776 nm; Emission spectrum (THF, 298 K): 354, 412, 508, nm.
Computational details
DFT geometry optimisation was performed on a single molecule of [UCl5(THF)]−, extracted from the crystal structure, at the unrestricted BP86/def2-TZVP44,45 level using Turbomole46 within C2 symmetry. Scalar relativistic effects in uranium were included through use of effective core potentials, as defined for this basis set. Spin contamination was not significant, with values of S2 within 1% of the anticipated value of 2.00. Further single-point DFT calculations were performed in Gaussian0947 using the BP86 and B3LYP48 functionals. The (27 s 24p 18d 14f 6 (g)/[8s 7p 5d 3f 1g] all-electron ANO-RCC basis sets of DZP quality were used for uranium,49 with 6-31+G(d,p) on C, O, H and Cl.50 Scalar relativistic effects were included via the second-order Douglas–Kroll–Hess Hamiltonian.51 Natural bond orbital (NBO) analysis52 was performed using Gaussian09; Atoms-in-Molecules (AIM) analysis used AIMAll.53 Topological analysis of the electronic density (ρ) is based upon those points where the gradient of the density, ∇ρ, vanishes.54 In this work we consider points where one curvature (in the inter-nuclear direction) is positive and two (perpendicular to the bond direction) are negative, termed (3, −1) or bond critical points. Properties evaluated at such points characterise the bonding interactions present. The second derivative of ρ or Laplacian, ∇2ρ, and the bond ellipticity, the ratio of the two negative curvatures, are reported, as is the local energy density, H, defined as the sum of the kinetic and potential energy densities. An electron density (ρ) of 0.2 a.u. or greater typically signifies a covalent bond and less than 0.1 a.u. indicates closed shell (ionic, Van der Waals etc.). The Laplacian of this function (∇2ρ) is typically significantly negative for covalent bonding and positive for closed shell interactions. The ellipticity, ε, measures the shape of the electron density distribution in a plane through the BCP and thus determines the degree of cylindrical symmetry in a bond. H is the total energy density (kinetic + potential energy) and is typically negative for covalent bonds. This reveals whether accumulation of electronic density is stabilising (E < 0) or destabilising (E > 0). Integrated properties of atoms were checked for numerical accuracy via the basin integral of the Laplacian, which should vanish for properly defined atomic basins (all values 10−4 or less), and also by comparison of the sum of all atomic integrals with directly calculated molecular values. Integration of the overlap matrix over atomic basins can be used to derive covalent bond order, as set out by Angyan et al.55 State averaged CASSCF (complete-active-space self-consistent-field)56 calculations were performed using version 7.6 of the MOLCAS code.57 Calculations were performed using the all-electron ANO-RCC basis set,58 of polarised triple-zeta quality, and scalar relativistic effects were included via the Douglas–Kroll–Hess Hamiltonian.59 In these calculations, the two open shell uranium electrons were explicitly correlated in an active space of thirteen orbitals, comprising the 5f, 6d and 7s uranium orbitals. Dynamic correlation was included via multiconfigurational 2nd order perturbation theory (CASPT2).33 A Polarisable Continuum Model was utilised for U(IV).Acknowledgements
We thank TCD (RJB and EH) and the EPSRC Career Acceleration Fellowship Scheme (LSN, ANS, AK) for funding this work. JAP and AK are grateful to UK National Service for Computational Chemistry Software. We also thank Dr Venkatesan and Prof. J. M. D. Coey (School of Physics, TCD) for SQUID measurements and Prof. John M. Kelly (TCD) for useful discussions. COST Action CM1006 is also gratefully acknowledged.Notes and references
- (a) J.-C. G. Bünzli, Chem. Rev., 2010, 110, 2729 CrossRef; (b) K. N. Allen and B. Imperiali, Curr. Opin. Chem. Biol., 2010, 14, 247 CrossRef CAS; (c) E. G. Moore, A. P. S. Samuel and K. N. Raymond, Acc. Chem. Res., 2009, 42, 542 CrossRef CAS; (d) C. M. G. dos Santos, A. J. Harte, S. J. Quinn and T. Gunnlaugsson, Coord. Chem. Rev., 2008, 252, 2512 CrossRef CAS; (e) J.-C. G. Bünzli and S. V. Eliseeva, J. Rare Earths, 2010, 28, 824 CrossRef; (f) J. Rocha, L. D. Carlos, F. A. Almeida Paz and D. Ananias, Chem. Soc. Rev., 2011, 40, 926 RSC; (g) M. D. Ward, Coord. Chem. Rev., 2010, 254, 2634 CrossRef CAS; (h) L. S. Natrajan, Curr. Inorg. Chem., 2011, 1, 61 Search PubMed; (i) S. Faulkner, L. S. Natrajan, W. S. Perry and D. Sykes, Dalton Trans., 2009, 3890 RSC.
- (a) L. S. Natrajan, Coord. Chem. Rev., 2012, 256, 1583 Search PubMed; (b) I. Billard and G. Geipel, in Springer Series on Fluorescence, ed. U. Resch-Genger, Springer Berlin Heidelberg, 2008, vol. 5, pp. 465–492 Search PubMed; (c) H. D. Burrows and M. D. G. Miguel, Adv. Colloid Interface Sci., 2001, 89–90, 485 CrossRef CAS; (d) C. P. Baird and T. J. Kemp, in Progress in Reaction Kinetics, 1997, vol. 22, p. 87 Search PubMed; (e) R. G. Denning, J. Phys. Chem. A, 2007, 111, 4125 CrossRef CAS.
- M. P. Redmond, S. M. Cornet, S. D. Woodall, D. Whittaker, D. Collison, M. Helliwell and L. S. Natrajan, Dalton Trans., 2011, 40, 3914 RSC.
- (a) G. Geipel, Coord. Chem. Rev., 2006, 250, 844 CrossRef CAS; (b) G. Liu and J. V. Beitz, in The Chemistry of the Actinide and Transactinide Elements, ed. L. R. Morss, N. M. Edelstein and J. Fuger, Springer, Dordrecht, The Netherlands, 2010 Search PubMed; (c) D. Girnt, P. W. Roesky, A. Geist, C. M. Ruff, P. J. Panak and M. A. Denecke, Inorg. Chem., 2010, 49, 9627 CrossRef CAS.
- (a) S. V. Godbole, A. G. Page, Sangeeta, S. C. Sabharwal, J. Y. Gesland and M. D. Sastry, J. Lumin., 2003, 93, 213 Search PubMed; (b) S. Hubert, E. Simoni, M. Louis, W. T. Zhang and J. Y. Gestland, J. Lumin., 1994, 60, 245 Search PubMed; (c) M. Genet, P. Delamoye, N. Edelstein and J. Conway, J. Chem. Phys., 1977, 67, 1620 Search PubMed; (d) E. Simoni, S. Hubert and M. Genet, J. Phys., 1988, 49, 1425 Search PubMed; C. Khan Malek, J. C. Krupa, P. Delamoye and M. Genet, J. Phys., 1986, 47, 1763 Search PubMed; (e) C. D. Flint and P. A. Tanner, Mol. Phys., 1984, 53, 429 Search PubMed; C. Khan Mallek and J. C. Krupa, J. Chem. Phys., 1986, 84, 6584 Search PubMed; (f) B. Ordejón, V. Vallet, J.-P. Flament, L. Seijoa and Z. Barandiarána, J. Lumin., 2007, 126, 779 Search PubMed; (g) B. Ordejón, M. Karbowiak, L. Seijo and Z. Z. Barandiarána, J. Chem. Phys., 2006, 125, 074511 CrossRef.
- (a) A. Kirishima, T. Kimura, O. Tochiyama and Z. Yoshida, Chem. Commun., 2003, 910 RSC; (b) A. Kirishima, T. Kimura, R. Nagaishi and O. Tochiyama, Radiochim. Acta, 2004, 92, 705 CrossRef CAS.
- C. Danilo, V. Vallet, J.-P. Flament and U. Wahlgren, Phys. Chem. Chem. Phys., 2010, 12, 1116 RSC.
- (a) R. K. Thomson, B. L. Scott, D. E. Morris and J. L. Kiplinger, C. R. Chim., 2010, 13, 790 CrossRef CAS; (b) R. K. Thomson, C. R. Graves, B. L. Scott and J. L. Kiplinger, Dalton Trans., 2010, 39, 6826 RSC; (c) T. Cantat, C. R. Graves, K. C. Jantunen, C. J. Burns, B. L. Scott, E. J. Schelter, D. E. Morris, P. J. Hay and J. L. Kiplinger, J. Am. Chem. Soc., 2008, 130, 17537 CrossRef CAS; (d) D. J. Hilton, R. P. Prasankumar, E. J. Schelter, V. K. Thorsmolle, S. A. Trugman, A. P. Shreve, J. L. Kiplinger, D. E. Morris and A. J. Taylor, J. Phys. Chem. A, 2008, 112, 7840 CrossRef CAS; (e) E. J. Schelter, P. Yang, B. L. Scott, J. D. Thompson, R. L. Martin, P. J. Hay, D. E. Morris and J. L. Kiplinger, Inorg. Chem., 2007, 46, 7477 CrossRef CAS; (f) R. E. Da Re, K. C. Jantunen, J. T. Golden, J. L. Kiplinger and D. E. Morris, J. Am. Chem. Soc., 2005, 127, 682 CrossRef CAS; (g) A. E. Clark, R. L. Martin, P. J. Hay, J. C. Green, K. C. Jantunen and J. L. Kiplinger, J. Phys. Chem. A, 2005, 109, 5481 Search PubMed; (h) D. E. Morris, R. E. Da Re, K. C. Jantunen and I. Castro-Rodríguez, Organometallics, 2004, 23, 5142 CrossRef CAS.
- L. Petit, A. Borel, C. Daul, P. Maldivi and C. Adamo, Inorg. Chem., 2006, 45, 7382 Search PubMed.
- For leading references see: (a) P. L. Arnold, Z. Turner, N. Kaltsoyannis, P. Pelekanaki, R. Bellabarba and R. Tooze, Chem.–Eur. J., 2010, 16, 9623 CrossRef CAS; (b) M. J. Tassell and N. Kaltsoyannis, Dalton Trans., 2010, 39, 6719 RSC; (c) J. A. Bradley, S. SenGupta, G. T. Seidler, K. T. Moore, M. W. Haverkort, G. A. Sawatzky, S. D. Conradson, D. L. Clark, S. A. Kozimor and K. S. Boland, Phys. Rev. B: Condens. Matter Mater. Phys., 2010, 81, 193104 Search PubMed; (d) S. A. Kozimor, P. Yang, E. R. Batista, K. S. Boland, C. J. Burns, D. L. Clark, S. D. Conradson, R. L. Martin, M. P. Wilkerson and L. E. Wolfsberg, J. Am. Chem. Soc., 2009, 131, 12125 CrossRef CAS; (e) L. Maron, O. Eisenstein and R. A. Andersen, Organometallics, 2009, 28, 3629 CrossRef CAS; (f) K. I. M. Ingram, M. J. Tassell, A. J. Gaunt and N. Kaltsoyannis, Inorg. Chem., 2008, 47, 7824 CrossRef CAS; (g) R. G. Denning, J. Phys. Chem. A, 2007, 111, 4125 CrossRef CAS; (h) I. D. Prodan, G. E. Scuseria and R. L. Martin, Phys. Rev. B: Condens. Matter Mater. Phys., 2007, 76, 033101 CrossRef; (i) K. I. M. Ingram, N. Kaltsoyannis, A. J. Gaunt and M. P. Neu, J. Alloys Compd., 2007, 444–445, 369 CrossRef CAS; (j) A. J. Gaunt, S. D. Reilly, A. E. Enriquez, B. L. Scott, J. A. Ibers, P. Sekar, K. I. M. Ingram, N. Kaltsoyannis and M. P. Neu, Inorg. Chem., 2007, 46, 29 Search PubMed; (k) C. J. Burns and M. S. Eisen, in The Chemistry of the Actinide and Transactinide Elements, ed. L. R. Morss, N. M. Edelstein and J. Fuger, Springer, Dordrecht, The Netherlands, 3rd edn, 2006, Vol. 5, p. 2799 Search PubMed; (l) R. G. Denning, J. C. Green, T. E. Hutchings, C. Dallera, A. Tagliaferri, K. Giarda, N. B. Brookes and L. J. Braicovich, Chem. Phys., 2002, 117, 8008 Search PubMed; (m) M. Mazzanti, R. L. Wietzke, J. Pecaut, J.-M. Latour, P. Maldivi and M. Remy, Inorg. Chem., 2002, 41, 2389 CrossRef CAS; (n) B. B. Iversen, F. K. Larsen, A. A. Pinkerton, A. Martin, A. Darovsky and P. A. Reynolds, Inorg. Chem., 1998, 37, 4559 CrossRef CAS; (o) J. Li and B. E. Bursten, J. Am. Chem. Soc., 1997, 119, 9021 CrossRef CAS; (p) J. G. Brennan, R. A. Andersen and J. L. Robbins, J. Am. Chem. Soc., 1986, 108, 335 CrossRef CAS; (q) M. L. Neidig, D. L. Clark and R. L. Martin, Coord. Chem. Rev., 2013, 257, 394 Search PubMed.
- For recent references see (a) M. J. Hudson, L. M. Harwood, D. M. Laventine and F. W. Lewis, Inorg. Chem., 2012 DOI:10.1021/ic3008848; (b) A. E. V. Gorden, M. A. DeVore II and B. A. Maynard, Inorg. Chem., 2012 DOI:10.1021/ic300887p; (c) D. Girnt, P. W. Roesky, A. Geist, C. M. Ruff, P. J. Panak and M. A. Denecke, Inorg. Chem., 2010, 49, 9627 CrossRef CAS; (d) Z. Kolarik, Chem. Rev., 2008, 108, 4208 CrossRef CAS; (e) C. Madic, B. Boullis, P. Baron, F. Testard, M. J. Hudson, J.-O. Liljenzin, B. Christiansen, M. Ferrando, A. Facchini, A. Geist, G. Modolo, A. G. Espartero and J. De Mendoza, J. Alloys Compd., 2007, 444–445, 23 CrossRef CAS; (f) L. Petit, C. Daul, C. Adamo and P. Maldivi, New J. Chem., 2007, 31, 1738 RSC; (g) L. Petit, C. Adamo and P. Maldivi, Inorg. Chem., 2006, 45, 8517 CrossRef CAS; (h) G. R. Choppin and K. L. Nash, Radiochim. Acta, 1995, 70–71, 225.
- N. Kaltsoyannis, Inorg. Chem., 2012 DOI:10.1021/ic3006025.
- B. M. Gardner, W. Lewis, A. J. Blake and S. T. Liddle, Inorg. Chem., 2011, 50, 9631 CAS.
- O. Maury, M. Ephritikhine, M. Nierlich, M. Lance and E. Samuel, Inorg. Chim. Acta, 1998, 279, 210 CrossRef CAS.
- D. D. Schnaars, G. Wu and T. W. Hayton, Dalton Trans., 2009, 3681 RSC.
- (a) B. S. Newell, T. C. Schwaab and M. P. Shores, Inorg. Chem., 2011, 50, 12108 CrossRef CAS; (b) I. Castro-Rodríguez, K. Olsen, P. Gantzel and K. Meyer, J. Am. Chem. Soc., 2003, 125, 4565 CrossRef CAS; (c) J. D. Rinehart, T. D. Harris, S. A. Kozimor, B. M. Bartlett and J. R. Long, Inorg. Chem., 2009, 48, 3382 CrossRef CAS; (d) O. P. Lam, C. Anthon, F. W. Heinemann, J. M. Connor and K. Meyer, J. Am. Chem. Soc., 2008, 130, 6567 CrossRef CAS; (e) M. J. Monreal, C. T. Carver and P. L. Diaconescu, Inorg. Chem., 2007, 46, 7226 CrossRef CAS; (f) Y. L. Lai, R. K. Chiang, K. H. Lii and S. L. Wang, Chem. Mater., 2008, 20, 523 CrossRef CAS; (g) L. Salmon, P. Thuery, E. Riviere, S. Miyamoto, T. Yamato and M. Ephritikhine, New J. Chem., 2006, 30, 1220 RSC; (h) G. Nocton, F. Burdet, J. Pecaut and M. Mazzanti, Angew. Chem., Int. Ed., 2007, 46, 7574 CrossRef CAS; (i) G. Nocton, J. Pecaut and M. Mazzanti, Angew. Chem., Int. Ed., 2008, 47, 3040 CrossRef CAS; (j) S. Fortier, B. C. Melot, G. Wu and T. W. Hayton, J. Am. Chem. Soc., 2009, 131, 15512 CrossRef CAS; (k) E. J. Schelter, D. E. Morris, B. L. Scott, J. D. Thompson and J. L. Kiplinger, Inorg. Chem., 2007, 46, 5528 CrossRef CAS.
- J. P. Day and L. M. Venanzi, J. Chem. Soc. A, 1966, 197 RSC.
- K. Krämer, H. U. Güdel, G. Meyer, T. Heuer, N. N. Edelstein, B. Jung, L. Keller, P. Fischer, E. Zych and J. Drozdzynski, Z. Anorg. Allg. Chem., 1994, 620, 1339.
- G. Bombieri, D. Brown and C. Mealli, J. Chem. Soc., Dalton Trans., 1976, 2025 RSC.
- R. D. Shannon, Acta Cryst., 1976, A32, 751 CrossRef CAS.
- S. G. Minasian, J. M. Keith, E. R. Batista, K. S. Boland, D. L. Clark, S. D. Conradson, S. A. Kozimor, R. L. Martin, D. E. Schwarz, D. K. Shuh, G. L. Wagner, M. P. Wilkerson, L. E. Wolfsberg and P. Yang, J. Am. Chem. Soc., 2012, 134, 5586 Search PubMed.
- C. Schulzke, Dalton Trans., 2009, 6683 RSC.
- F. Ossola, P. Zanella, P. Ugo and R. Seeber, Inorg. Chim. Acta, 1988, 147, 123 CrossRef CAS.
- C. Clappe, D. Leveugle, D. Hauchard and G. Durand, J. Electroanal. Chem., 1998, 448, 95 CrossRef CAS.
- UCl4 dissolved in THF exists as the monomeric tris THF adduct in dilute conditions/optically dilute conditions. See: A. I. Komyak, A. P. Zazhogin, D. S. Umreiko and A. A. Lugovsky, J. Appl. Spectrosc., 2009, 76, 167 Search PubMed and W. G. van der Sluys, J. M. Berg, D. Barnhardt and N. N. Sauer, Inorg. Chim. Acta, 1993, 204, 251 Search PubMed.
- (a) R. A. Satten, C. L. Schreiber and E. Y Wong, J. Chem. Phys., 1965, 42, 162 Search PubMed; (b) W. Wagner, N. Edelstein, B. Whittaker and D. Brown, Inorg. Chem., 1977, 16, 1021 Search PubMed; (c) M. Karbowiak, A. Mech and J. Drożdżyński, Chem. Phys., 2005, 308, 135 Search PubMed.
- (a) C. Danilo, V. Vallet, J. -P. Flament and U. Wahlgren, J. Chem. Phys., 2008, 128, 154310 CrossRef; (b) I. Infante, E. Eliav, M. J. Vilkas, Y. Ishikawa, U. Kaldor and L. Visscher, J. Chem. Phys., 2007, 127, 124308 CrossRef.
- (a) J. L. Ryan, Inorg. Chem., 1964, 3, 211 Search PubMed; (b) E. Bossé, C. Den Auwer, C. Berthon, P. Guilbaud, M. S. Grigoriev, S. Nikitenko, C. Le Naour, C. Cannes and P. Moisy, Inorg. Chem., 2008, 47, 5746 CrossRef CAS.
- At the time of publishing this manuscript, one of us also reported the optical properties of U(IV) encapsulated in the tetraazamacrocyle DO3A in degassed MeOH and DMF in which the absorption and emission spectra are comparable to those reported here; L.S. Natrajan, Dalton Trans., 2012, 41, 13167 Search PubMed.
- See for example R. J. Baker, E. Hashem, M. Motevalli, H. V. Ogilvie and A. Walshe, Z. Anorg. Allg. Chem., 2010, 653, 443 Search PubMed.
- B. Roos, P. R. Taylor and P. E. M. Siegbahn, Chem. Phys., 1980, 48, 157 CrossRef CAS.
- G. Karlström, et al. , Comput. Mater. Sci., 2003, 28, 222 CrossRef.
- K. Anderson, P.-Å. Malmqvist, B. O. Roos, A. J. Sadlej and K. Wolinskit, J. Phys. Chem., 1990, 94, 5483 CrossRef CAS.
- K. Pierloota and E. van Besien, J. Chem. Phys., 2005, 123, 204309 CrossRef.
- P.-Å. Malmqvist, B. O. Roos and B. Schimmelpfennig, Chem. Phys. Lett., 2002, 357, 230 CrossRef CAS.
- T. Cantat, B. L. Scott and J. L. Kiplinger, Chem. Commun., 2010, 46, 919 RSC.
- Photoluminescence from [Th(PO3C6H4CO2H)F2] has been reported, but it arises from the ligand. P. O. Adelani and T. E. Albrecht-Schmitt, Inorg. Chem., 2010, 49, 5701 Search PubMed.
- For recent reviews see (a) G. Schreckenbach and G. A. Shamov, Acc. Chem. Res., 2010, 43, 19 CrossRef CAS; (b) L. Gagliardi and B. O. Roos, Chem. Soc. Rev., 2007, 36, 893 RSC; (c) N. Kaltsoyannis, Chem. Soc. Rev., 2003, 32, 9 RSC; I. Kirker and N. Kaltsoyannis, Dalton Trans., 2011, 40, 124 RSC; (d) M. J. Tassell and N. Kaltsoyannis, Dalton Trans., 2010, 39, 6719 RSC; (e) D. Wang, W. F. van Gunsterenb and Z. Chai, Chem. Soc. Rev., 2012, 41, 5836 RSC.
- (a) M. J. Tassell and N. Kaltsoyannis, Dalton Trans., 2010, 39, 6719 RSC; (b) P. L. Arnold, Z. R. Turner, N. Kaltsoyannis, P. Pelekanaki, R. M. Bellabarba and R. P. Tooze, Chem.–Eur. J., 2010, 16, 9623 CrossRef CAS; (c) A. E. Clark, J. L. Sonnenberg, P. J. Hay and R. L. Martin, J. Chem. Phys., 2004, 121, 2563 CrossRef CAS; (d) L. Petit, L. Joubert, P. Maldivi and C. Adamo, J. Am. Chem. Soc., 2006, 128, 2190 CrossRef CAS; (e) I. Kirker and N. Kaltsoyannis, Dalton Trans., 2011, 40, 124 RSC; (f) B. M. Gardner, D. Patel, A. D. Cornish, J. McMaster, W. Lewis, A. J. Blake and S. T. Liddle, Chem.–Eur. J., 2011, 17, 11266 Search PubMed; (g) V. Vallet, U. Wahlgren and I. Grenthe, J. Phys. Chem. A, 2012, 116, 12373 Search PubMed.
- G. A. Bain and J. F. Berry, J. Chem. Educ., 2008, 85, 532–536 CrossRef CAS.
- G. M. Sheldrick, SHELXL-97, University of Göttingen, Göttingen, Germany, 1998.
- J. L. Kiplinger, D. E. Morris, B. L. Scott and C. J. Burns, Organometallics, 2002, 21, 5978 CrossRef CAS.
- D. Brown, J. Chem. Soc. A, 1966, 766 RSC.
- (a) A. D. Becke, Phys. Rev. A, 1988, 38, 3098–100 CrossRef CAS; (b) J. P. Perdew, Phys. Rev. B, 1986, 33, 8822–24 CrossRef.
- F. Weigend and R. Ahlrichs, Phys. Chem. Chem. Phys., 2005, 7, 3297 RSC.
- Turbomole v5.10, R. Ahlrichs, M. Baer, M. Haeser, H. Horn and C. Koelmel, Chem. Phys. Lett., 1989, 162, 165 CrossRef CAS.
- Gaussian 09, Revision B.01, M. J. Frisch, G. W. Trucks, H. B. Schlegel, G. E. Scuseria, M. A. Robb, J. R. Cheeseman, G. Scalmani, V. Barone, B. Mennucci, G. A. Petersson, H. Nakatsuji, M. Caricato, X. Li, H. P. Hratchian, A. F. Izmaylov, J. Bloino, G. Zheng, J. L. Sonnenberg, M. Hada, M. Ehara, K. Toyota, R. Fukuda, J. Hasegawa, M. Ishida, T. Nakajima, Y. Honda, O. Kitao, H. Nakai, T. Vreven, J. A. Montgomery Jr., J. E. Peralta, F. Ogliaro, M. Bearpark, J. J. Heyd, E. Brothers, K. N. Kudin, V. N. Staroverov, T. Keith, R. Kobayashi, J. Normand, K. Raghavachari, A. Rendell, J. C. Burant, S. S. Iyengar, J. Tomasi, M. Cossi, N. Rega, J. M. Millam, M. Klene, J. E. Knox, J. B. Cross, V. Bakken, C. Adamo, J. Jaramillo, R. Gomperts, R. E. Stratmann, O. Yazyev, A. J. Austin, R. Cammi, C. Pomelli, J. W. Ochterski, R. L. Martin, K. Morokuma, V. G. Zakrzewski, G. A. Voth, P. Salvador, J. J. Dannenberg, S. Dapprich, A. D. Daniels, O. Farkas, J. B. Foresman, J. V. Ortiz, J. Cioslowski and D. J. Fox, Gaussian, Inc., Wallingford CT, 2010.
- (a) A. D. Becke, J. Chem. Phys., 1993, 98, 5648–52 CrossRef CAS; (b) C. Lee, W. Yang and R. G. Parr, Phys. Rev. B, 1988, 37, 785–89 CrossRef CAS.
- B. O. Roos, R. Lindh, P.-Å. Malmqvist, V. Veryazov and P.-O. Widmark, J. Phys. Chem. A, 2008, 112, 11431–11435 CrossRef CAS.
- (a) W. J. Hehre, R. Ditchfield and J. A. Pople, J. Chem. Phys., 1972, 56, 2257 CrossRef CAS; (b) T. Clark, J. Chandrasekhar, G. W. Spitznagel and P. V. R. Schleyer, J. Comput. Chem., 1983, 4, 294 CrossRef CAS; (c) P. C. Hariharan and J. A. Pople, Theor. Chim. Acta, 1973, 28, 213 CrossRef CAS.
- G. Jansen and B. A. Hess, Phys. Rev. A, 1989, 39, 6016–17 CrossRef and references cited therein.
- A. E. Reed and F. Weinhold, J. Chem. Phys., 1985, 83, 1736–40 CrossRef.
- T. Keith, AIMAll http://aim.tkgristmill.com.
- R. F. W. Bader "Atoms in Molecules-A Quantum Theory", Oxford University Press, Oxford, 1990 Search PubMed.
- T. Kar, J. G. Angyan and A. B. Sannigrahi, J. Phys. Chem. A, 2000, 104, 9953 CrossRef CAS.
- B. O. Roos, P. R Taylor and P. E. M Siegbahn, Chem. Phys., 1980, 48, 157 CrossRef CAS.
- G. Karlström et al., MOLCAS: a program package for computational chemistry, Comput. Mater. Sci., 2003, 28, 222 CrossRef.
- B. O. Roos, R. Lindh, P.-Å. Malmqvist, V. Veryazov and P.-O. Widmark, J. Phys. Chem. A, 2004, 108, 2851 CrossRef CAS; B. O. Roos, R. Lindh, P.-Å. Malmqvist, V. Veryazov and P.-O. Widmark, Chem. Phys. Lett., 2005, 409, 295 CrossRef CAS.
- M. Douglas and N. Kroll, Ann. Phys., 1974, 155, 89 Search PubMed; B. Hess, Phys. Rev. A, 1986, 33, 3742 CrossRef CAS.
Footnote |
| † Electronic supplementary information (ESI) available: Full electronic absorption and emission spectra and computational assignments, SQUID magnetometry data of 1 and VT CV data of 1 and 2. CCDC reference number 907974. For ESI and crystallographic data in CIF or other electronic format see DOI: 10.1039/c3ra22712j |
| This journal is © The Royal Society of Chemistry 2013 |