 Open Access Article
 This Open Access Article is licensed under a Creative Commons Attribution-Non Commercial 3.0 Unported Licence
Thinking continuously: a microreactor for the production and scale-up of biodegradable, self-assembled nanoparticles
Christina Petschachera, Andreas Eitzlmayrb, Maximilian Besenhardcd, Julian Wagnere, Jan Barthelmesf, Andreas Bernkop-Schnürchf, Johannes G. Khinastbc and Andreas Zimmer*a
aDepartment of Pharmaceutical Technology, Institute of Pharmaceutical Sciences, University of Graz, Humboldtstraße 46, 8010 Graz, Austria. E-mail: andreas.zimmer@uni-graz.at; Fax: +43 316 380-9100; Tel: +43 316 380-8881
bInstitute for Process and Particle Engineering, Graz University of Technology, Inffeldgasse 13, 8010 Graz, Austria
cResearch Center Pharmaceutical Engineering GmbH, Inffeldgasse 13, 8010 Graz, Austria
dSiemens AG Österreich/Corporate Technology, Straßganger Straße 315, 8054 Graz, Austria
eInstitute for Electron Microscopy, Graz University of Technology, Steyrergasse 17, 8010 Graz, Austria
fDepartment of Pharmaceutical Technology, Institute of Pharmacy, University of Innsbruck, Josef-Möller-Haus, Innrain 52, 6020 Innsbruck, Austria
First published on 21st January 2013
Abstract
Scale-up of nanoparticle batch productions continues to be a major challenge in the pharmaceutical nanotechnology. Continuously operating microreactors have great potential to circumvent the scale-up difficulties. In this work a passive microreactor was used for the first time for the electrostatic self-assembly of biodegradable, mucoadhesive thiomer–protamine nanoparticles for drug delivery. The influence of three different parameters (the overall flow rate, the educt mass ratio and the molecular weight of the thiomer) on the particle characteristics was tested for the microreactor production and compared to the results of a successful 1 ml-batch reaction. As the flow rate increased (2, 5, 9, 16 ml min−1), the particle sizes and the polydispersity indexes decreased. In addition, the protamine![[thin space (1/6-em)]](https://www.rsc.org/images/entities/char_2009.gif) :5 kDa thiomer binding ratio and hence the zeta potential, as a measure of the suspension's stability, increased to >+40 mV due to better mixing during the microreactor production at a flow rate of 16 ml min−1. Producing nanoparticles from different mass ratios of 5 kDa thiomer:protamine (1:1, 1:3, 1:5) in the microreactor at this flow rate resulted in smaller particles with more distinct zeta potentials than those prepared by the 1 ml-batch reaction. Using a higher molecular weight thiomer (30 kDa) for the microreactor production at a flow rate of 16 ml min−1 led to slightly increased mean particle sizes (125.0 nm) compared to those produced by the 1 ml-batch reaction (102.9 nm). However, there was still a decrease in the width of the particle size distributions. In addition to the experimental work, a numerical model based on the population balance equation was developed. The results presented in this paper are in agreement with the experimental findings, especially with regard to the trends of decreased particle size and polydispersity with the increasing flow rate. The model results confirm that mixing effects to a great extent determine the particle size distribution of the resulting nanoparticles and show that spatial inhomogeneity of the mixing process must be taken into account. The unprecedented use of a passive microreactor for the production of biodegradable thiomer–protamine nanoparticles by electrostatic self-assembly was a success. Due to the reactor's continuous way of operation, not only were the scale-up problems of batch reactions overcome, but particle characteristics were also improved because of a better mixing effect.
:5 kDa thiomer binding ratio and hence the zeta potential, as a measure of the suspension's stability, increased to >+40 mV due to better mixing during the microreactor production at a flow rate of 16 ml min−1. Producing nanoparticles from different mass ratios of 5 kDa thiomer:protamine (1:1, 1:3, 1:5) in the microreactor at this flow rate resulted in smaller particles with more distinct zeta potentials than those prepared by the 1 ml-batch reaction. Using a higher molecular weight thiomer (30 kDa) for the microreactor production at a flow rate of 16 ml min−1 led to slightly increased mean particle sizes (125.0 nm) compared to those produced by the 1 ml-batch reaction (102.9 nm). However, there was still a decrease in the width of the particle size distributions. In addition to the experimental work, a numerical model based on the population balance equation was developed. The results presented in this paper are in agreement with the experimental findings, especially with regard to the trends of decreased particle size and polydispersity with the increasing flow rate. The model results confirm that mixing effects to a great extent determine the particle size distribution of the resulting nanoparticles and show that spatial inhomogeneity of the mixing process must be taken into account. The unprecedented use of a passive microreactor for the production of biodegradable thiomer–protamine nanoparticles by electrostatic self-assembly was a success. Due to the reactor's continuous way of operation, not only were the scale-up problems of batch reactions overcome, but particle characteristics were also improved because of a better mixing effect.
1 Introduction
The development and production of nanoparticles for drug delivery and drug targeting is a highly promising research field in pharmaceutical technology. The nanometer-size of these delivery systems enhances the apparent solubility and bioavailability of drugs and offers access to some previously inaccessible parts of the body. Nanoparticles may also be linked to certain molecules, such as peptides or amino acids, making it possible to target the drug to specific sites of action and therefore reducing its side effects. Moreover, within the nanoparticles drugs can be protected from hydrolytic and enzymatic degradation and their release can be controlled via the design and matrix constituents of the nanoparticles.1–4 Although significant progress has been made in this field during the last few years, product placement continues to be a challenge because of one limiting and often underestimated factor: the scale-up.5 The successful transfer from lab- to industrial scale is essential for bringing a product to the market and therefore should be considered from the very start. Current scale-up strategies in nanotechnology mainly exist for “top down” processes, during which the materials are reduced in size, e.g., via high pressure homogenization and milling.6 “Bottom up” approaches, such as self-assembly and precipitation of nanoparticles, frequently create scale-up difficulties due to changing conditions and less efficient mixing in the increased reaction volumes.7 How can these scale-up problems be overcome? – Stop producing batch-wise and start thinking continuously…Microreactors are innovative instruments for continuous mixing of small fluid streams. Although they may range in sizes from chips as small as thumbnails to devices of the meter scale, they all have one essential part: a microchannel with a diameter ≤1 mm.8 Within this microchannel the mixing effect is achieved via diffusion which may be further enhanced by chaotic advection due to special geometric wall designs and internals of the microchannel, e.g., obstructions and enlargements (passive microreactors) or external energy input and moving parts (active microreactors).9,10 Microreactors have several advantages: the small fluid streams make fast mass and heat transfer possible, the production costs are low and the parameters can be set precisely. To further increase the production volume, microreactor units can easily be “numbered-up” by raising the number of devices working in parallel.11
During the last decade continuous flow microreactors have attracted significant interest. In the field of pharmaceutical nanotechnology, microreactors have mainly been investigated with regard to API (= active pharmaceutical ingredient) synthesis, the preparation of pure drug nanoparticles without a matrix system and inorganic nanoparticles.12–17 However, the production of organic nanoparticulate matrix systems for drug delivery in microreactors has hardly been studied to date.18 Karnik et al. manufactured PLGA–PEG nanoparticles via nanoprecipitation in a microfluidic channel using hydrodynamic flow focusing. In addition to the influence of different flow rates and PLGA concentrations, the encapsulation and release of docetaxel were tested.19 Rondeau and Cooper-White prepared alginate nanoparticles in a microfluidic reactor via solvent diffusion and subsequent cross-linking to CaCl2 off-chips.20 The production of solid lipid nanoparticles in different flow-focusing microchannel systems and the analysis of such influencing factors as flow rates and concentrations were the aim of Chen's group.21–23 Organic nanocarriers are particularly important because in most cases they are biodegradable. Hence, within the next few years microreactors will become increasingly important for the continuous production of organic, nanoparticulate matrix systems for use as drug targeting vehicles.24,25
The aim of this work is the investigation of a passive microreactor for the manufacture of biodegradable, self-assembled thiomer–protamine nanoparticles used as drug carrier systems. It presents a novel approach to the nanoparticle preparation via electrostatic self-assembly. Thiomers are negatively charged polyacrylic acids that are combined with amino acid cysteine to increase mucoadhesion. Protamine is a positively charged polypeptide. Due to electrostatic interactions, self-assembled nanoparticles form if the solutions of the two components mix sufficiently fast.26–28 The positive charge of the resulting particles presents an additional advantage in respect of mucoadhesion as glycosylated mucin fibres are negatively charged.29 In the past the self-assembled nanoparticles were only reproducibly created via batch reactions with volumes of ≤2 ml. Larger volumes resulted in unstable particles with a tendency to aggregate because the mixing rate in these volumes was lower than the particle formation rate.11 This work investigates in detail the production scale-up of thiomer–protamine nanoparticles via a passive microreactor, comparing the results of a 1 ml-batch reaction with the microreactor production. In order to increase the process understanding a new numerical model of the precipitation process was developed, offering a detailed analysis of the process and a tool for design, optimization and scale-up.
2 Results
Among the wide variety of passive microreactors, capillary-tube microreactors scaled down from normal tubular reactors are the simplest and most flexible.18 For our experiments a stainless steel capillary-tube microreactor with a special T-junction with porous mixing plates at the inlets was manufactured, which created intense mixing of small educt streams for the thiomer–protamine nanoparticle production. In addition to the T-junction, a microchannel of 5 consecutive hair-pin tubes (Ø 1 mm) with integrated obstructions and porous mixing plates was developed to intensify the mixing effect during the nanoparticles' self-assembly.30Fig. 1 shows a schematic of the microreactor. See section 5.4 (“Microreactor production”) for details.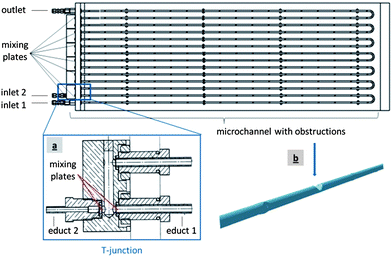 | ||
| Fig. 1 Schematic of the microreactor: a T-junction at the inlet (a) and a geometric wall design of the microchannel (b).30 | ||
The scale-up experiments in this study were divided into three main categories. First, the influence of different flow rates on the characteristics of nanoparticles was tested. In addition to these laboratory tests, a mechanistic model for the prediction of the nanoparticle formation within the microreactor was developed. Second, the formation of nanoparticles with different mass ratios of thiomer to protamine was investigated. Finally, thiomers of different molecular weight were used for the continuous nanoparticle preparation. All of the results were compared with those obtained for the 1 ml-batch reaction.
2.1 Flow rate
The main questions were whether the continuous production of self-assembled nanoparticles could be accomplished in the microreactor and which flow rate was necessary to obtain nanoparticles sized <200 nm. Higher flow rates increase local mixing and thus, smaller particles can be expected. For biodegradable, soft materials particle sizes of <300 nm are a reasonable goal.31 The present work focused on thiomer–protamine nanocarriers <200 nm since the combination with drugs in future experiments will increase the size of the nanoparticles. To investigate the influence of the flow rate on the size and size distribution of nanoparticles, increasing flow rates of 2, 5, 9 and 16 ml min−1 were used for the nanoparticle production from the 5 kDa thiomer:protamine mass ratio of 1:3. Particle sizes for all cases over a period of one month were measured by Dynamic Light Scattering (DLS) and are compared in Fig. 2 with those for the 1 ml-batch reaction. A flow rate of 2 ml min−1 resulted in particles of over 200 nm, whereas mean particle sizes of 149.0 ± 2.2 nm, 107.8 ± 1.3 nm and 96.1 ± 1.3 nm were obtained for flow rates of 5, 9 and 16 ml min−1, respectively, 24 hours after the production. Nanoparticles produced via the 1 ml-batch reaction had a mean particle size of 131.5 ± 1.5 nm. Scanning Electron Microscopy (SEM) images of the nanoparticles confirmed these particle sizes (data not shown). Zeta potentials of nanoparticles produced via 1 ml-batch reaction and in the microreactor (at a flow rate of 16 ml min−1) were +30.6 ± 3.0 mV and +42.0 ± 1.2 mV, respectively, 24 hours after the production (Table 1). This variance may be due to the different binding efficiencies of the two educts within the products. Nanoparticles produced via the 1 ml-batch reaction comprised 119.7 ± 2.0 μg ml−1 protamine and 96.4 ± 0.2 μg ml−1 thiomer, whereas nanoparticles produced in the microreactor at a flow rate of 16 ml min−1 consisted of 152.2 ± 13.2 μg ml−1 protamine and 83.0 ± 6.8 μg ml−1 thiomer (Table 1). From Table 2 it is clear that polydispersity of the particle size distributions decreases with the increasing flow rate. Furthermore the microreactor production at a flow rate of 16 ml min−1 results in lower polydispersity than the 1 ml-batch reaction.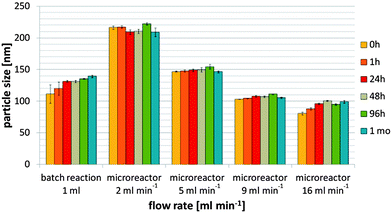 | ||
| Fig. 2 1 ml-batch reaction versus microreactor production at different flow rates: particle sizes of the nanoparticles produced from the 5 kDa thiomer:protamine mass ratio of 1:3. | ||
:protamine mass ratio of 1:3
| ZP [mV] | pH | Binding ratio protamine/thiomer | |
|---|---|---|---|
| Thiomer, 5 kDa: | |||
| Batch reaction, 1 ml | +30.6 ± 3.0 | 9.2 | 1.24 |
| Microreactor, 16 ml min−1 | +42.0 ± 1.2 | 8.1 | 1.83 |
| Thiomer, 30 kDa: | |||
| Batch reaction, 1 ml | +46.5 ± 0.6 | 8.3 | 1.53 |
| Microreactor, 16 ml min−1 | +42.8 ± 0.9 | 8.0 | 1.91 |
:protamine mass ratio of 1:3
| Polydispersity index | 0 h | 24 h | >1 month |
|---|---|---|---|
| Batch reaction, 1 ml | 0.129 ± 0.020 | 0.126 ± 0.025 | 0.115 ± 0.009 |
| Microreactor, 2 ml min−1 | 0.265 ± 0.004 | 0.263 ± 0.004 | 0.244 ± 0.017 |
| Microreactor, 5 ml min−1 | 0.165 ± 0.003 | 0.148 ± 0.006 | 0.148 ± 0.010 |
| Microreactor, 9 ml min−1 | 0.120 ± 0.009 | 0.159 ± 0.010 | 0.146 ± 0.009 |
| Microreactor, 16 ml min−1 | 0.071 ± 0.014 | 0.112 ± 0.018 | 0.108 ± 0.007 |
In addition to the experiments, a theoretical analysis of the results was carried out. The model was based on the population balance equation (PBE) and comprises nucleation, growth and agglomeration phenomena. To account for mixing effects at different length scales, the engulfment model was coupled to the PBE, which allowed a time-dependent analysis of the particle formation. A detailed description of the model and results for the 1 ml-batch reaction was published recently.32 It was found that the original model failed to reproduce the measurements well and had to be modified. The results of three modifications are presented below. “Uniform ε (1)” denotes the original model with a uniform energy dissipation rate ε. “Uniform ε (2)” denotes the results of the same model but with modified parameter settings (more details are given below). Finally, “distributed ε” denotes a structurally modified model including a distribution of the energy dissipation rate ε.
Since the modifications mainly concerned the energy dissipation rate, their effects on the model is briefly discussed below (for a detailed mathematical description see ref. 32). The major influence concerned the different rates of mixing in the engulfment model (mesomixing, i.e., the fragmentation of unmixed fluid portions into smaller units, and micromixing, i.e., mixing down to the molecular scale). The higher the energy dissipation rate was, the faster the components mixed. In addition, an increased energy dissipation rate increases the turbulent collision kernel, i.e., the collision frequency of particles under turbulent conditions.
The resulting particle size distributions of all three model variations and the measured data are shown in Fig. 3 for all four investigated flow rates (2, 5, 9 and 16 ml min−1). To illustrate the various process dynamics, the time-dependent development of the dissolved component concentrations is shown in Fig. 4 for two model variations (uniform ε (2) and distributed ε) and for all investigated flow rates. For the purpose of comparison, the scaling of the time axis is identical in all four cases and thus the concentration evolutions are not completely shown for 2 ml min−1 (Fig. 4d). However, in this case the curves, which reach the final values after approximately 20 s, do not provide additional information for times over 3 s.
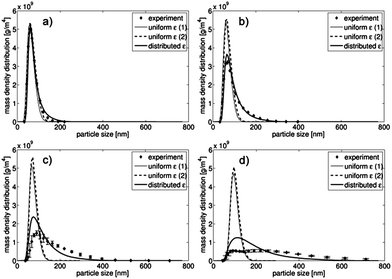 | ||
| Fig. 3 Resulting particle size distributions for three model variations compared with the measured data for 16 ml min−1 (a), 9 ml min−1 (b), 5 ml min−1 (c) and 2 ml min−1 (d). | ||
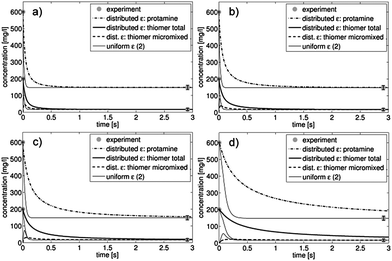 | ||
| Fig. 4 Time-dependent evolution of the dissolved component concentrations for the modified model “distributed ε” and the original model “uniform ε (2)” for the considered flow rates 16 ml min−1 (a), 9 ml min−1 (b), 5 ml min−1 (c) and 2 ml min−1 (d). | ||
The results of the original model “uniform ε (1)” (using mixing parameters corresponding to the conditions in the microreactor as shown in Table 3) indicated that the predicted excess concentrations of the dissolved components in the product failed to agree with the measured data. This must have occurred because of the different protamine:thiomer binding ratios (shown Table 1) for the batch case (1.24) and the continuous microreactor case (1.83) and the four material parameters of the model (charge numbers z1 and z2, equilibrium concentration c* and interfacial energy constant K) that were determined based on the batch case measurements. Hence, these parameters were changed for the microreactor simulations (see Table 4) and were termed “uniform ε (2)”. They matched the measured excess concentrations of the dissolved components as shown in Fig. 4 but they did not recover the significant increase in polydispersity with the decreasing flow rate observed in the measured data. According to the PBE simulations, agglomeration could be excluded as a major reason for the increased polydispersity at low flow rates because of the reduced values of the collision frequencies in the case of lower flow rates. Furthermore agglomeration was excluded to occur in the capillary for the following reasons: particle growth was predicted to be nearly complete after the T-junction of the reactor (see section 3.1 for details); consequently the concentrations of dissolved ions remained constant within the remaining length of the capillary. Constant ion concentrations mean constant electrostatic conditions, i.e., the electrostatic forces were constant along the capillary length and equal as in the product. Investigating the stability of the produced particles showed that their size remained constant for weeks (Fig. 2), i.e., repulsive forces dominated. Thus we concluded that agglomeration was prevented within the capillary.
| Flow rate [ml min−1] | 2 | 5 | 9 | 16 |
|---|---|---|---|---|
| Mean inlet velocity v [m s−1] | 0.4366 | 1.092 | 1.965 | 3.493 |
| Kinetic inlet power [W] | 3.178 × 10⁻⁶ | 4.965× 10⁻⁵ | 2.896× 10⁻⁴ | 1.627× 10⁻³ |
| Mean energy dissipation rate εmean [W kg−1] | 0.04006 | 0.6259 | 3.650 | 20.51 |
| Mean residence time τ [s] | 2.38 | 0.952 | 0.529 | 0.297 |
| Uniform ε (1) | Uniform ε (2) | Distributed ε | |
|---|---|---|---|
| Charge number of thiomer z1 [−] | 25.5 | 37.6 | 37.6 |
| Charge number of protamine z2 [−] | 21 | 21 | 21 |
| Equilibrium concentration c* [μmol l−1] | 5.93 | 12.08 | 12.08 |
| Interfacial energy constant K [−] | 0.193 | 0.153 | 0.153 |
In order to explain the increased polydispersity at low flow rates, the distributed energy dissipation rate was taken into account (i.e., the idea that different molecules may be exposed to different mixing conditions). It was assumed that molecules in the center of the collision region in the T-junction were exposed to higher energy dissipation rates than molecules transported through peripheral regions.33,34 Although the spatial distribution of the energy dissipation rate is different for every flow rate, comparable flow patterns in microreactors for a specific range of Reynolds numbers can be expected.33
Similar to the approach used by Schwarzer and Peukert, to account for the distributed energy dissipation rate, we considered parallel compartments with different energy dissipation rates, each of them identical to the original model.35 Due to the lack of general standards for the distribution of the energy dissipation rate around its average value, an arbitrary assumption had to be made. It was discovered that a log-normal distribution (parameters μ = 7, σ = 3.2571) of the energy dissipation rate ε relative to its average value εmean explained the experimentally observed trend of increased polydispersity at low flow rates. Thirteen logarithmically scaled, discrete values of ε were sufficient to obtain the results. The distribution that fulfils the condition
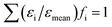 | (1) |
(where fi is the volume fraction of the compartment i with the energy dissipation rate εi) is shown in Fig. 5. Since the distribution of ε/εmean was considered, the latter was kept constant for all investigated flow rates, while the average energy dissipation rate εmean was different in each case and was calculated as kinetic power at the inlet divided by the mass content of the reactor (see Table 3).
 | ||
| Fig. 5 Assumed distribution of the energy dissipation rate ε relative to its average value εmean (log-normal distribution with μ = 7, σ = 3.2571, discretized in 13 values). | ||
2.2 Mass ratio
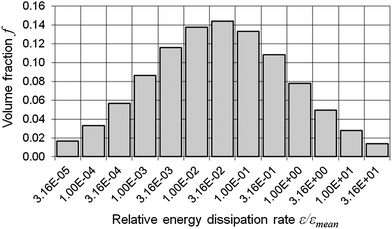
According to the above data, a flow rate of 16 ml min−1 resulted in the smallest nanoparticles and the lowest polydispersity. Therefore, it was chosen for all of the following experiments, during which the particle formation using three mass ratios of 5 kDa thiomer:protamine (namely 1:1, 1:3 and 1:5) was studied in detail and compared with the 1 ml-batch reaction again. Particles produced from the mass ratio of 1:1 via the batch reaction had aggregating properties that resulted in particle sizes far in excess of 1000 nm (Fig. 6a). Mean particle sizes of 131.5 ± 1.5 nm and 123.4 ± 5.4 nm were achieved using the mass ratios of 1:3 and 1:5, respectively, 24 hours after production. These nanoparticle suspensions remained stable for more than one month at 2–8 °C. In comparison, the particles produced using the mass ratio 1:1 in the microreactor aggregated into particles with mean diameters ranging approximately from 370 nm to 560 nm (Fig. 6b). However, even in this case stable nanoparticles <200 nm were formed from the mass ratios of 1:3 and 1:5 with the mean particle sizes of 96.1 ± 1.3 nm and 109.6 ± 1.3 nm, respectively, 24 hours after their formation. As for zeta potential, the 1 ml-batch reaction with all three mass ratios resulted in less pronounced mean values than the microreactor production (Table 5). In both cases, the mass ratio 1:1 had low zeta potentials of −1.0 ± 0.1 mV (batch reaction) and −9.2 ± 0.7 mV (microreactor) 24 hours after production, whereas for the other two mass ratios the values ranged between approximately +30 and +45 mV.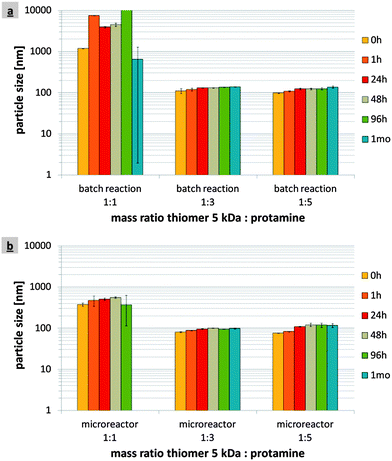 | ||
| Fig. 6 1 ml-batch reaction (a) versus the microreactor production at a flow rate of 16 ml min−1 (b): particle sizes of the nanoparticles produced from the 5 kDa thiomer:protamine mass ratios of 1:1, 1:3 and 1:5. | ||
:protamine mass ratios of 1:1, 1:3 and 1:5
| ZP [mV] | pH | |
|---|---|---|
| Batch reaction, 1 ml: | ||
| 1:1 | −1.0 ± 0.1 | 7.4 |
| 1:3 | +30.6 ± 3.0 | 9.2 |
| 1:5 | +36.9 ± 0.5 | 9.7 |
| Microreactor, 16 ml min−1: | ||
| 1:1 | −9.2 ± 0.7 | 6.7 |
| 1:3 | +42.0 ± 1.2 | 8.1 |
| 1:5 | +43.9 ± 1.3 | 8.3 |
2.3 Molecular weight
Increasing the molecular weight of the thiomer may impair mixing, resulting in unstable particles, and cause clogging of the microchannel and the mixing plates. Therefore, in addition to the 5 kDa thiomer, a thiomer that was six times larger with a molecular weight of 30 kDa was investigated. The applied solutions (200 μg ml−1) showed a viscosity of 1.05 ± 0.01 mPa s at 20 °C in both cases, 5 kDa thiomer and 30 kDa thiomer. As previously, a flow rate of 16 ml min−1 was applied and the results were compared with those for the 1 ml-batch reaction. The thiomer:protamine mass ratio of 1:3 was chosen for all of these experiments. According to the DLS results, with a 30 kDa thiomer the mean particle sizes were 102.9 ± 3.4 and 125.0 ± 5.2 nm 24 hours after the particle formation via the 1 ml-batch reaction and in the microreactor, respectively (Fig. 7). The particle sizes remained constant for over one month at 2–8 °C and were additionally confirmed by SEM images (data not shown). Concerning zeta potential, the nanoparticles produced with a 30 kDa thiomer via the 1 ml-batch reaction reached extraordinarily high values of +46.5 ± 0.6 mV 24 hours after production (Table 1). The nanoparticles produced in the microreactor had a lower mean zeta potential of +42.8 ± 0.9 mV 24 hours after production. However, with regard to binding efficiencies, more protamine was bound to these particles (175.5 ± 6.4 μg ml−1 protamine, 91.8 ± 1.4 μg ml−1 thiomer) compared with those produced via the 1 ml-batch reaction (143.5 ± 16.2 μg ml−1 protamine, 93.6 ± 0.3 μg ml−1 thiomer) (Table 1). Table 6 lists the polydispersity indexes of the 30 kDa thiomer nanoparticles produced via the 1 ml-batch reaction and in the microreactor, showing a decrease in the magnitude of the particle size distribution for the latter. | ||
| Fig. 7 1 ml-batch reaction versus microreactor production at a flow rate of 16 ml min−1: particle sizes of nanoparticles produced from the 30 kDa thiomer:protamine mass ratio of 1:3. | ||
:protamine mass ratio of 1:3
| Polydispersity index | 0 h | 24 h | >1 month |
|---|---|---|---|
| Batch reaction, 1 ml | 0.142 ± 0.018 | 0.154 ± 0.049 | 0.122 ± 0.010 |
| Microreactor, 16 ml min−1 | 0.086 ± 0.027 | 0.057 ± 0.012 | 0.060 ± 0.010 |
3 Discussion
3.1 Flow rate
The flow rate is one of the most crucial parameters for the production of nanoparticles in a passive microreactor. Depending on the flow rate, diffusion or advection predominates and hence the mixing effects vary. Vigorous mixing during the first few seconds of the electrostatic reaction is essential for the successful production of nanoparticles.26–28 The better the mixing effect, the more uniform is the concentration distribution, resulting in a higher number of nuclei, that later become more narrowly distributed and smaller nanoparticles.36,37 Higher flow rates were expected to result in a stronger mixing effect and thus in smaller particles with narrower particle size distribution, which was true in the case of nanoparticle productions at different flow rates (2, 5, 9 and 16 ml min−1) in the microreactor (5 kDa thiomer:protamine mass ratio of 1:3). Fig. 2 illustrates that a flow rate of 2 ml min−1 failed to have a sufficient mixing effect and that nanoparticles of sizes >200 nm developed. In contrast, flow rates of 5, 9 and 16 ml min−1 increased mixing sufficiently to achieve particle sizes <150 nm. A continuing reduction in size was observed as the flow rate increased. These results confirm the influence of the flow rate on the mixing effect and the resulting particle sizes of self-assembled nanoparticles. They are in good agreement with the findings of other research groups that reported a decrease in the particle size and polydispersity with an increase in the overall flow rate during the production of nanoparticles via antisolvent precipitation.12,17,38,39 In comparison with the 1 ml-batch reaction, the flow rate of 9 ml min−1 led to smaller particle sizes and lower polydispersity indexes directly after the production. Using a flow rate of 16 ml min−1 (Fig. 2 and Table 2) was not only beneficial in terms of scale-up but generally more efficient with regard to the self-assembly of nanoparticles. These results might be further enhanced applying even higher flow rates. On the other hand increased flow rates might worsen particle formation because of decreased residence times or cause pressure overload. To investigate effects of flow rates >16 ml min−1 a more powerful pumping system must be provided.SEM-images showed spherically shaped particles with sizes of 100–200 nm for both 1 ml-batch reaction and microreactor production methods. As for stability, nanosuspensions produced via 1 ml-batch reaction and in the microreactor retained their particle sizes for more than one month at 2–8 °C. The amount of particles in the samples was only slightly decreasing (data not shown), probably due to adsorption of the particles to the tubes in which they were stored. The stability of the nanosuspensions was additionally confirmed by zeta potential measurements showing values of >+30 mV (Table 1) in both, 1 ml-batch reaction and microreactor cases, which are generally considered stable systems without aggregation tendency due to the electrostatic repulsion between the particles.40 Compared with the zeta potential of nanoparticles synthesized via the 1 ml-batch reaction, the values for the microreactor production were approximately 10 mV higher due to the different binding efficiencies of the two components and pH-values of the nanosuspensions (Table 1). The amount of positively charged protamine bound to the nanoparticles produced in the microreactor was higher than that after the 1 ml-batch reaction. Accordingly, in the microreactor the amount of free protamine decreased and pH of the nanosuspension was lower. The isoelectric point of the nanoparticles was expected to be in the upper alkaline range. Therefore the lower pH caused more positive charges on the particle surfaces and higher zeta potentials in the case of microreactor production. The reason for the difference in the binding efficiencies of the components for 1 ml-batch reaction and the microreactor production was the stronger mixing effect in the microreactor.
The model results confirm the experimental observations and offer a detailed analysis of the underlying mechanisms. The measurement data and all model results in Fig. 3 clearly indicate that the average particle size increased with the decreasing flow rate. According to the literature, increased velocities of the product streams and, accordingly, increased Reynolds numbers in a microreactor are beneficial for the production of smaller nanoparticles.18,19,35,41 In the case of 16 ml min−1 (Fig. 3a), both the uniform ε (2) and the distributed ε models approximate the measurements well. The lower the flow rate was (Fig. 3b–d), the more the uniform ε (2) model differed from the distributed ε model and measurements. In summary, the distributed ε model and the measurements were in qualitative agreement for all considered flow rates and in quantitatively high agreement for the flow rates of 9 and 16 ml min−1. This confirms the assumed inhomogeneous mixing conditions for the distributed ε model and shows that inhomogeneous mixing dominated when the flow rates decreased. The reason for it may be the interaction between the subsequent process steps of mixing and nucleation. If mixing is significantly faster than nucleation, its effect is negligible and it can be considered separately from the nucleation. If the mixing rate is similar to or slower than the nucleation rate, both steps are coupled and mixing affects the resulting particle size distribution. At high flow rates, mixing was relatively fast for most of the considered values of the distributed energy dissipation rate ε, and thus, the resulting particle size distribution was similar to that for the uniform ε (2) model. At lower flow rates, the ε distribution moved to a lower average εmean, and more of or all of the compartments were influenced by mixing. Consequently, the distribution differed significantly from that for the uniform ε (2) model and gave an increased polydispersity, which was comparable with the measurement data in the considered cases. However, there was a significant quantitative discrepancy in the cases of 2 and 5 ml min−1. Specifically, for 5 ml min−1 the model's qualitative shape of the distribution was similar to that measured, and only a small displacement along the x-axis and a corresponding deviation in polydispersity were observed.
At 2 ml min−1, the measured particle size distribution was bimodal, which cannot be explained by the distributed ε model. Possibly, the flow field characteristics were significantly different from those for higher flow rates and the presumed distribution of the energy dissipation rate did not agree with reality in this case. This account is supported, for example, by Ying et al. and Bothe et al. who reported a drastic change in the mixing intensities and the related parameters when the flow rate exceeded a specific value.33,41 More detailed investigations are required to find a plausible explanation, e.g., a detailed flow field analysis by means of CFD.
The time-dependent concentrations of dissolved components (Fig. 4) show similar trends. In the case of the distributed ε model, the concentrations were calculated as the average over all 13 compartments. Evidently, concentration decrease is significantly retarded during the process for the distributed ε model in contrast to the uniform ε (2) model, resulting in a longer process duration caused by the ε distribution and a longer duration of mixing in compartments with low ε values. Analogous to the resulting particle size distributions, the difference between the uniform (2) and the distributed ε models becomes more pronounced at lower flow rates. Comparing the curves to the mean residence time in the T-junction (see Table 3) made it clear that the process was almost finished within the T-junction and a small concentration change happened in the beginning of the capillary.
3.2 Mass ratio
During the study of thiomer–protamine nanoparticle production in the 1 ml-batch reactor, a connection between the successful nanoparticle formation and the mass ratio of 5 kDa thiomer:protamine was found. The mass ratio 1:1 resulted in aggregating nanoparticles (Fig. 6a) with a zeta potential of nearly 0 mV (Table 5). In contrast, the 5 kDa thiomer:protamine mass ratios of 1:3 and 1:5 led to particle sizes of around 130 nm (Fig. 6a), showing suspension stability for more than one month at 2–8 °C, which can be explained by their higher zeta potential of >+30 mV (Table 5). The reproducibility of this mass-ratio-dependent effect was studied in the microreactor at a flow rate of 16 ml min−1. A mass ratio of 1:1 resulted in particle sizes of >400 nm (Fig. 6b), but aggregation was less distinct than that in the 1 ml-batch reaction as the zeta potential was about −10 mV (Table 5). Particle sizes of approximately 100–110 nm were obtained from the 5 kDa thiomer:protamine mass ratios of 1:3 and 1:5 (Fig. 6b) that were stable for more than one month at 2–8 °C. These nanoparticles were smaller and had higher zeta potentials (>+40 mV) than comparable samples produced via the 1 ml-batch reaction. According to the results in section 3.1, a higher zeta potential was caused by higher binding ratios of protamine:thiomer in the microreactor, causing lower pH-values measured within these nanosuspensions compared to those of the 1 ml-batch reaction (Table 5). The differences between 1 ml-batch reaction and the microreactor production were attributed to a better mixing effect at a flow rate of 16 ml min−1. These experiments confirmed that the microreactor produced the thiomer–protamine nanoparticles more efficiently than the 1 ml-batch reaction.3.3 Molecular weight
According to Leitner et al. thiomers of higher molecular weight increase mucoadhesion of thiomer–protamine nanoparticles.42 The chain length of thiomers used for the nanoparticles' production in the microreactor revealed yet another important parameter that can influence the particle formation. At higher molecular weight, two major problems may occur: less effective mixing due to higher viscosity of the thiomer solution, resulting in inappropriate particle sizes of >200 nm, and clogging of the microchannel and the porous mixing plates. According to the literature, due to the interior dimensions of ≤1 mm clogging is one of the major disadvantages of the microreaction technology.8,25 Various approaches for inhibiting reactor clogging and fouling have been proposed, such as changes in pH and hydrophobicity of the internal channel surface, periodic purging steps and performing the reaction in droplets travelling inside an immiscible carrier phase.16,43,44To determine the probability of clogging of the microreactor during the production of thiomer–protamine nanoparticles, a thiomer based on 30 kDa polyacrylic acid was used, which was six times larger than the 5 kDa thiomer employed in the previous experiments. In Fig. 7 the mean particle sizes of the 30 kDa thiomer–protamine nanoparticles produced via 1 ml-batch reaction and in the microreactor at a flow rate of 16 ml min−1 are compared. Regardless of the molecular weight of the thiomer, particle sizes of <200 nm that remained stable for more than one month at 2–8 °C were obtained. Furthermore, no clogging of the microchannel was observed as the operating pressure was constant during the entire production process. The blockage may have been avoided for two reasons. First, the production volumes were low as the amount of available educts was limited and therefore the operating time was rather short (about 15 min). A continuous long-time production would possibly result in clogging of the microchannel but, under the given circumstances, it could not be investigated. Secondly, Wiles and Watts postulated that microreactors were intolerant to particles that exceeded 10% of the smallest dimensions in the system.8 As the smallest diameter within the microreactor used in this study was 90 μm, particles below 9 μm did not cause the blockage. The nanoparticles produced with the 30 kDa thiomer in the microreactor had diameters with a mean value of 125.0 ± 5.2 nm, corresponding to only 1.4% of the smallest interior dimensions of the microreactor.
Since no significant differences in the viscosity of the thiomer solutions were measured (see sections 2.3 and 5.2), the mixing was not expected to be influenced by the increased molecular weight of the thiomer. Nevertheless, the nanoparticles produced in the microreactor at a flow rate of 16 ml min−1 were slightly larger than those obtained via the 1 ml-batch reaction with particle sizes of about 103 nm. It was assumed that due to (i) larger thiomer molecules, (ii) a higher cysteine coupling rate and (iii) a higher mixing effect in the microreactor, sterical conditions in combination with increased turbulences led to a minor increase of the particle size. SEM images revealed spherically shaped nanoparticles in the size range of <200 nm embedded in the matrix of D-mannitol that was used as a cryoprotectant during the freeze-drying of the samples. As mentioned above, the nanoparticles produced from the 30 kDa thiomer via a batch reaction and in the microreactor remained stable for several months, which was confirmed by the mean zeta potentials of >+40 mV in both cases (Table 1). Remarkably, the zeta potential of the particles produced via the 1 ml-batch reaction was rather high, exceeding that of the microreactor production despite lower binding efficiency of protamine and higher pH (Table 1).
It was concluded that thiomers with a molecular weight of approximately 30 kDa were still appropriate for the production of nanoparticles <200 nm in the microreactor. The mixing effect was sufficiently high and no significant clogging of the microchannel and the porous mixing plates was observed. Nevertheless, the risk of clogging or less effective mixing may be associated with thiomers of even higher molecular weight that are used for increasing mucoadhesion. Table 6 shows a lower polydispersity of the nanoparticles produced from the 30 kDa thiomer in the microreactor compared to that by the 1 ml-batch reaction, as previously observed for the nanoparticles synthesized from the 5 kDa thiomer in sections 2.1 and 3.1 (Table 2).
4 Conclusions
The results of our work were as follows:• A passive microreactor was successfully introduced as a scalable instrument for the production of self-assembled, biodegradable thiomer–protamine nanoparticles. It is the first instance of electrostatically self-assembled nanocarriers being produced via a continuous microreaction process.
• With the increasing flow rates, decreased particle sizes and size distributions were observed in the microreactor due to more effective mixing.
• 5 kDa thiomer: applying a flow rate of 16 ml min−1 resulted in improved particle characteristics compared to the 1 ml-batch reaction. Smaller and more narrowly distributed nanoparticles with higher zeta potentials were produced.
• 30 kDa thiomer: the microreactor production at a flow rate of 16 ml min−1 resulted in slightly larger mean particle sizes with lower zeta potential than those synthesized via the 1 ml-batch reaction. However, the particles were still <200 nm and had narrower particle size distributions compared to those synthesized via 1 ml-batch reaction.
• No clogging of the microchannel occurred during the nanoparticle production using 5 kDa and 30 kDa thiomers.
• The model predicts successfully the trend of obtaining smaller particles at higher flow rates. Introduction of a distributed energy dissipation rate improved the agreement of the model results with experiments, which was very good for high flow rates. The model also correctly predicted increased polydispersity with the decreasing flow rate and provided insights into the underlying phenomena.
Clearly, microreactors are an effective tool for producing self-assembled thiomer–protamine nanoparticles. The microreactor process improved particle characteristics in comparison to the 1 ml-batch reaction, at least for low molecular weight thiomers. At the moment a maximum of one liter particle suspension per hour can be produced. As the necessary amount of nanoparticles varies with the purpose of the product, the production limit can be extended by increase of the flow rate if an appropriate pumping system is available. Additionally, scale-up can be achieved easily by installing multiple microreactors in parallel – so called “numbering-up”.
5 Experimental
5.1 Materials
Thiomers are polymers that are combined with SH-bearing side chains, such as amino acid cysteine, to increase their mucoadhesive properties by forming disulfide bonds or via thiol exchange reactions with the mucus glycoproteins.45 For our study different types of thiomers (polyacrylic acid–cysteine) were provided by the Department of Pharmaceutical Technology/University of Innsbruck (Austria). One type was based on a polyacrylic acid sodium salt with a molecular weight of 5100 Da (5 kDa thiomer). Two batches of this thiomer were used, with cysteine coupling rates of 626 and 664 μmol SH-groups g−1 polymer. The second type of thiomer was synthesized from a polyacrylic acid sodium salt with a molecular weight of 30000 Da (30 kDa thiomer) with a cysteine coupling rate of 998 μmol SH-groups g−1 polymer.Protamine is a mixture of four arginine-rich polycationic peptides extracted from fish sperm. For our study protamine was purchased as a free base with a molecular weight of 4000–4400 Da from Sigma Aldrich (Steinheim, Germany). Protamine has extensively been used in pharmaceutical products, such as long-lasting insulin or heparin antidote.
Thiomer and protamine are both biodegradable substances of the opposite charge. Therefore, they are highly suitable for the preparation of electrostatically self-assembled nanoparticles intended to be used as pharmaceutical drug carriers. The structures of these two substances are shown in Fig. 8.
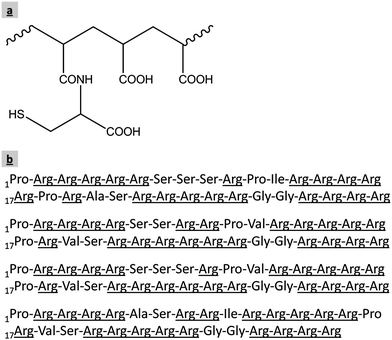 | ||
| Fig. 8 Structure of polyacrylic acid–cysteine (thiomer) (a) and the arginine-rich amino acid sequences of four major protamine components extracted from salmon sperm (b).45,46 | ||
To determine the binding efficiencies of the two components within the nanoparticles the reagents o-phthalaldehyde (OPA) and 4,4′-dithiodipyridine (4-DPS) and the reducing agent sodium borohydride obtained from Sigma Aldrich were used. In addition, D-mannitol purchased from Fluka (Buchs, Switzerland) was utilized as a cryoprotectant during lyophilisation of the SEM-samples.
5.2 Nanoparticle production
The two educts were dissolved in Milli-Q® water at concentrations of 200 μg ml−1 thiomer and 200, 600 and 1000 μg ml−1 protamine, corresponding to the thiomer:protamine mass ratios of 1:1, 1:3 and 1:5. Solutions of 5 kDa thiomer and of 30 kDa thiomer, respectively, showed a viscosity of 1.05 ± 0.01 mPa s at 20 °C, while those of protamine in different concentrations (200, 600 and 1000 μg ml−1) were 1.14 ± 0.01, 1.15 ± 0.01 and 1.15 ± 0.00 mPa s at 23 °C.5.3 1 ml-batch reaction
For the 1 ml-batch reaction equal volumes of thiomer and protamine solutions were mixed in 1.5 ml tubes (Eppendorf, Hamburg, Germany), 5 times with a pipette (Eppendorf) and for 5 s with a Vortex-Genie 2 (Scientific Industries, New York, USA). This method was described in previous studies of this working group.26,285.4 Microreactor production
A passive microreactor for scale-up experiments of this work was provided by One-A Engineering (Vöcklabruck, Austria). It was made of stainless steel and had outer dimensions of approximately 1 × 0.4 m. Its inner dimensions were calculated so that the educts were mixed for approximately 25 s at a flow rate of 1 l h−1. Fluid streams were driven by HPLC pumps (L-6200 Intelligent Pump, Merck-Hitachi, Darmstadt, Germany) via two inlets through the microreactor. Maximum speed for each of these pumps was 10 ml min−1. The educts came in contact with a T-junction where each of the fluid streams split into six thinner fluid streams with a porous mixing plate (pores: Ø 90 μm). These fluid streams collided head-on and subsequently entered a 10 m long microchannel consisting of five consecutive hair-pin tubes (Ø 1 mm). The mixing effect within the microchannel was achieved via well-defined obstructions on the wall of the microchannel and porous mixing plates (pores: Ø 100 μm) at the beginning of each hair-pin tube. Fig. 1 shows a schematic of the microreactor and the microchannel. For the experiments, flow rates of 1, 2.5, 4.5 and 8 ml min−1 were applied to each educt resulting in the overall flow rates of 2, 5, 9 and 16 ml min−1. The production took place at ambient temperature. For future experiments that may involve, for example, incorporating drug molecules, an additional inlet for a third educt and connections to a water bath to control the production temperature can be installed.5.5 Particle size and zeta potential
Particle size and zeta potential measurements were performed by a Zetasizer Nano ZS (Malvern Instruments, Malvern, UK) equipped with a 532 nm “green” laser. This instrument applies the principle of Dynamic Light Scattering (DLS) to determine particle sizes at a measurement angle of 173° and Laser Doppler Velocimetry (LDV) for zeta potential measurements.47,48 All samples were collected at least in triplicate and measured without further dilution. The measurement temperature was set to 25 °C. In addition to zeta potentials, pH values of the samples were determined but not adjusted.5.6 Scanning Electron Microscopy (SEM)
Nanoparticle suspensions were freeze-dried with 5% (m/v) D-mannitol as a cryoprotectant for 48 h using a Lyovac GT2 (Steris Corporation, Mentor, USA). All samples were sputtered with chromium before being analyzed with an Ultra 55 (Zeiss, Oberkochen, Germany) at the Institute for Electron Microscopy/Graz University of Technology (Austria).5.7 Binding efficiencies
ortho-Phthalaldehyde (OPA) is widely used for the fluorimetric determination of primary amino groups in the presence of a strong reducing agent, such as N-acetyl-L-cysteine (NAC). The method for quantifying protamine in microtiter plates using an OPA/NAC reagent described by Lochmann et al. was modified for this study to indirectly analyze the binding efficiency of protamine from the supernatants of the centrifuged nanosuspensions (14000 rpm, 4 h, 4 °C) using a mixture of OPA–NAC with a molar ratio of 1:3.49,50 In the case of OPA, a 75 mM solution in methanol was prepared, whereas NAC was dissolved in a borate buffer (0.1 M, pH 9.4) at a concentration of 450 mM. These solutions were mixed in a volume ratio of 2:1 (OPA/NAC) and stored at 2–8 °C for two hours. The supernatants of the samples were united with the OPA/NAC reagent in equal volumes and analyzed with a Fluostar Galaxy (BMG Labtechnologies, Ortenberg, Germany) 7 minutes after mixing (λex = 355 nm, λem = 460 nm) using Lumitrac 200 96-well plates (Greiner Bio One, Kremsmünster, Austria).As in the case of protamine, the binding efficiency of the thiomer was indirectly quantified from the supernatants of the centrifuged nanoparticle suspensions (14000 rpm, 4 h, 4 °C) using 4,4′-dithiodipyridine (4-DPS) that forms a photometrically detectable 4-thiopyridone with SH-bearing substances. Using the method of Hansen et al., the supernatants were reduced with sodium borohydride prior to reacting with 4-DPS.51 The absorbance of the samples was measured with a DU-70 spectrophotometer (Beckman Instruments, Fullerton, USA) at a wavelength of 324 nm approximately 15 minutes after the reaction.
All the samples used for the determination of the binding efficiencies were collected at least in triplicate.
5.8 Rheology
The viscosity of the educt solutions was determined by a Physica MCR 301 rheometer (Anton Paar, Graz, Austria) equipped with a cone-and-plate system (CP 50-1) for thiomer solutions and a double-gap cylinder system (DG 26.7/TI) for protamine solutions. The temperature was set to 20 and 23 °C, respectively. Following settings were chosen for all of the solutions: 25 measuring points, linear decrease of duration of measuring points (10 s–2 s), linear increase of shear rate (10 s−1–1000 s−1).Acknowledgements
This work was part of a joint research project Nano Health funded by the Austrian Nano Initiative (FWF/FFG N203-NAN) and additionally supported by Innovatives Oberösterreich 2010/GC (Wi-355205/1-2011-Ho/Ti).References
- N. A. Ochekpe, P. O. Olorunfemi and N. C. Ngwuluka, Trop. J. Pharm. Res., 2009, 8, 265–274 CAS.
- B. Mishra, B. B. Patel and S. Tiwari, Nanomed.: Nanotechnol., Biol. Med., 2010, 6, 9–24 CrossRef CAS.
- M. Rawat, D. Singh and S. Saraf, Biol. Pharm. Bull., 2006, 29, 1790–1798 CAS.
- J. Kreuter, Colloidal Drug Delivery Systems, Marcel Dekker, New York, 1994 Search PubMed.
- S. A. Galindo-Rodríguez, F. Puel, S. Briancon, E. Allémann, E. Doelker and H. Fessi, Eur. J. Pharm. Sci., 2005, 25, 357–367 CrossRef.
- R. H. Müller, C. Jacobs and O. Kayser, Adv. Drug Delivery Rev., 2001, 47, 3–19 CrossRef.
- J. Hu, W. K. Ng, Y. Dong, S. Shen and R. B. H. Tan, Int. J. Pharm., 2011, 404, 198–204 CrossRef CAS.
- C. Wiles and P. Watts, Chem. Commun., 2011, 47, 6512–6535 RSC.
- C. J. Campbell and B. A. Grzybowski, Philos. Trans. R. Soc. London, Ser. A, 2004, 362, 1069–1086 CrossRef.
- V. Hessel, H. Löwe and F. Schönfeld, Chem. Eng. Sci., 2005, 60, 2479–2501 CrossRef CAS.
- C. H. Chang, B. K. Paul, V. T. Remcho, S. Atre and J. E. Hutchison, J. Nanopart. Res., 2008, 10, 965–980 CrossRef CAS.
- H. S. M. Ali, P. York and N. Blagden, Int. J. Pharm., 2009, 375, 107–113 CrossRef CAS.
- J. Boleininger, A. Kurz, V. Reuss and C. Sönnichsen, Phys. Chem. Chem. Phys., 2006, 8, 3824–3827 RSC.
- L. Frenz, A. El Harrak, M. Pauly, S. Bégin-Colin, A. D. Griffiths and J. C. Baret, Angew. Chem., Int. Ed., 2008, 47, 6817–6820 CrossRef CAS.
- D. V. R. Kumar, M. Kasture, A. A. Prabhune, C. V. Ramana, B. L. V. Prasad and A. A. Kulkarni, Green Chem., 2010, 12, 609–615 RSC.
- J. Wagner and J. M. Köhler, Nano Lett., 2005, 5, 685–691 CrossRef CAS.
- Q. X. Zhang, L. M. Xu, Y. Zhou, J. X. Wang and J. F. Chen, Ind. Eng. Chem. Res., 2011, 50, 13805–13812 CrossRef CAS.
- C.-X. Zhao, L. He, S. Z. Qiao and A. P. J. Middelberg, Chem. Eng. Sci., 2011, 66, 1463–1479 CrossRef CAS.
- R. Karnik, F. Gu, P. Basto, C. Cannizzaro, L. Dean, W. Kyei-Manu, R. Langer and O. C. Farokhzad, Nano Lett., 2008, 8, 2906–2912 CrossRef CAS.
- E. Rondeau and J. J. Cooper-White, Langmuir, 2008, 24, 6937–6945 CrossRef CAS.
- J. Yun, S. Zhang, S. Shen, Z. Chen, K. Yao and J. Chen, Chem. Eng. Sci., 2009, 64, 4115–4122 CrossRef CAS.
- S.-h. Zhang, S.-c. Shen, Z. Chen, J.-x. Yun, K.-j. Yao, B.-b. Chen and J.-z. Chen, Chem. Eng. J., 2008, 144, 324–328 CrossRef CAS.
- S. Zhang, J. Yun, S. Shen, Z. Chen, K. Yao, J. Chen and B. Chen, Chem. Eng. Sci., 2008, 63, 5600–5605 CrossRef CAS.
- K. S. Soppimath, T. M. Aminabhavi, A. R. Kulkarni and W. E. Rudzinski, J. Controlled Release, 2001, 70, 1–20 CrossRef CAS.
- Y. Song, J. Hormes and C. S. S. R. Kumar, Small, 2008, 4, 698–711 CrossRef CAS.
- D. Lochmann, J. Weyermann, C. Georgens, R. Prassl and A. Zimmer, Eur. J. Pharm. Biopharm., 2005, 59, 419–429 CrossRef CAS.
- V. Vogel, D. Lochmann, J. Weyermann, G. Mayer, C. Tziatzios, J. A. Van Den Broek, W. Haase, D. Wouters, U. S. Schubert, J. Kreuter, A. Zimmer and D. Schubert, J. Controlled Release, 2005, 103, 99–111 CrossRef CAS.
- K. Wernig, M. Griesbacher, F. Andreae, F. Hajos, J. Wagner, W. Mosgoeller and A. Zimmer, J. Controlled Release, 2008, 130, 192–198 CrossRef CAS.
- S. K. Lai, Y. Y. Wang and J. Hanes, Adv. Drug Delivery Rev., 2009, 61, 158–171 CrossRef CAS.
- S. Zikeli, F. Ecker, M. Longin and K. Weidinger, One-A Engineering Austria GmbH, Aurotec GmbH, WO2010055034 (A1), 2010 Search PubMed.
- R. B. Gupta and U. B. Kompella, Nanoparticle Technology for Drug Delivery, Taylor & Francis Group, New York, 2006 Search PubMed.
- A. Eitzlmayr, C. Petschacher, S. Radl, D. Suzzi, A. Zimmer and J. G. Khinast, Soft Matter, 2011, 7, 9484–9497 RSC.
- D. Bothe, C. Stemich and H. J. Warnecke, Chem. Eng. Sci., 2006, 61, 2950–2958 CrossRef CAS.
- E. Gavi, D. L. Marchisio and A. A. Barresi, Chem. Eng. Sci., 2007, 62, 2228–2241 CrossRef CAS.
- H. C. Schwarzer and W. Peukert, AIChE J., 2004, 50, 3234–3247 CrossRef CAS.
- J. DeMello and A. DeMello, Lab Chip, 2004, 4, 11N–15N RSC.
- V. K. Lamer and R. H. Dinegar, J. Am. Chem. Soc., 1950, 72, 4847–4854 CrossRef CAS.
- J. X. Wang, Q. X. Zhang, Y. Zhou, L. Shao and J. F. Chen, Chem. Eng. J., 2010, 162, 844–851 CrossRef CAS.
- H. X. Zhang, J. X. Wang, L. Shao and J. F. Chen, Ind. Eng. Chem. Res., 2010, 49, 4156–4161 CrossRef CAS.
- R. H. Müller, Zetapotential und Partikelladung in der Laborpraxis, Wissenschaftliche Verlagsgesellschaft mbH Stuttgart, Stuttgart, 1996 Search PubMed.
- Y. Ying, G. Chen, Y. Zhao, S. Li and Q. Yuan, Chem. Eng. J., 2008, 135, 209–215 CrossRef CAS.
- V. M. Leitner, M. K. Marschütz and A. Bernkop-Schnürch, Eur. J. Pharm. Sci., 2003, 18, 89–96 CrossRef CAS.
- S. L. Poe, M. A. Cummings, M. P. Haaf and D. T. Mc Quade, Angew. Chem., Int. Ed., 2006, 45, 1544–1548 CrossRef CAS.
- A. M. Thayer, Chem. Eng. News, 2005, 83, 43–52 Search PubMed.
- A. Bernkop-Schnürch, Adv. Drug Delivery Rev., 2005, 57, 1569–1582 CrossRef.
- J. A. Hoffmann, R. E. Chance and M. G. Johnson, Protein Expression Purif., 1990, 1, 127–133 CrossRef CAS.
- Malvern Instruments, Dynamic Light Scattering: An Introduction in 30 Minutes, in http://www.malvern.de/malvern/kbase.nsf/allbyno/KB000792/$file/MRK656–01_An_Introduction_to_DLS.pdf, last access: 09 January 2013.
- Malvern Instruments, Zeta Potential: An Introduction in 30 Minutes, in http://www.malvern.de/malvern/kbase.nsf/allbyno/KB000734/$file/MRK654–01%20An%20Introduction%20to%20Zeta%20Potential%20v3.pdf, last access: 09 January 2013.
- D. Lochmann, S. Stadlhofer, J. Weyermann and A. Zimmer, Int. J. Pharm., 2004, 283, 11–17 CrossRef CAS.
- I. Molnár-Perl and A. Vasanits, J. Chromatogr., A, 1999, 835, 73–91 CrossRef.
- R. E. Hansen, H. Østergaard, P. Nørgaard and J. R. Winther, Anal. Biochem., 2007, 363, 77–82 CrossRef CAS.
| This journal is © The Royal Society of Chemistry 2013 |