 Open Access Article
Creative Commons Attribution 3.0 Unported Licence
A highly selective chemodosimeter for fast detection and intracellular imaging of Hg2+ ions based on a dithiocarbamate–isothiocyanate conversion in aqueous ethanol†
Suman
Pal
,
Joydev
Hatai
,
Mousumi
Samanta
,
Alok
Shaurya
and
Subhajit
Bandyopadhyay
*
Indian Institute of Science Education and Research (IISER) Kolkata, Main Campus PO, Mohanpur, Nadia, WB 741252, India. E-mail: sb1@iiserkol.ac.in
First published on 28th November 2013
Abstract
A new naphthalene diimide–dithiocarbamate based fluorescence probe was synthesized and its fluorogenic behavior towards various metal ions was studied. Upon addition of various metal ions, the probe afforded an irreversible change only with Hg2+ ions in aqueous-ethanol media (4![[thin space (1/6-em)]](https://www.rsc.org/images/entities/char_2009.gif) :
:![[thin space (1/6-em)]](https://www.rsc.org/images/entities/char_2009.gif) 1 v/v) with a fourfold enhancement of the fluorescence (Φ = 0.03 → 0.11) along with a distinct 43 nm blue shift of the emission maxima. The mechanism of the chemodosimetric behavior of the probe has been attributed to a Hg2+ induced transformation of a weakly fluorescent dithiocarbamate to a highly fluorescent isothiocyanate which has been characterized by a number of spectroscopic techniques and a crystal structure. Intracellular detection of Hg2+ ions was achieved using the probe.
1 v/v) with a fourfold enhancement of the fluorescence (Φ = 0.03 → 0.11) along with a distinct 43 nm blue shift of the emission maxima. The mechanism of the chemodosimetric behavior of the probe has been attributed to a Hg2+ induced transformation of a weakly fluorescent dithiocarbamate to a highly fluorescent isothiocyanate which has been characterized by a number of spectroscopic techniques and a crystal structure. Intracellular detection of Hg2+ ions was achieved using the probe.
Introduction
The development of selective chemosensors for the detection of toxic heavy-metal ions draws particular interest because of the wide use of these metal ions and their important impact on the environment.1 Among them, mercury is one of the most prevalent toxic pollutants in the environment because it is widely distributed in water and soil2 and subsequently bioaccumulates in mammals through the food chain.3 Both the elemental form and the salt are converted to highly potent neurotoxin methyl mercury by certain anaerobic bacteria. Besides, even a very low concentration of mercury ions causes a variety of diseases and affects the central nervous system which is reflected in symptoms such as tremors, vision problems, headache, hearing and memory impairments.4 Despite its toxicity, mercury and its salts are still extensively used in industrial processes.5Analytical techniques such as atomic absorption spectrometry (AAS), inductively coupled plasma-mass spectrometry (ICPMS), inductively coupled plasma-atomic emission spectrophotometry (ICP-AES) and highly sensitive electrochemical techniques such as ion-selective potentiometry offer unparalleled sensitivity.6,7 However, they bear several disadvantages such as high instrument cost, a complicated procedure for sample preparation, and different modes for different charged states of an element. Therefore, detection of low concentrations of Hg2+ with simple spectrometric techniques is crucial. Lippard1b and later, Kim8 have reviewed optical sensors for mercury ions. Among the various spectroscopic methods, use of fluorescent techniques for the detection of Hg2+ ions offers numerous advantages in terms of high sensitivity, selectivity, rapid response time, low cost and simple operation procedure.9 Most small-molecule based fluorescent detection relies on changes in the signal resulting from metal–ligand binding events.
In contrast, the chemodosimeter approach involves an irreversible chemical transformation between the dosimeter molecule and a specific analyte which is reflected in a cumulative response that is proportional to the concentration of the analyte.10 This approach has become an important strategy for fluorescence detection of metal ions owing to its high selectivity and sensitivity.11 Recently Li and coworkers have written a comprehensive review on chemodosimeters for Hg2+ ions.12 There are reports of development of chemodosimeters that are based on Hg2+-promoted desulfurization reactions, including cyclizations,13 hydrolysis,14 eliminations,15 decomposition,16 ring opening of spiro systems17 and conversion of thiocarbonyl compounds to their carbonyl analogues.18 However, often long reaction times and elevated temperatures are required for the desulfurization processes. Besides, in certain cases, less thiophilic metal ions such as Ag+ and Pb2+ can also mediate desulfurization.14f
Recently, we have reported several dithiocarbamate-based fluorescent receptors for the detection and imaging of various heavy metal ions.19 Here, we report a compound 1 bearing collidine units (i.e., 2,4,6-trimethylpyridine) attached via dithiocarbamate linkers with two ethylene diamine spacers at the two ends of a naphthalene diimide (NDI) fluorophore for the detection of Hg2+. NDI based systems possess a large extinction coefficient in the visible range of absorption, high fluorescence quantum yield, and long absorption and emission wavelengths.20 Compound 1 in response to Hg2+ ions shows a 43 nm blue shift in the emission maxima and a fourfold enhancement of fluorescence (quantum yield, Φ 0.03 → 0.11). We have investigated the mechanism of the enhancement of fluorescence by carefully following the events after the addition of Hg2+ ions to compound 1 and attributed it to a unique Hg2+ promoted reaction of isothiocyanate formation from the dithiocarbamate unit (Fig. 1). To the best of our knowledge, this is the first example of a chemodosimeter that exploits the formation of an isothiocyanate from a thiocarbamate. The molecule was also used for bioimaging of Hg2+ ions in cells.
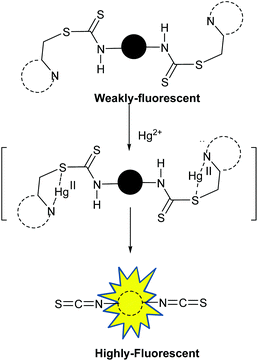 | ||
| Fig. 1 Working principle of chemodosimeter 1: Hg2+ induced transformation of a weakly emissive dithiocarbamate to a highly fluorescent isothiocyanate. | ||
Experimental section
Synthesis
Compounds 2 and 3 were prepared following reported methods.20aCompound 4
NBS (1.76 g, 9.86 mmol) and AIBN (0.05 g) were added to 2,4,6-trimethylpyridine (1.0 g, 8.21 mmol) in carbon tetrachloride (100 mL) under a N2 atmosphere. The reaction mixture was stirred for 8 h at 85 °C and cooled to room temperature. The reaction mixture was concentrated under reduced pressure, which on chromatography (hexane–ethyl acetate, 98![[thin space (1/6-em)]](https://www.rsc.org/images/entities/char_2009.gif) :
:![[thin space (1/6-em)]](https://www.rsc.org/images/entities/char_2009.gif) 2, v/v) yielded compound 4 (0.68 g, 40%) as a white oily liquid.211H NMR (400 MHz, CDCl3) δ: 7.07 (s, 1H, ArH), 6.89 (s, 1H, ArH), 4.38 (s, 2H, CH2), 2.50 (s, 3H, CH3), 2.30 (s, 3H, CH3). 13C NMR (100 MHz, CDCl3, ppm) δ: 156.9, 154.6, 147.1, 122.4, 120.2, 32.9, 22.9, 19.5. ESI-MS m/z calc. [C8H10BrNH]+, 200.0, found 200.1.
2, v/v) yielded compound 4 (0.68 g, 40%) as a white oily liquid.211H NMR (400 MHz, CDCl3) δ: 7.07 (s, 1H, ArH), 6.89 (s, 1H, ArH), 4.38 (s, 2H, CH2), 2.50 (s, 3H, CH3), 2.30 (s, 3H, CH3). 13C NMR (100 MHz, CDCl3, ppm) δ: 156.9, 154.6, 147.1, 122.4, 120.2, 32.9, 22.9, 19.5. ESI-MS m/z calc. [C8H10BrNH]+, 200.0, found 200.1.
Compound 1
Compound 3 (0.20 g, 0.346 mmol), potassium carbonate (0.19 g, 1.38 mmol) and carbon disulfide (1.2 mL, 18.0 mmol) in dioxane–water (4![[thin space (1/6-em)]](https://www.rsc.org/images/entities/char_2009.gif) :
:![[thin space (1/6-em)]](https://www.rsc.org/images/entities/char_2009.gif) 1, v/v, 10 mL) was stirred at room temperature for 1 h. Compound 4 (0.15 g, 0.75 mmol) in dioxane (4 mL) was added dropwise over a period of 10 minutes to the mixture and the stirring was continued for another 1 h at 25 °C. The yellowish solid thus obtained was dissolved in dichloromethane (20 mL) and washed with water. The organic layer was dried over anhydrous Na2SO4 and the volatiles were removed under reduced pressure. The residue on chromatography (hexane–ethylacetate, 1
1, v/v, 10 mL) was stirred at room temperature for 1 h. Compound 4 (0.15 g, 0.75 mmol) in dioxane (4 mL) was added dropwise over a period of 10 minutes to the mixture and the stirring was continued for another 1 h at 25 °C. The yellowish solid thus obtained was dissolved in dichloromethane (20 mL) and washed with water. The organic layer was dried over anhydrous Na2SO4 and the volatiles were removed under reduced pressure. The residue on chromatography (hexane–ethylacetate, 1![[thin space (1/6-em)]](https://www.rsc.org/images/entities/char_2009.gif) :
:![[thin space (1/6-em)]](https://www.rsc.org/images/entities/char_2009.gif) 1, v/v) yielded compound 1 (0.07 g, 40%) as a yellow solid, mp 173–175 °C. 1H NMR (400 MHz, CDCl3) δ: 11.92 (s, 2H, NH), 8.69 (s, 4H, ArH), 6.86 (2H, ArH), 6.85 (2H, ArH), 4.60 (t, 4H, J = 4.3 Hz, N-CH2), 4.27 (q, 4H, J = 4.5 Hz, CH2NH), 4.12 (s, 4H, ArCH2), 2.41 (s, 6H, CH3), 2.28 (s, 6H, CH3). 13C NMR (125 MHz, CDCl3) δ: 197.4, 163.1, 157.1, 156.8, 149.8, 130.9, 126.8, 126.6, 123.3, 121.1, 44.2, 41.22, 39.72, 23.95, 20.97. UV-vis (CHCl3) λnm (ε, M−1 cm−1): 358 (40
1, v/v) yielded compound 1 (0.07 g, 40%) as a yellow solid, mp 173–175 °C. 1H NMR (400 MHz, CDCl3) δ: 11.92 (s, 2H, NH), 8.69 (s, 4H, ArH), 6.86 (2H, ArH), 6.85 (2H, ArH), 4.60 (t, 4H, J = 4.3 Hz, N-CH2), 4.27 (q, 4H, J = 4.5 Hz, CH2NH), 4.12 (s, 4H, ArCH2), 2.41 (s, 6H, CH3), 2.28 (s, 6H, CH3). 13C NMR (125 MHz, CDCl3) δ: 197.4, 163.1, 157.1, 156.8, 149.8, 130.9, 126.8, 126.6, 123.3, 121.1, 44.2, 41.22, 39.72, 23.95, 20.97. UV-vis (CHCl3) λnm (ε, M−1 cm−1): 358 (40![[thin space (1/6-em)]](https://www.rsc.org/images/entities/char_2009.gif) 400), 378 (41
400), 378 (41![[thin space (1/6-em)]](https://www.rsc.org/images/entities/char_2009.gif) 400); FT-IR (EtOH, ν/cm−1): 3307, 2943, 2230, 2044, 1726, 1674, 1448, 1420, 1115. ESI-MS calc. for C36H34N6O4S4H+, 743.16, found 743.16.
400); FT-IR (EtOH, ν/cm−1): 3307, 2943, 2230, 2044, 1726, 1674, 1448, 1420, 1115. ESI-MS calc. for C36H34N6O4S4H+, 743.16, found 743.16.
Isothiocianate 5
1H NMR (400 MHz, CDCl3, ppm) δ: 8.83 (s, 4H), 4.56 (t, J = 6.12 Hz, 4H), 3.95 (t, J = 6.08 Hz, 4H). 13C NMR (100 MHz, CDCl3, ppm) δ: 162.7, 131.5, 126.9, 126.4, 42.9, 39.5. Also see Table 1.| 1 | |
|---|---|
| Empirical formula | C20H12N4O4S2 |
| F.w. | 436.48 |
| Space group | Monoclinic, P21/c |
| a (Å) | 8.987(2) |
| b (Å) | 13.788(3) |
| c (Å) | 15.365(4) |
| β (°) | 103.787(5) |
| V (Å3) | 1849.1(7) |
| Z | 4 |
| λ (Å) | 0.71073 |
| Crystal size (mm3) | 0.34 × 0.18 × 0.11 |
| T (K) | 100 |
| μ (mm−1) | 0.327 |
| R[F2 > 2σ(F2)] | 0.0439 |
| wR(F2) | 0.0989 |
| GOF | 1.035 |
| W | 1/[σ2(Fo2) + (0.0464P)2 + 1.1540P] where P = (Fo2 + 2Fc2)/3 |
Crystallographic details (CCDC number 958704)
Compound 5: Single crystals were obtained from the reaction of chemodosimeter 1 with Hg2+ followed by purification using preparative TLC and subsequent recrystallization from EtOH–CHCl3 (1![[thin space (1/6-em)]](https://www.rsc.org/images/entities/char_2009.gif) :
:![[thin space (1/6-em)]](https://www.rsc.org/images/entities/char_2009.gif) 1). The unit cell dimensions were determined by a least squares fit of 1141 machine centered reflections (0° < θ < 20°) for chemodosimeter 1. Thirty six standard reflections were used to check the crystal stability toward X-ray exposure, which showed no significant intensity reduction over the course of data collection. Six final cycles of refinement converged with discrepancy indices R[F2 > 2σ(F2)] = 0.0439 and wR(F2) = 0.0989 for the chemodosimeter 1.
1). The unit cell dimensions were determined by a least squares fit of 1141 machine centered reflections (0° < θ < 20°) for chemodosimeter 1. Thirty six standard reflections were used to check the crystal stability toward X-ray exposure, which showed no significant intensity reduction over the course of data collection. Six final cycles of refinement converged with discrepancy indices R[F2 > 2σ(F2)] = 0.0439 and wR(F2) = 0.0989 for the chemodosimeter 1.
Procedure for metal ion sensing
![[thin space (1/6-em)]](https://www.rsc.org/images/entities/char_2009.gif) :
:![[thin space (1/6-em)]](https://www.rsc.org/images/entities/char_2009.gif) 1, v/v, with 1% DMSO as a cosolvent, 1 mM HEPES buffered at pH 7.0) at 25 °C.
1, v/v, with 1% DMSO as a cosolvent, 1 mM HEPES buffered at pH 7.0) at 25 °C.
![[thin space (1/6-em)]](https://www.rsc.org/images/entities/char_2009.gif) :
:![[thin space (1/6-em)]](https://www.rsc.org/images/entities/char_2009.gif) 1, v/v, with 1% DMSO as a cosolvent, 1 mM HEPES buffered at pH 7.0) at 25 °C. The excitation wavelength was 350 nm and all excitation and emission slit widths were set at 5 nm unless otherwise indicated. The relative quantum yield of 1 was determined using quinine sulphate as a standard.
1, v/v, with 1% DMSO as a cosolvent, 1 mM HEPES buffered at pH 7.0) at 25 °C. The excitation wavelength was 350 nm and all excitation and emission slit widths were set at 5 nm unless otherwise indicated. The relative quantum yield of 1 was determined using quinine sulphate as a standard.
Results and discussion
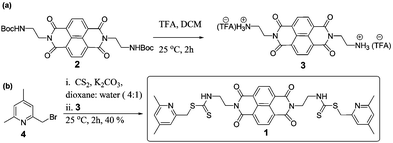
The synthetic route for the chemodosimeter 1 is shown in Scheme 1. The ethylenediamine linked NDI intermediate 2 was synthesized based on a reported method by Licchelli.20a Deprotection of the Boc group followed by treatment with carbon disulfide and subsequently with the bromomethyl compound 4 in dioxane–water afforded compound 1 in 40% yield (Scheme 1).To investigate the affinity of 1 (10 μM) for metal ions, UV-vis and fluorescence experiments were initially carried out using a variety of cations: Cr3+, Mn2+, Fe2+, Co2+, Ba2+, Ni2+, Cu2+, Zn2+, Pb2+, Ag+, Ca2+, Cd2+, K+, Na+, Li+, and Al3+ in mixed solvent media (H2O–EtOH, 4![[thin space (1/6-em)]](https://www.rsc.org/images/entities/char_2009.gif) :
:![[thin space (1/6-em)]](https://www.rsc.org/images/entities/char_2009.gif) 1, v/v, with 1% DMSO as a cosolvent in 1 mM HEPES buffered at pH 7.0 at 25 °C). In the absence of any metal ions, compound 1 (10 μM) displayed an absorption band centered at 358 and 378 nm. Of the sixteen metal ions mentioned above, significant spectral change was observed only with Hg2+ ions (Fig. S1, ESI†). The intensity of both the bands gradually increased upon addition up to 20 μM of Hg2+ (Fig. S2, ESI†). The resultant solution was brightly luminescent under UV light (inset in Fig. 2A).
1, v/v, with 1% DMSO as a cosolvent in 1 mM HEPES buffered at pH 7.0 at 25 °C). In the absence of any metal ions, compound 1 (10 μM) displayed an absorption band centered at 358 and 378 nm. Of the sixteen metal ions mentioned above, significant spectral change was observed only with Hg2+ ions (Fig. S1, ESI†). The intensity of both the bands gradually increased upon addition up to 20 μM of Hg2+ (Fig. S2, ESI†). The resultant solution was brightly luminescent under UV light (inset in Fig. 2A).
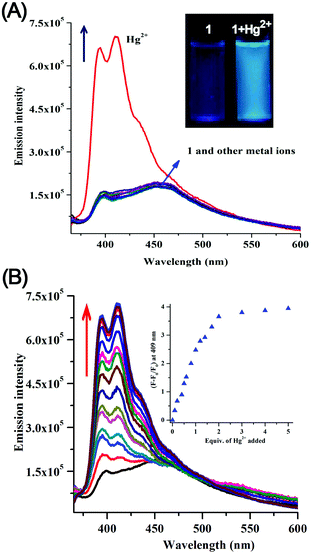
The fluorescence spectra of dosimeter 1 (10 μM) upon excitation of the naphthalene diimide fluorophore (λex = 350 nm, excitation and emission slit widths = 5 nm) displayed a weak emission band (quantum yield, Φ = 0.03) at 452 nm in mixed aqueous–organic solvent media (H2O–EtOH, 4![[thin space (1/6-em)]](https://www.rsc.org/images/entities/char_2009.gif) :
:![[thin space (1/6-em)]](https://www.rsc.org/images/entities/char_2009.gif) 1, v/v, with 1% DMSO as a cosolvent, 1 mM HEPES buffered at pH 7.0) at 25 °C (Fig. 2A). On addition of Hg2+ (0–50 μM) a fourfold enhancement (Φ = 0.11) of the fluorescence intensity along with a 43 nm blue shift of emission maxima was observed (Fig. 2A).
1, v/v, with 1% DMSO as a cosolvent, 1 mM HEPES buffered at pH 7.0) at 25 °C (Fig. 2A). On addition of Hg2+ (0–50 μM) a fourfold enhancement (Φ = 0.11) of the fluorescence intensity along with a 43 nm blue shift of emission maxima was observed (Fig. 2A).
To evaluate the specificity of Hg2+, the emission behaviours of 1 (10 μM) towards various metal ions (50 μM) such as Cr3+, Mn2+, Fe2+, Co2+, Ba2+, Ni2+, Cu2+, Zn2+, Pb2+, Ag+, Ca2+, Cd2+, K+, Na+, Li+, and Al3+ were examined under the same conditions (H2O–EtOH, 4![[thin space (1/6-em)]](https://www.rsc.org/images/entities/char_2009.gif) :
:![[thin space (1/6-em)]](https://www.rsc.org/images/entities/char_2009.gif) 1, v/v). The results shown in Fig. 2A demonstrated the high specificity of compound 1 towards the detection of Hg2+ ions. Fluorescence titration of 1 (10 μM) was performed with various concentrations of Hg2+ (Fig. 2B). The plot of fluorescence intensity of 1 at 409 nm linearly increased up to the addition of 2 equiv. of Hg2+. From the fluorescence titration plot, the detection limit22 of 1 for the analysis of Hg2+ in mixed aqueous–organic medium was estimated to be 2.1 × 10⁻⁷ (M) (Fig. S3, ESI†).
1, v/v). The results shown in Fig. 2A demonstrated the high specificity of compound 1 towards the detection of Hg2+ ions. Fluorescence titration of 1 (10 μM) was performed with various concentrations of Hg2+ (Fig. 2B). The plot of fluorescence intensity of 1 at 409 nm linearly increased up to the addition of 2 equiv. of Hg2+. From the fluorescence titration plot, the detection limit22 of 1 for the analysis of Hg2+ in mixed aqueous–organic medium was estimated to be 2.1 × 10⁻⁷ (M) (Fig. S3, ESI†).
Up to this point it was thought that the changes in the absorption and fluorescence spectra were the consequences of a metal–ligand binding event as seen previously with many of our thiocarbamate based sensors.19 However, when we tried the reversibility experiments using metal ion chelators, it was realized that the change on addition of the Hg2+ ion was irreversible. Two metal ion chelators, EDTA and 8-hydroxyquinoline (100 μM each), were added separately to solutions containing compound 1 (10 μM) and Hg(NO3)2 (20 μM) in the mixed solvent media buffered at pH 7.0 at 25 °C. The recorded fluorescence spectra revealed that none of the chelators changed the fluorescence intensity of the solutions (Fig. 6). Additionally, fluorescence enhancement was not observed when a mixture of Hg2+ and 8-hydroxy quinoline solution was added to a solution of 1. These results indicated that the binding process of Hg2+ with 1 was irreversible.
Thus we started suspecting that the sensor molecule was reacting in the presence of Hg2+. Thin layer chromatography (TLC) of the chemosensing mixture (1 with Hg2+) showed a new, highly fluorescent spot having less polarity than the original ligand. This was counterintuitive since the charged complex was expected to be more polar. The spot was separated and single crystals were obtained on slow evaporation from a mixture of EtOH–CH3Cl (1![[thin space (1/6-em)]](https://www.rsc.org/images/entities/char_2009.gif) :
:![[thin space (1/6-em)]](https://www.rsc.org/images/entities/char_2009.gif) 1 v/v) at room temperature.
1 v/v) at room temperature.
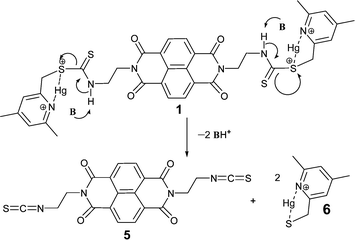
The crystal structure revealed the formation of an isothiocyanate from the thiocarbamate 1 (Fig. 5, compound 5). The lost fragment of the reaction was observed in mass spectrometric analysis. A peak corresponding to the formation of Hg-complex with the collidine unit was observed at m/z = 372 (Fig. S9, ESI†). All these lines of evidence helped us to gain the mechanistic insight into the formation of 5 from the chemodosimeter 1. The proposed mechanism of the fluorescence enhancement is shown inFig. 4. Thus compound 1 is a chemodosimeter for Hg2+ ions. Formation of isothiocyanate from a dithiocarbamic acid salt has been previously reported in the literature.23
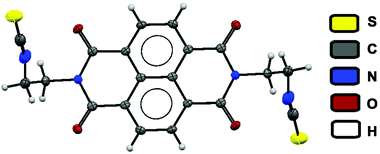 | ||
| Fig. 5 Crystal structure of isothiocyanate analogies obtained on reaction between chemodosimeter 1 and Hg2+ in mixed media. (Thermal ellipsoids were drawn at the 50% probability level.) | ||
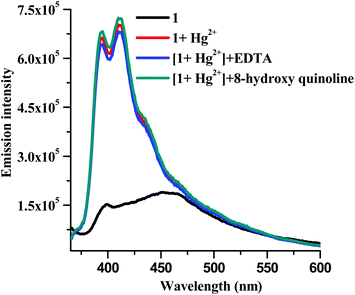 | ||
| Fig. 6 Fluorescence spectral studies for establishing the irreversibility in binding of 1 to Hg2+ in mixed solvent media. | ||
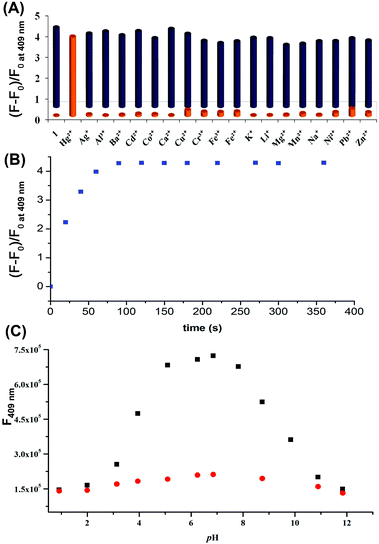
To evaluate the efficacy of dosimeter 1 for practical use as a Hg2+ selective probe in the presence of other coexisting metal ions, competitive experiments were carried out with 1 (10 μM) and Cr3+, Mn2+, Fe2+, Ba2+, Co2+, Ni2+, Zn2+, Pb2+, Ag+, Ca2+, Cd2+, K+, Na+, Li+ and Al3+ (50 μM) in H2O–EtOH (4![[thin space (1/6-em)]](https://www.rsc.org/images/entities/char_2009.gif) :
:![[thin space (1/6-em)]](https://www.rsc.org/images/entities/char_2009.gif) 1, v/v), with 1% DMSO as a cosolvent, buffered at pH 7.0 with HEPES at 25 °C, and Hg2+ (20 μM) was subsequently added to it. The fluorescence intensity of the solutions at 409 nm shown in Fig. 3A (blue bars) clearly demonstrated that probe 1 can be used for the detection of Hg2+ without interference by other metal ions.
1, v/v), with 1% DMSO as a cosolvent, buffered at pH 7.0 with HEPES at 25 °C, and Hg2+ (20 μM) was subsequently added to it. The fluorescence intensity of the solutions at 409 nm shown in Fig. 3A (blue bars) clearly demonstrated that probe 1 can be used for the detection of Hg2+ without interference by other metal ions.
The fluorescence spectra of 1 in the presence of Hg2+ were examined over a wide range of pH from 1 to 12 (Fig. 3C). The recorded emission spectra revealed that probe 1 can effectively detect the Hg2+ ions at a biologically relevant pH 4.5 to 9.
Longer reaction times with chemodosimeters can be problematic for real-time analysis of Hg2+.15b,20c,24 The time for the fluorescence response to Hg2+ with dosimeter 1 was also investigated. The fluorescence spectra of a solution containing 1 with 2 equivalents of Hg2+ were recorded at various time intervals. The plot of florescence intensity of 1 at 409 nm against time revealed that the reaction was fast and was completed within a minute (Fig. 3B). These results encouraged us to study chemodosimeter 1 for the real time intracellular monitoring of Hg2+.
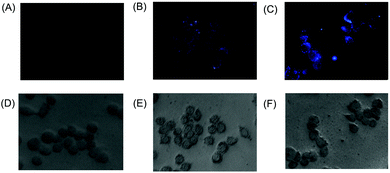
Chemodosimeter 1 was used for intracellular fluorescence imaging of Hg2+ ions using an epifluorescence microscope (Fig. 7). Human epithelial carcinoma cells, HeLa S3, were cultured in Dulbecco's modified Eagle's medium (DMEM), supplemented with 10% fetal bovine serum (FBS), 100 units mL−1 penicillin, and 100 μg mL−1 streptomycin, at 37 °C and 5% CO2. The cells were plated on 12 mm cover slips and were allowed to adhere for 24 h. The culture cell lines were exposed to Hg(NO3)2 (10 μM) in DMEM for 1 h at 37 °C and were subsequently washed with PBS to remove the excess Hg2+ ions. It was subsequently incubated with 1 (10 μM in DMSO) in PBS for 10 min at 25 °C, followed by washing the cells using PBS to remove the residual dye from the cells. The cells incubated with only 1 displayed a weak intracellular fluorescence (Fig. 7B), whereas the cells treated with both Hg2+ and 1 showed a bright intracellular fluorescence (Fig. 7C).
Conclusion
In conclusion, we have reported a novel chemodosimeter that detects Hg2+ with ca. fourfold enhancement of the fluorescence intensity and a 43 nm blue shift of the emission maxima. The sensor displayed a high selectivity for mercury ions in aqueous-ethanol media (4![[thin space (1/6-em)]](https://www.rsc.org/images/entities/char_2009.gif) :
:![[thin space (1/6-em)]](https://www.rsc.org/images/entities/char_2009.gif) 1 v/v). The analytical detection limit of the sensor is 2.1 × 10⁻⁷ M. Probing of Hg2+ ions in cells is also possible using the dosimeter exploiting its high cell permeability and the subsequent formation of the isothiocyanate in the presence of intracellular Hg2+ ions.
1 v/v). The analytical detection limit of the sensor is 2.1 × 10⁻⁷ M. Probing of Hg2+ ions in cells is also possible using the dosimeter exploiting its high cell permeability and the subsequent formation of the isothiocyanate in the presence of intracellular Hg2+ ions.
Acknowledgements
We sincerely thank Mr Soumik Mandal for the crystal structure of 5 and Mr Gregor P. Jose for the cell imaging. We acknowledge CSIR for a senior research fellowship (SRF) to JH, IISER for a SRF to SP, UGC for a SRF to MS and DST, India for a research grant (SR/S1/OC-26/2010). SB gratefully acknowledges DAAD, Germany for a Research Stay Fellowship at the University of Erlangen-Nürnberg in the laboratory of Prof. Rik Tykwinski where this work was initiated, and Dr Erin Chernick for her valuable suggestions on the NDI chemistry.Notes and references
-
(a)
A. W. Czarnik, Fluorescent Chemosensors for Ion and Molecule Recognition, American Chemical Society, Washington, DC, 1993 Search PubMed
; (b) E. M. Nolan and S. J. Lippard, Chem. Rev., 2008, 108, 3443 CrossRef CAS PubMed
; (c) A. P. de Silva, D. B. Fox and A. J. M. Huxley, Coord. Chem. Rev., 2000, 205, 41 CrossRef CAS
; (d) X. Xue, F. Wang and X. Liu, J. Am. Chem. Soc., 2008, 130, 3244 CrossRef CAS PubMed
; (e) A. P. de Silva, H. Q. N. Gunaratne, T. Gunnlaugsson, A. J. M. Huxley, C. P. McCoy, J. T. Rademacher and T. E. Rice, Chem. Rev., 1997, 97, 1515 CrossRef CAS PubMed
; (f) Q. He, E. W. Miller, A. P. Wong and C. J. Chang, J. Am. Chem. Soc., 2006, 128, 9316 CrossRef CAS PubMed
.
-
(a) N. Basu, A. Scheuhammer, N. Grochowina, K. Klenavic, D. Evans, M. O. Brien and M. Chan, Environ. Sci. Technol., 2005, 39, 3585 CrossRef CAS
; (b) Z. Zhang, D. Wu, X. Guo, X. Qian, Z. Lu, Q. Zu, Y. Yang, L. Duan, Y. He and Z. Feng, Chem. Res. Toxicol., 2005, 18, 1814 CrossRef CAS PubMed
.
-
(a) J. M. Benoit, W. F. Fitzgerald and A. W. Damman, Environ. Res., 1998, 78, 118 CrossRef CAS
; (b) J. Gutknecht, J. Membr. Biol., 1981, 61, 61 CrossRef CAS
.
- M. C. Harada, Rev. Toxicol., 1995, 25, 1 CrossRef CAS PubMed
.
- B. Ladizinski, N. Mistry and R. V. Kundu, Dermatol. Clin., 2011, 29, 111 CrossRef CAS PubMed
.
-
J. Wang, Stripping Analysis Principles, Instrumentation and Applications, VCH Publishers, Deerfield Beach, FL, 1985 Search PubMed
.
-
D. A. Skoog, F. J. Holler and T. A. Nieman, Principles of Instrumental Analysis, Saunders College Publishing, Philadelphia, PA, 5th edn, 1992 Search PubMed
.
- J. F. Zhang and J. S. Kim, Anal. Sci., 2009, 25, 1271 CrossRef CAS
.
-
(a) H. N. Kim, M. H. Lee, H. J. Kim, J. S. Kim and J. Yoon, Chem. Soc. Rev., 2008, 37, 1465 RSC
; (b) X. Chen, X. Tian, I. Shin and J. Yoon, Chem. Soc. Rev., 2011, 40, 4783 RSC
; (c) A. Razgulin, N. Ma and J. Rao, Chem. Soc. Rev., 2011, 40, 4186 RSC
.
-
J. P. Desvergne and A. W. Czarnik, Chemosensors for Ion and Molecule Recognition, NATO ASI Series, Series C, Kluwer Academic Publishers, London, 1997 Search PubMed
.
-
(a) D. G. Cho and J. L. Sessler, Chem. Soc. Rev., 2009, 38, 1647 RSC
; (b) M. J. Choi, Y. H. Kim, J. E. Namgoong and S. K. Chang, Chem. Commun., 2009, 3560 RSC
; (c) J. E. Namgoong, H. L. Jeon, Y. H. Kim, M. G. Choi and S. K. Chang, Tetrahedron Lett., 2010, 51, 167 CrossRef CAS PubMed
; (d) W. X. Ren, S. Bhuniya, J. F. Zhang, Y. H. Lee, S. J. Lee and J. S. Kim, Tetrahedron Lett., 2010, 51, 5784 CrossRef CAS PubMed
.
- Y. Yang, Q. Zhao, W. Feng and F. Li, Chem. Rev., 2013, 113, 192 CrossRef CAS PubMed
.
-
(a) B. Liu and H. Tian, Chem. Commun., 2005, 3156 RSC
; (b) K. Ranganathan, P. Ashokkumar, E. J. Padma Malar, V. T. Ramakrishnan and P. Ramamurthy, Chem. Commun., 2011, 47, 7695 RSC
; (c) Y. Shiraishi, S. Sumiya and T. Hirai, Org. Biomol. Chem., 2010, 8, 1310 RSC
; (d) M. H. Lee, S. W. Lee, S. H. Kim, C. Kang and J. S. Kim, Org. Lett., 2009, 11, 2101 CrossRef CAS PubMed
; (e) M. H. Lee, B. Cho, J. Yoon and J. S. Kim, Org. Lett., 2007, 9, 4515 CrossRef CAS PubMed
; (f) S. K. Ko, Y. K. Yang, J. Tae and I. Shin, J. Am. Chem. Soc., 2006, 128, 14150 CrossRef CAS PubMed
; (g) Y. K. Young, K. J. Yook and T. Jinsung, J. Am. Chem. Soc., 2005, 127, 16760 CrossRef PubMed
; (h) A. K. Atta, S. B. Kim, J. Heo and D. Gyu Cho, Org. Lett., 2013, 15, 1072 CrossRef CAS PubMed
.
-
(a) M. Y. Chae and A. W. Czarnik, J. Am. Chem. Soc., 1992, 114, 9704 CrossRef CAS
; (b) L. Ding, Q. Zou, Y. Qu and J. Su, RSC Adv., 2012, 2, 4754 RSC
; (c) G. Zhang, D. Zhang, S. Yin, X. Yang, Z. Shuai and D. Zhu, Chem. Commun., 2005, 2161 RSC
; (d) J. Du, J. Fan, X. Peng, P. Sun, J. Wang, H. Li and S. Sun, Org. Lett., 2010, 12, 476 CrossRef CAS PubMed
; (e) K. C. Song, J. S. Kim, S. M. Park, K. C. Chung, S. Ahn and S. K. Chang, Org. Lett., 2006, 8, 3413 CrossRef CAS PubMed
; (f) A. S. Rao, D. Kim, T. Wang, K. H. Kim, S. Hwang and K. H. Ahn, Org. Lett., 2012, 14, 2598 CrossRef CAS PubMed
.
-
(a) J. V. R. Lis, M. D. Marcos, R. M. Manez, K. Rurack and J. Soto, Angew. Chem., 2005, 44, 4405 CrossRef PubMed
; (b) W. Xuan, C. Chen, Y. Cao, W. He, W. Jiang, K. Liu and W. Wang, Chem. Commun., 2012, 48, 7292 RSC
.
- H. F. Shi, S. J. Liu, H. B. Sun, W. J. Xu, Z. F. An, J. Chen, S. Sun, X. M. Lu, Q. Zhao and W. Huang, Chem.–Eur. J., 2010, 16, 12158 CrossRef CAS PubMed
.
-
(a) J. S. Wu, I. C. Hwang, K. S. Kim and J. S. Kim, Org. Lett., 2007, 9, 907 CrossRef CAS PubMed
; (b) M. H. Lee, J. S. Wu, J. W. Lee, J. H. Jung and J. S. Kim, Org. Lett., 2007, 9, 2501 CrossRef CAS PubMed
; (c) W. Shi and H. Ma, Chem. Commun., 2008, 1856 RSC
; (d) Y. K. Yang, S. K. Ko, I. Shin and J. Tae, Org. Biomol. Chem., 2009, 7, 4590 RSC
; (e) A. Jana, J. S. Kim, H. S. Jung and P. K. Bharadwaj, Chem. Commun., 2009, 4417 RSC
; (f) P. Mahato, S. Saha, E. Suresh, R. D. Liddo, P. P. Parnigotto, M. T. Conconi, M. K. Kesharwani, B. Ganguly and A. Das, Inorg. Chem., 2012, 51, 1769 CrossRef CAS PubMed
.
-
(a) Y. Chen, Z.-H. Sun, B.-E. Song and Y. Liu, Org. Biomol. Chem., 2011, 9, 5530 RSC
; (b) A. Corsaro and V. Pistarà, Tetrahedron, 1998, 54, 15027 CrossRef CAS
.
-
(a) J. Hatai, S. Pal and S. Bandyopadhyay, RSC Adv., 2012, 2, 10941 RSC
; (b) J. Hatai, S. Pal, G. P. Jose, T. Sengupta and S. Bandyopadhyay, RSC Adv., 2012, 2, 7033 RSC
; (c) J. Hatai, S. Pal, G. P. Jose and S. Bandyopadhyay, Inorg. Chem., 2012, 51, 10129 CrossRef CAS PubMed
.
-
(a) M. Licchelli, L. Linati, A. O. Biroli, E. Perani, A. Poggi and D. Sacchi, Chem.–Eur. J., 2002, 8, 5161 CrossRef CAS
; (b) Z. Zhang, Y. Chen, D. Xu, L. Yang and A. Liu, Spectrochim. Acta, Part A, 2013, 105, 8 CrossRef CAS PubMed
; (c) Q. Li, M. Peng, H. Li, C. Zhong, L. Zhang, X. Cheng, X. Peng, Q. Wang, J. Qin and Z. Li, Org. Lett., 2012, 14, 2094 CrossRef CAS PubMed
; (d) R. S. K. Kishore, V. Ravikumar, G. Bernardinelli, N. Sakai and S. Matile, J. Org. Chem., 2008, 73, 738 CrossRef CAS PubMed
; (e) F. Würthner and M. Stolte, Chem. Commun., 2011, 47, 5109 RSC
; (f) N. Ponnuswamy, G. D. Pantos, M. M. J. Smulders and J. K. M. Sanders, J. Am. Chem. Soc., 2012, 134, 566 CrossRef CAS PubMed
; (g) C. Thalacker, C. Röger and F. Würthner, J. Org. Chem., 2006, 71, 8098 CrossRef CAS PubMed
; (h) B. A. Jones, A. Facchetti, M. R. Wasielewski and T. J. Marks, J. Am. Chem. Soc., 2007, 129, 15259 CrossRef CAS PubMed
; (i) M. Pandeeswar and T. Govindaraju, RSC Adv., 2013, 3, 11459 RSC
; (j) S. Bhosale, A. L. Sisson, P. Talukdar, A. Fürstenberg, N. Banerji, E. Vauthey, G. Bollot, J. Mareda, C. Röger, F. Würthner, N. Sakai and S. Matile, Science, 2006, 313, 84 CrossRef CAS PubMed
; (k) H. Shao, T. Nguyen, N. C. Romano, D. A. Modarelli and J. R. Parquette, J. Am. Chem. Soc., 2009, 131, 16374 CrossRef CAS PubMed
; (l) N. Sakai, R. Bhosale, D. Emery, J. Mareda and S. Matile, J. Am. Chem. Soc., 2010, 132, 6923 CrossRef CAS PubMed
; (m) G. G. Holman, M. Zewail-Foote, A. Rhoden-Smith, K. A. Johnson and B. L. Iverson, Nat. Chem., 2011, 3, 875 CrossRef CAS PubMed
; (n) A. Das and S. Ghosh, Macromolecules, 2013, 46, 3939 CrossRef CAS
; (o) M. R. Molla and S. Ghosh, Chem.–Eur. J., 2012, 18, 1290 CrossRef CAS PubMed
. For excellent reviews on recent developments of the NDI based systems, see: ; (p) S. V. Bhosale, C. H. Jani and S. J. Langford, Chem. Soc. Rev., 2008, 37, 331 RSC
; (q) N. Sakai, J. Mareda, E. Vauthey and S. Matile, Chem. Commun., 2010, 46, 4225 RSC
; (r) S. V. Bhosale, S. V. Bhosale and S. K. Bhargava, Org. Biomol. Chem., 2012, 10, 6455 RSC
.
- A. Mobinikhaledi and N. Foroughifar, Phosphorus, Sulfur Silicon Relat. Elem., 2006, 181, 405 CrossRef CAS
.
- H. Li, Z. Wen, L. Jin, Y. Kan and B. Yin, Chem. Commun., 2012, 48, 11659 RSC
.
- R. Wong and S. J. Dolman, J. Org. Chem., 2007, 72, 3969 CrossRef CAS PubMed
.
- H. Y. Lee, J. Jo, H. Park and D. Lee, Chem. Commun., 2011, 47, 5515 RSC
.
Footnote |
| † Electronic supplementary information (ESI) available: Detailed characterization and additional spectroscopic details is provided. CCDC 958704. For ESI and crystallographic data in CIF or other electronic format see DOI: 10.1039/c3ob42108b |
| This journal is © The Royal Society of Chemistry 2014 |

