 Open Access Article
Creative Commons Attribution 3.0 Unported Licence
Fluorescent light-up probe with aggregation-induced emission characteristics for in vivo imaging of cell apoptosis†
Haibin Shi‡a, Na Zhao‡b, Dan Dinga, Jing Lianga, Ben Zhong Tang*bc and Bin Liu*ad
aDepartment of Chemical & Biomolecular Engineering, National University of Singapore, 4 Engineering Drive 4, Singapore, 117576, Singapore. E-mail: cheliub@nus.edu.sg
bDepartment of Chemistry, Division of Biomedical Engineering, The Hong Kong University of Science and Technology, Clear Water Bay, Kowloon, Hong Kong, China. E-mail: tangbenz@ust.hk
cSCUT–HKUST Joint Research Laboratory, Guangdong Innovative Research Team, South China University of Technology, Guangzhou 510640, China
dInstitute of Materials Research Engineering, 3 Research Link, 117602, Singapore
First published on 10th September 2013
Abstract
In this paper, a new live-cell permeable, fluorescent light-up probe comprised of a hydrophilic caspase-specific Asp-Glu-Val-Asp (DEVD) peptide and a hydrophobic tetraphenylethene pyridinium unit has been developed for in vivo cell apoptosis imaging and drug screening. The probe shows a specific light-up response to activated caspase-3/7 with a high signal-to-background ratio. The significant fluorescence turn-on response of the probe is due to the aggregation of cleaved hydrophobic residues that populate the radiative decay channels. With good water solubility and biocompatibility, the probe is demonstrated to be a promising candidate for in vivo real time monitoring of caspase activation and in situ screening of apoptosis-inducing drugs.
1 Introduction
Apoptosis, or programmed cell death, is an important and active regulatory pathway of cell growth and proliferation.1 This process involves several biochemical changes, which include the translocation of phosphatidylserine (PS) from the cytoplasmic to the extracellular leaflet of the plasma membrane, chromosomal DNA fragmentation and caspases activation.2 Improper apoptosis can cause cancers, Alzheimer's disease, atherosclerosis, myocardial infarction and many other diseases.3 Noninvasive imaging agents that enable direct visualization and monitoring of apoptosis in vivo therefore have great potential value for the early diagnosis of diseases, evaluation of therapy efficacy, and screening of apoptosis-related drugs.One commonly used approach to assess apoptosis in vitro and in vivo is to target the negatively charged PS with Annexin V, a protein with high affinity for PS exposed during the late stages of apoptosis.4 However, false positive results are often obtained because PS exposure also occurs in other biological processes like necrosis.5 Assays for more specific key players in apoptosis such as the caspases have therefore received considerable attention. Caspases are a family of intracellular cysteine proteases that play critical roles in the initiation and execution of apoptosis.6 Caspase-3, a key mediator of cell apoptosis, has become an attractive and unambiguous target for apoptosis imaging in this family. Several approaches to monitor the progression of apoptosis have been developed based on functionalization of peptide substrates with latent fluorophores,7 luciferin,8 or fluorescent donor–acceptor pairs.8–10 Fluorogenic peptide substrates containing a C-terminally capped coumarin derivative (i.e., 7-amino-4-trifluoromethylcoumarin (AFC)) are one of the most widely used caspase probes for substrate specificity profiling experiments. However, they often show poor live cell permeability and are usually used for in vitro assays.7 In addition to substrate based probes, several small molecule probes have also been developed based on reversible and irreversible inhibitors against caspase-3.11–13 One of the most successful examples is the radiolabeled γ-carboxyglutamic acid analogue ([18F]-ML-10),11 which has currently entered clinical trials. As the small molecule based probes are born with fluorescence or radioactivities, the excess of unbound probes requires body clearance or multiple washing steps to minimize the background signal. It is thus highly desirable to develop simple, non-invasive and specific light-up probes for real-time apoptosis detection and evaluation of new apoptosis-related drugs in vivo.
In 2001, we found that some propeller-shaped molecules are nonfluorescent when molecularly dissolved in solution, but are induced to emit efficiently by aggregation formation. We termed the observed phenomenon aggregation-induced emission (AIE) and proposed the restriction of the intramolecular rotations (RIR) as the main cause of the fluorescence turn-on.14 Taking advantage of the AIE effect, a variety of AIE fluorogens have been developed for applications in optoelectronic devices,14b,15 biological sensing16 and imaging.17 Of particular interest is that the AIE fluorogens have been proved effective in detecting the activities of enzymes, such as trypsin,18 acetylcholinesterase (AChE),19 alkaline phosphatase20 and caspase-3/7 in solutions.21 Our recent development of live cell permeable, fluorescent light-up probes based on the peptide conjugates of tetraphenylethene (TPE) and tetraphenylsilole (TPS) has opened new opportunities to image proteins and monitor enzyme activities in living cells.16d,21 However, these probes are limited to in vitro studies due to the short wavelength emission of both TPE and TPS fluorogens.
In vivo imaging generally requires fluorescent molecules with large Stokes shifts and long wavelength absorption and emission to minimize the autofluorescence from biosubstrates. It remains a challenge to develop long wavelength emission AIE fluorogens with functional groups for further bioconjugation to yield water-soluble bioprobes. As traditional strategies of increasing conjugation length usually yield large sized fluorogens with poor-water solubility, we propose to develop small sized AIE fluorogens with charge transfer characteristics. As a proof-of-concept, we designed and synthesized a novel orange fluorogen, namely, azide-functionalized tetraphenylethene pyridinium (N3-PyTPE) by the incorporation of pyridinium units into TPE through vinyl functionality. A new probe targeting caspase-3/7 was further constructed via conjugation between a hydrophilic N-terminal acetyl protected and C-terminal alkyne-functionalized Asp-Glu-Val-Asp (Ac-DEVD) peptide and the hydrophobic N3-PyTPE fluorogen. Ac-DEVD-PyTPE is virtually water-soluble and displays very weak fluorescence in aqueous media due to the consumption of excitation energy by the active intramolecular rotations of TPE unit. However, intense fluorescence is observed once the probe is specifically hydrolyzed by active caspase-3/7 at the C-terminal of Asp (D), due to the poor water-solubility and aggregation of the hydrophobic PyTPE residues. Thanks to the orange emission of PyTPE, the Ac-DEVD-PyTPE probe is not only capable of real-time light-up imaging of the apoptosis process in vitro and in vivo, but also allows convenient apoptosis-related drug screening.
2 Results and discussion
2.1 Synthesis and characterization of the Ac-DEVD-PyTPE probe
The synthesis of the Ac-DEVD-PyTPE probe is shown in Scheme S1 in the ESI† and Scheme 1, respectively. The N3-PyTPE fluorogen was synthesized in a 32% total yield via four steps. The intermediates were characterized by NMR and HR-MS (ESI Fig. S1−S8†). The Ac-DEVD-PyTPE probe was synthesized by a copper catalyzed “click” reaction between N3-PyTPE and a C-terminal alkyne-functionalized Ac-DEVD peptide in a DMSO–water mixture with 85% yield after HPLC purification. The purity and identity of Ac-DEVD-PyTPE were verified by NMR, analytical HPLC and HR-MS (ESI Fig. S9 and S10†).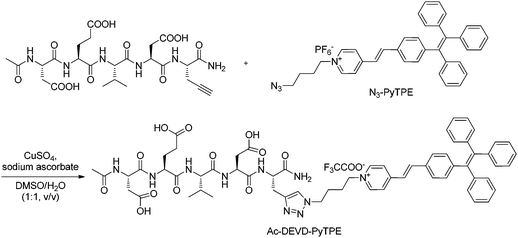 | ||
| Scheme 1 “Click” synthesis of probe Ac-DEVD-PyTPE. | ||
The N3-PyTPE fluorogen has an absorption maximum at 405 nm and shows very weak orange–red emission at 636 nm in DMSO (ESI Fig. S11A†). Upon gradual addition of water to its DMSO solution, the emission intensity further decreases when the fraction of water (fw) is less than 80%, due to the intramolecular charge transfer (ICT) from the electron-donating TPE unit to the electron-accepting pyridinium unit, which weakens fluorescence in polar media. At higher fw, the emission intensity is revitalized and increased with increasing water content. N3-PyTPE emits strong orange fluorescence as nanoaggregates with a quantum yield of 9.9% in a mixture of DMSO–H2O (v![[thin space (1/6-em)]](https://www.rsc.org/images/entities/char_2009.gif) :
:![[thin space (1/6-em)]](https://www.rsc.org/images/entities/char_2009.gif) v = 1
v = 1![[thin space (1/6-em)]](https://www.rsc.org/images/entities/char_2009.gif) :
:![[thin space (1/6-em)]](https://www.rsc.org/images/entities/char_2009.gif) 99) (Fig. 1A and B). The corresponding excitation spectra are shown in Fig. S11B in the ESI,† which reveal that the nanoaggregates remain in solution. The aggregate formation was further confirmed by laser light scattering (LLS) measurements. In the aqueous mixture, N3-PyTPE molecules cluster into aggregates with an effective diameter of 27 ± 1 nm (ESI Fig. S11C†). Clearly, N3-PyTPE is AIE-active.
99) (Fig. 1A and B). The corresponding excitation spectra are shown in Fig. S11B in the ESI,† which reveal that the nanoaggregates remain in solution. The aggregate formation was further confirmed by laser light scattering (LLS) measurements. In the aqueous mixture, N3-PyTPE molecules cluster into aggregates with an effective diameter of 27 ± 1 nm (ESI Fig. S11C†). Clearly, N3-PyTPE is AIE-active.
![(A) PL spectra of N3-PyTPE in DMSO–water mixtures with different water fractions (fw). (B) Plot of (I/I0) values versus the compositions of the aqueous mixtures. I0 = emission intensity of N3-PyTPE in pure DMSO solution. [N3-PyTPE] = 10 μM; λex = 405 nm. Inset: photographs of N3-PyTPE in DMSO–water mixtures with fw values of 0, 80 and 99% taken under 365 nm UV illumination.](/image/article/2013/OB/c3ob41572d/c3ob41572d-f1.gif) | ||
| Fig. 1 (A) PL spectra of N3-PyTPE in DMSO–water mixtures with different water fractions (fw). (B) Plot of (I/I0) values versus the compositions of the aqueous mixtures. I0 = emission intensity of N3-PyTPE in pure DMSO solution. [N3-PyTPE] = 10 μM; λex = 405 nm. Inset: photographs of N3-PyTPE in DMSO–water mixtures with fw values of 0, 80 and 99% taken under 365 nm UV illumination. | ||
The Ac-DEVD-PyTPE probe shows similar absorption spectral profiles with that of N3-PyTPE in the 350–500 nm range (Fig. S11A†). Opposite to N3-PyTPE with strong fluorescence in DMSO–H2O (v/v = 1![[thin space (1/6-em)]](https://www.rsc.org/images/entities/char_2009.gif) :
:![[thin space (1/6-em)]](https://www.rsc.org/images/entities/char_2009.gif) 99), Ac-DEVD-PyTPE shows very weak fluorescence in the same medium with a quantum yield of 0.2% due to its good water-solubility, which favours intramolecular rotations of the TPE unit. The low probe fluorescence is beneficial to light-up sensing and imaging of cell apoptosis with minimum background interference.
99), Ac-DEVD-PyTPE shows very weak fluorescence in the same medium with a quantum yield of 0.2% due to its good water-solubility, which favours intramolecular rotations of the TPE unit. The low probe fluorescence is beneficial to light-up sensing and imaging of cell apoptosis with minimum background interference.
2.2 In vitro caspase assay
To explore the potential of the probe for caspase activity study, we next performed in vitro enzymatic assays with recombinant caspase-3. As shown in Fig. 2A, strong fluorescence signals are observed when Ac-DEVD-PyTPE is treated with caspase-3 in PIPES buffer (50 mM PIPES, 100 mM NaCl, 1 mM ethylenediaminetetraacetic acid, 0.1% w/v 3-[(3-cholamidopropyl)dimethylammonio]propane-sulfonic, 25% w/v sucrose, pH = 7.2). Meanwhile, nanoaggregates with an effective diameter of 120 ± 2 nm are formed along with the increase of solution fluorescence (ESI Fig. S12A†). Most of the fluorescence is readily competed away when the probe is pre-treated with 5-[(S)-(+)-2-(methoxymethyl)pyrrolidino]sulfonylisatin (MPS), a highly specific inhibitor of caspase-3, indicating that specific cleavage of Ac-DEVD from Ac-DEVD-PyTPE is inhibited. This is further confirmed by LC-MS analysis shown in Scheme S2 and Fig. S13 in the ESI.†![(A) PL spectra of Ac-DEVD-PyTPE upon treatment with caspase-3 in the presence and absence of inhibitor MPS (10 μM) in PIPES buffer. (B) Plot of I − I0versus time of Ac-DEVD-PyTPE with and without treatment of caspase-3 from 0 to 60 min. [caspase-3] = 5 μg mL−1, [Ac-DEVD-PyTPE] = 10 μM. (C) Plot of PL intensity versus concentrations of Ac-DEVD-PyTPE in PIPES buffer upon treatment with caspase-3. [caspase-3] = 5 μg mL−1. (D) Plot of (I − I0)/I0versus different proteins, where I and I0 are the PL intensities at protein concentrations of 20 and 0 μg mL−1, respectively. λex = 405 nm; λem = 610 nm. Inset: photographs taken under 365 nm UV illumination.](/image/article/2013/OB/c3ob41572d/c3ob41572d-f2.gif) | ||
| Fig. 2 (A) PL spectra of Ac-DEVD-PyTPE upon treatment with caspase-3 in the presence and absence of inhibitor MPS (10 μM) in PIPES buffer. (B) Plot of I − I0versus time of Ac-DEVD-PyTPE with and without treatment of caspase-3 from 0 to 60 min. [caspase-3] = 5 μg mL−1, [Ac-DEVD-PyTPE] = 10 μM. (C) Plot of PL intensity versus concentrations of Ac-DEVD-PyTPE in PIPES buffer upon treatment with caspase-3. [caspase-3] = 5 μg mL−1. (D) Plot of (I − I0)/I0versus different proteins, where I and I0 are the PL intensities at protein concentrations of 20 and 0 μg mL−1, respectively. λex = 405 nm; λem = 610 nm. Inset: photographs taken under 365 nm UV illumination. | ||
The enzyme kinetic studies were subsequently performed by incubating recombinant caspase-3 with Ac-DEVD-PyTPE at 37 °C, and the changes in fluorescence were monitored over time. As shown in Fig. 2B, there is a significant increase in fluorescence over background in the presence of caspase-3. In the absence of caspase-3, nearly no change in fluorescence is observed, confirming that Ac-DEVD-PyTPE is specifically recognized and cleaved by caspase-3. Additionally, recombinant caspase-3 (5 μg mL−1) was treated with Ac-DEVD-PyTPE at different concentrations (0–20 μM). A linear fluorescence increase at 610 nm is observed (Fig. 2C), which suggests that the Ac-DEVD-PyTPE can be easily quantified based on the PL intensity changes. A similar trend is also observed when the enzyme concentration is increased from 0 to 20 μg mL−1 at a fixed probe concentration of 10 μM (ESI Fig. S12B†). This indicates that the solution fluorescence could also be used for enzyme quantification. In addition, the probe shows good selectivity to caspase-3/7, which is evidenced by the 43- and 36-fold higher fluorescence changes in (I − I0)/I0 than the other six enzymes (cathepsin B, pepsin, trypsin, papain, lysozyme and caspase-1) under the same experimental conditions (Fig. 2D). As compared to other proteins within the caspase family, such as caspase-1, the probe is highly selective to caspase-3/7. The cytotoxicity of Ac-DEVD-PyTPE was then evaluated by the widely used MTT assay. As shown in ESI Fig. S14,† after incubation of the MCF-7 cells with Ac-DEVD-PyTPE at 5, 10, and 20 μM for 12, 24 and 48 h, the cell viabilities are close to 100% under the testing conditions, indicative of low cytotoxicity of the probe.
2.3 Live cell imaging of caspase activation
The good biocompatibility of the probe further allows us to explore their potential in live-cell imaging of caspase-3 activation. Confocal microscopy was used to image the normal and apoptotic MCF-7 cells which were pre-treated with Ac-DEVD-PyTPE. As shown in Fig. 3 and 4, the probe upon incubation with un-induced cells shows extremely low fluorescence signals, indicative of low background from the probe itself in the cellular environment and little or no caspase-3 activity. In sharp contrast, strong fluorescence signals are observed from the cells treated by staurosporine (STS), a widely used apoptosis inducer (Fig. 3E). In addition, as shown in Fig. 4, the fluorescence from apoptotic cells increases almost linearly with the increased STS concentrations; and the fluorescence signals are greatly reduced when STS-induced cells are pre-treated with inhibitor MPS, prior to incubation with Ac-DEVD-PyTPE. The specificity of the probe to cell apoptosis is further verified upon co-stain with commercial probes. Excellent overlap is observed between the fluorescence images of the probe and fluorescence signals generated from anti-caspase-3 primary antibody and a fluorescein isothiocyanate (FITC)-labeled secondary antibody (Fig. 3F). Additionally, apoptotic MCF-7 cells were treated with both Ac-DEVD-PyTPE and commercial Annexin V-Alexa Fluor. As expected, Annexin V-Alexa Fluor is localized on the cell surface, but Ac-DEVD-PyTPE shows strong fluorescence inside the cells (Fig. 3I). As the probe itself does not fluorescence >505 nm under the same confocal conditions, these results provide direct evidence for intracellular delivery and caspase-specific activation of the probe. Undoubtedly, Ac-DEVD-PyTPE is a suitable probe for detection of caspase-3 activity and apoptosis imaging in live cells.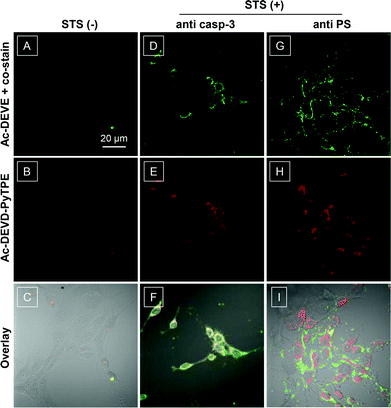 | ||
| Fig. 3 Confocal laser scanning microscopy (CLSM) images of live MCF-7 cell apoptosis. Normal (A, B) and apoptotic MCF-7 cells upon treatment with Ac-DEVD-PyTPE (5 μM, 1% DMSO) and co-stain with commercial antibody (D, E) or Annexin V-Alexa Fluor (G, H). STS (3 μM) was used to induce cell apoptosis for 2 h. Red = probe fluorescence (excitation at 405 nm using optical filters with band passes of 575–635 nm for images); green = fluorescence signal generated from anti-caspase-3 primary antibody and a FITC labelled secondary antibody or Annexin V-Alexa Fluor (excitation at 488 nm using optical filters >505 nm for images). The overlay images for AB, DE, and GH are shown in C, F and I, respectively. All images share the same scale bar of 20 μm. | ||
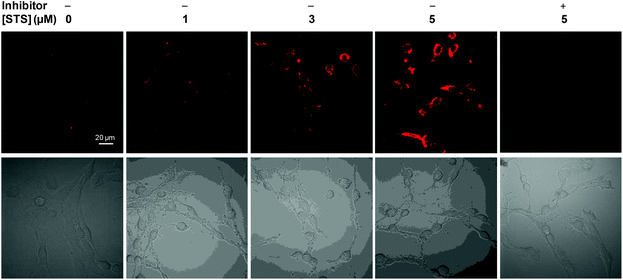 | ||
| Fig. 4 CLSM images of MCF-7 live cell treated with different amounts of staurosporine and 3 μM Ac-DEVD-PyTPE as well as fluorescence imaging of apoptotic MCF-7 cells treated with both Ac-DEVD-PyTPE (3 μM, 1% DMSO) and MPS inhibitor (10 μM). All images were acquired in the same way. In all experiments, the probe was incubated with cells for 2 h, and STS or inhibitor was incubated with cells for 2 h before cell imaging. | ||
To explore the capability of the probe for real-time monitoring of cell apoptosis, Ac-DEVD-PyTPE (3 μM) was incubated with MCF-7 cells at 37 °C for 2 h before STS (3 μM) treatment. As shown in Fig. 5, with the increased incubation time, the fluorescence intensity increases gradually with the progress of cellular apoptosis. These images clearly demonstrate that Ac-DEVD-PyTPE not only can be used for the detection of caspase-3 activity but also allows real-time monitoring of cell apoptosis.
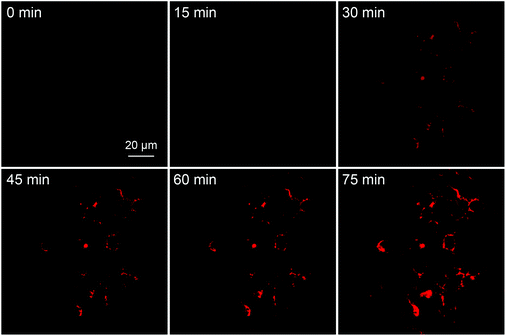 | ||
| Fig. 5 Real-time fluorescence images showing the MCF-7 cell apoptotic process with Ac-DEVD-PyTPE (3 μM) at room temperature. STS (3 μM) was used to induce cell apoptosis. The images were acquired with CLSM under excitations at 405 nm using optical filters with band passes of 575–635 nm. All images have the same scale bar of 20 μm. | ||
2.4 In vivo apoptosis imaging and in situ drug screening
To assess the capability of the probe for in situ screening of compounds that can induce cell apoptosis, three known apoptosis inducers, sodium ascorbate (Na Asb), cisplatin (CIS) and STS were used to treat MCF-7 cells. After the cells were incubated with Ac-DEVD-PyTPE for 2 h, each compound (3 μM in DMSO) was added into the cells and incubated for an additional 2 h. The apoptosis-inducing capabilities of these compounds were evaluated by monitoring the cell fluorescence change with a confocal microscopy. As shown in Fig. 6, the strongest fluorescence enhancement is observed for STS-treated cells, which indicates that STS has a relatively higher inducing efficacy for apoptosis as compared to those for the other two.22 This result indicates that the probe can potentially be used for screening apoptosis-inducing agents in living cells.![CLSM images of Ac-DEVD-PyTPE pre-incubated MCF-7 cells upon treatment with 3 μM each of DMSO, sodium ascorbate (Na Asb), cisplatin, and staurosporine (STS). [Ac-DEVD-PyTPE] = 3 μM. All images were acquired under the same condition.](/image/article/2013/OB/c3ob41572d/c3ob41572d-f6.gif) | ||
| Fig. 6 CLSM images of Ac-DEVD-PyTPE pre-incubated MCF-7 cells upon treatment with 3 μM each of DMSO, sodium ascorbate (Na Asb), cisplatin, and staurosporine (STS). [Ac-DEVD-PyTPE] = 3 μM. All images were acquired under the same condition. | ||
To demonstrate the probe for in vivo imaging of apoptosis, subcutaneous C6 tumor-bearing mice with and without intravenous injection of STS were imaged for 15 min using an IVIS spectrum imaging system. As shown in Fig. 7A and Fig. S15,† induction of apoptosis using STS results in gradual fluorescence increase from the tumors. In contrast, the signals from the normal tissues or tumors without STS treatment are very weak. This is consistent with the in vitro results shown in Fig. 3, indicating that Ac-DEVD-PyTPE is suitable for in vivo visualization of apoptosis. Fig. 7B shows the fluorescence changes in tumor and normal tissues as a function of time. A 3-fold fluorescence increase in the apoptotic tumor tissues relative to normal tissues is observed as early as 5 min after the injection of Ac-DEVD-PyTPE. The non-apoptotic tumor tissue shows similar fluorescence with normal tissues. These results suggest that the probe is able to rapidly respond to cell apoptosis in vivo.
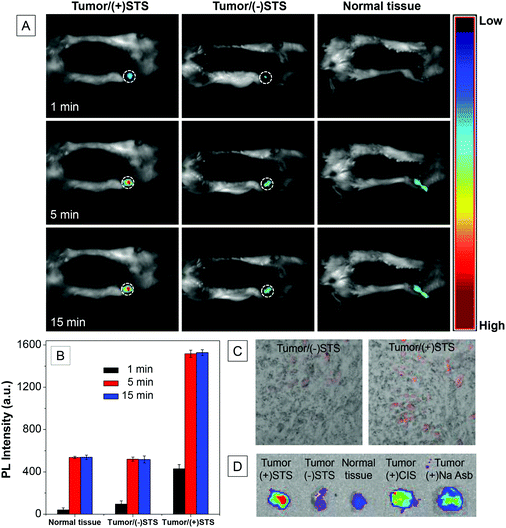 | ||
| Fig. 7 (A) In vivo fluorescence images of subcutaneous C6 tumor-bearing mice after intratumoral injection of Ac-DEVD-PyTPE with or without pretreatment of staurosporine (STS) for 12 h before the probe injection using normal mice as control. (B) Quantitative image analysis of the probe-treated tissues at different times. (C) Fluorescence images of excised tissues with or without apoptosis after Ac-DEVD-PyTPE treatment. (D) Ex vivo screening of apoptosis inducers of STS, CIS and Na Asb. | ||
To further evaluate the fluorescence change in the tumor region, apoptotic and non-apoptotic tumors were excised immediately after in vivo imaging and the tissues were analyzed using an IVIS spectrum imaging system (Fig. 7C). High fluorescence signal is specifically detected in the tumor/(+)STS tissues, however, only very weak fluorescence is observed for tumor/(−)STS tissues, which closely matches the images obtained in live mice (Fig. 7). Overall, these results demonstrate that the Ac-DEVD-PyTPE probe can be used for fluorescence light-up imaging of apoptosis in living animals.
To test whether the probe can be used to quantify the efficacy of apoptosis inducing agents in tumors, STS, CIS and Na Asb were treated with a C6 tumor-bearing mice overnight, and the Ac-DEVD-PyTPE was subsequently injected into the tumor directly. After 15 min of incubation, the tumors and normal tissues were immediately excised and imaged using an IVIS spectrum imaging system. As shown in Fig. 7D, STS-treated tumor shows much stronger fluorescence as compared to the other two, clearly demonstrating that the probe is also suitable for the quantitative analysis of apoptosis-related drug efficacy in animal models.
3 Conclusions
In conclusion, we have developed an Ac-DEVD-conjugated AIE probe for in vivo apoptosis study and ex-vivo drug screening. Thanks to its novel AIE nature, the probe has weak fluorescence in aqueous media but becomes highly emissive when cleaved by caspase-3/7. It enables real-time light-up monitoring of caspase-3/7 activities both in vitro and in vivo. Additionally, our AIE probe strategy provides an efficient platform for both in vitro and in vivo imaging of apoptosis, which further allows in situ screening of apoptosis-inducing agents in tumors. In light of its simplicity, low cost and high efficiency, the quantitative non-invasive imaging of apoptosis will offer a significant advancement for rapid and dynamic screening as well as the validation of experimental therapeutic agents.Acknowledgements
We are grateful to Singapore National Research Foundation (R279-000-390-281), MIT Alliance for Research and Technology (SMART) (R279-000-378-592), and JCO (IMRE/12-8P1103), Hong Kong (HKUST2/CRF/10 and AoE/P-03/08), and the Guangdong Innovative Research Team Program (201101C0105067115) for financial support.References
- (a) D. L. Vaux and S. J. Korsmeyer, Cell, 1999, 96, 245 CrossRef CAS; (b) M. Grutter, Curr. Opin. Struct. Biol., 2000, 10, 649 CrossRef CAS.
- (a) Y. Shi, Nat. Struct. Biol., 2001, 8, 394 CrossRef CAS PubMed; (b) G. Niu and X. Chen, J. Nucl. Med., 2010, 51, 1659 CrossRef CAS PubMed.
- (a) H. Okada and T. Mak, Nat. Rev. Cancer, 2004, 4, 592 CrossRef CAS PubMed; (b) S. J. Riedl and Y. Shi, Nat. Rev. Mol. Cell Biol., 2004, 5, 897 CrossRef CAS PubMed.
- (a) V. Ntziachristos, E. A. Schellenberger, J. Ripoll, D. Yessayan, E. Graves, A. B. Jr, L. Josephson and R. Weissleder, Proc. Natl. Acad. Sci. U. S. A., 2004, 101, 12294 CrossRef CAS PubMed; (b) A. Petrovsky, E. Schellenberger, L. Josephson, R. Weissleder and A. Bogdanov, Cancer Res., 2003, 63, 1936 CAS; (c) E. A. Schellenberger, A. Bogdanov, A. Petrovsky, V. Ntziachristos, R. Weissleder and L. Josephson, Neoplasia, 2003, 5, 187 CAS; (d) T. Belhocine, N. Steinmetz, R. Hustinx, P. Bartsch, G. Jerusalem, L. Seidel, P. Rigo and A. Green, Clin. Cancer Res., 2002, 8, 2766 CAS.
- O. Krysko, L. de Ridder and M. Cornelissen, Apoptosis, 2004, 9, 495 CrossRef CAS.
- (a) N. Thornberry and Y. Lazebnik, Science, 1998, 281, 1312 CrossRef CAS; (b) A. Degterev, M. Boyce and J. Yuan, Oncogene, 2003, 22, 8543 CrossRef CAS PubMed; (c) D. L. Vaux and S. J. Korsmeyer, Cell, 1999, 96, 245 CrossRef CAS.
- B. Laxman, D. E. Hall, M. S. Bhojani, D. A. Hamstra, T. L. Chenevert, B. D. Ross and A. Rehemtulla, Proc. Natl. Acad. Sci. U. S. A., 2002, 99, 16551 CrossRef CAS PubMed.
- R. Weissleder and V. Ntziachristos, Nat. Med., 2003, 9, 123 CrossRef CAS PubMed.
- Z.-G. Li, K. Yang, Y.-A. Cao, G. Zheng, D.-P. Sun, C. Zhao and J. Yang, Int. J. Mol. Sci., 2010, 11, 1413 CrossRef CAS PubMed.
- S. Lee, K. Y. Choi, H. Chung, J. H. Ryu, A. Lee, H. Koo, I. C. Youn, J. H. Park, I. S. Kim, S. Y. Kim, X. Chen, S. Y. Jeong, I. C. Kwon, K. Kim and K. Choi, Bioconjugate Chem., 2011, 22, 125 CrossRef CAS PubMed.
- A. Cohen, A. Shirvan, G. Levin, H. Grimberg, A. Reshef and I. Ziv, Cell Res., 2009, 19, 625 CrossRef CAS PubMed.
- D. Zhou, W. Chu, J. Rothfuss, C. Zeng, J. Xu, L. Jones, M. J. Welch and R. H. Mach, Bioorg. Med. Chem. Lett., 2006, 16, 5041 CrossRef CAS PubMed.
- (a) E. Bedner, P. Smolewski, P. Amstad and Z. Darzynkiewicz, Exp. Cell Res., 2000, 259, 308 CrossRef CAS PubMed; (b) P. Smolewski, E. Bedner, L. T. Du, T.-C. Hsieh, J. M. Wu, D. J. Phelps and Z. Darzynkiewicz, Cytometry, 2001, 44, 73 CrossRef CAS; (c) L. E. Edgington, A. B. Berger, G. Blum, V. E. Albrow, M. G. Paulick, N. Lineberry and M. Bogyo, Nat. Med., 2009, 15, 967 CrossRef CAS PubMed.
- (a) J. Luo, Z. Xie, J. W. Y. Lam, L. Cheng, H. Chen, C. Qiu, H. S. Kwok, X. Zhan, Y. Liu, D. Zhu and B. Z. Tang, Chem. Commun., 2001, 1740 RSC; (b) Y. Hong, J. W. Y. Lam and B. Z. Tang, Chem. Soc. Rev., 2011, 40, 5361 RSC.
- Z. Zhao, S. J. Chen, J. W. Y. Lam, P. Lu, Z. Wang, B. Hu, X. Chen, P. Lu, H. S. Kwok, Y. Ma and B. Z. Tang, J. Mater. Chem., 2011, 21, 10949 RSC.
- (a) K. Hatano, H. Saeki, H. Yokota, H. Aizawa, T. Koyama, K. Matsuoka and D. Terunuma, Tetrahedron Lett., 2009, 50, 5816 CrossRef CAS PubMed; (b) M. Wang, D. Q. Zhang, G. X. Zhang and D. B. Zhu, Chem. Commun., 2008, 4469 RSC; (c) Y. Liu, C. M. Deng, L. Tang, A. J. Qin, R. R. Hu, J. Z. Sun and B. Z. Tang, J. Am. Chem. Soc., 2011, 133, 660 CrossRef CAS PubMed; (d) H. Shi, J. Z. Liu, J. L. Geng, B. Z. Tang and B. Liu, J. Am. Chem. Soc., 2012, 134, 9569 CrossRef CAS PubMed.
- (a) W. Qin, D. Ding, J. Z. Liu, Z. Y. Wang, Y. Hu, B. Liu and B. Z. Tang, Adv. Funct. Mater., 2012, 22, 771 CrossRef CAS; (b) Y. Yu, C. Feng, Y. N. Hong, J. Z. Liu, S. J. Chen, K. M. Ng, K. Q. Luo and B. Z. Tang, Adv. Mater., 2011, 23, 3298 CrossRef CAS PubMed; (c) Q. L. Zhao, K. Li, S. J. Chen, A. Qin, D. Ding, S. Zhang, Y. Liu, B. Liu, J. Z. Sun and B. Z. Tang, J. Mater. Chem., 2012, 22, 15128 RSC; (d) J. L. Geng, K. Li, D. Ding, X. H. Zhang, W. Qin, J. Z. Liu, B. Z. Tang and B. Liu, Small, 2012, 8, 3655 CrossRef CAS PubMed; (e) K. Li, W. Qin, D. Ding, N. Tomvzak, J. L. Gong, R. R. Liu, J. Z. Liu, X. H. Zhang, H. W. Liu, B. Liu and B. Z. Tang, Sci. Rep., 2013, 3, 1150 CAS.
- J. P. Xu, Y. Fang, Z. G. Song, J. Mei, L. Jia, A. J. Qin, J. Z. Sun, J. Ji and B. Z. Tang, Analyst, 2011, 136, 2315 RSC.
- M. Wang, X. G. Gu, G. X. Zhang, D. Q. Zhang and D. B. Zhu, Anal. Chem., 2009, 81, 4444 CrossRef CAS PubMed.
- M. C. Zhao, M. Wang, H. J. Liu, D. S. Liu, G. X. Zhang, D. Q. Zhang and D. B. Zhu, Langmuir, 2009, 25, 676 CrossRef CAS PubMed.
- H. Shi, K. T. K. Ryan, B. Z. Tang and B. Liu, J. Am. Chem. Soc., 2012, 134, 17972 CrossRef CAS PubMed.
- R. Herrmann, W. Fayad, S. Schwarz, M. Berndtsson and S. Linder, J. Biomol. Screen, 2008, 13, 1 CrossRef CAS PubMed.
Footnotes |
| † Electronic supplementary information (ESI) available. See DOI: 10.1039/c3ob41572d |
| ‡ Dr H. Shi and Dr N. Zhao contributed equally to this work. |
| This journal is © The Royal Society of Chemistry 2013 |
