 Open Access Article
 This Open Access Article is licensed under a
 Creative Commons Attribution 3.0 Unported Licence
Encapsulation of Mo2C in MoS2 inorganic fullerene-like nanoparticles and nanotubes
Inna
Wiesel
a,
Ronit
Popovitz-Biro
b and
Reshef
Tenne
*a
aDepartment of Materials and Interfaces, Weizmann Institute of Science, Rehovot 76100, Israel. E-mail: reshef.tenne@weizmann.ac.il
bDepartment of Chemical Research Support, Electron Microscopy Unit, Weizmann Institute of Science, Rehovot 76100, Israel
First published on 22nd January 2013
Abstract
Mo2C nanoparticles encapsulated within MoS2 inorganic fullerene-like nanoparticles and nanotubes were produced by carbothermal reaction at 1200–1300 °C inside a vertical induction furnace. The particles were analyzed using various electron microscopy techniques and complementary methods.
Closed-cage nanostructures of carbon and their inorganic counterparts possess an inner void which could be filled with various materials.1–5 This filling can alter the properties of the encaging nanoparticles as well as of the filling material, stabilize phases not stable otherwise and lead to observation of interesting phenomena.
Encapsulation of metal carbides within carbon nanoclusters was demonstrated many times using the arc-discharge technique.6–9 Transition metal dichalcogenides MX2 (M = W, Mo; X = S, Se) are inorganic layered compounds that can be synthesized, akin to carbon, in onion-like and nanotubular forms (termed IF and INT, respectively).10 The large scale synthesis of IF and INT of WS2 is based on the conversion of tungsten oxide nanoparticles into their respective sulfides. In this case, encapsulation of the corresponding metal oxide naturally occurs within those structures during the synthetic process;11 WC nanoparticles encapsulated within WS2 were synthesized as well by high-temperature sulfidization.12 In this communication, we report the synthesis of Mo2C nanosized crystals confined within MoS2 closed-cage nanoparticles and nanotubes.
Many of the transition metal carbides are superconductors;13 in particular molybdenum carbide is superconducting in its various phases.14 The high-temperature phase of Mo2C (β-Mo2C) forms at temperatures above 1220 °C.15 It has a closely packed hexagonal structure, belonging to the P63/mmc space group (ICDD PDF #00-035-0787) and has a superconducting transition temperature (Tc) in the range of 5.1–7.2 K.14 The study of 1D superconductors is attracting considerable interest.16 Previously, it was suggested that intrinsic thermal17 and quantum18 fluctuations play a major role in the 1D limit and lead to lowering of Tc. In the same context, WS2 nanotubes were proven in the past to be good templates for superconducting hybrid nanowire fabrication.19 Synthesis of nanoscale Mo2C encapsulated by MoS2 may provide an opportunity for more elaborate investigation of the low-dimensional superconductivity phenomena.
IF-MoS2 and IF-WS2 nanoparticles were shown to exhibit superior lubricating properties when added to a variety of lubricating fluids and the latter were recently commercialized for critical applications. Having a hard carbide encapsulated by a lubricating sulfide shell outside may prove advantageous for some applications, for example in composites with improved strength and reduced friction. In addition, both Mo2C and MoS2 are well-established catalysts for various forms of hydrotreatment (hydrodesulfurization, hydrodenitrogenation, and hydrogenation).20,21 Nano-encapsulation may enhance the catalytic activity as well as the stability of the catalyst.
The synthesis was carried out in a home-built vertical induction furnace used for high-temperature synthesis in a protected atmosphere. The schematics of the system are shown in Fig. 1. The reaction chamber consists of a quartz tube capped on both ends with water-cooled air-tight stainless steel flanges. Flow of nitrogen gas was obtained through stainless steel tubes welded into those flanges. The cylindrical graphite susceptor is heated from outside the chamber by the high-frequency generator. A graphite crucible with the precursor material (MoS2, 99%, Alfa Aesar) was positioned inside the central space of the graphite heater. The graphite crucible along with the graphite susceptor acts as a source of carbon for the carbothermal reaction which leads to the formation of Mo2C. The substrate (perforated Mo foil 0.025 mm thick, 99.95%, Alfa Aesar) is supported above the precursor crucible by graphite spacers. The substrates were cleaned by sonication in acetone for 10 min and air-dried. The surfaces of the Mo substrates were shown to have a 5 nm film of native oxide with a mixed MoO2–MoO3 composition by XPS. Prior to the reaction, the reactor was purged with 400 cm3 min−1 flow of nitrogen for 4 hours or alternatively with 100 cm3 min−1 overnight, in order to eliminate the traces of water and oxygen from the reaction chamber. The furnace in the described setup heats up to 1000 °C within a minute and then the heating progresses in a slower pace to reach a maximum temperature after ∼5 min. The measured maximum temperature at the position of the precursor crucible, which was determined by pyrometric measurements, was 1305 °C ± 50 °C (determined by heating the system with the crucible and the substrate removed from the line of sight of the pyrometer). However, the maximum temperature can reach 1650 °C and even higher, if the setup is adjusted (for example, in reactions with closed ampoules and different susceptor geometry, reaction temperatures as high as these were indeed realized). During the reaction, the temperature was monitored with a thermocouple inserted through the solid graphite support close to the position of the crucible. The temperature of the substrate could not be measured reliably due to large emissivity changes of the substrate in the course of the reaction (blackening of the initially shiny molybdenum foil), but is estimated to be 100–200 °C less than the crucible by visual differences in color during heating. The reactions were carried out for 5–60 min under 100 cm3 min−1 N2 flow in a small overpressure of 2–4 millibar obtained by tuning the level of liquid (NaOH solution) in a gas washing bottle connected downstream to the outlet of the system. After the reaction, the setup was allowed to cool to room temperature under the same 100 cm3 min−1 flow of nitrogen for 40 min and only then opened. A black product was formed on both sides of the Mo substrate. Samples for TEM analysis were prepared either by gently rubbing the TEM grid against the substrate, scratching the surface with a spatula and touching the spatula on the TEM grid or by sonicating the substrate (whole or piece-wise) in ethanol and dripping the resulting suspension on the grids.
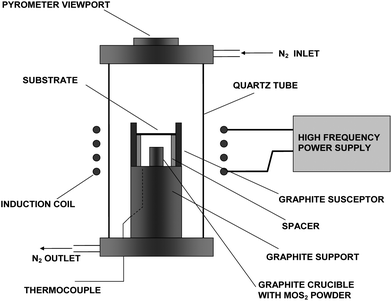 | ||
| Fig. 1 Schematics of the induction furnace set-up. | ||
Characterization of the product was performed mainly by using various electron microscopy techniques. The instruments which were used for the analysis include: a scanning electron microscope (Zeiss LEO Supra 55VP FEG SEM), a transmission electron microscope (Philips CM120 TEM), equipped with an EDS detector (EDAX); a high resolution transmission electron microscope with a field emission source (FEI Technai F30 HRTEM), equipped with a parallel electron energy loss spectroscopy (EELS) spectrometer (Gatan imaging filter-GIF (Gatan)). Complementary analyses were carried out by powder X-ray diffraction (XRD), X-ray photoelectron spectroscopy (XPS) and electron diffraction (ED).
XRD examination (Fig. 2) was carried out on the substrate coated with the product. As expected, the most prominent peaks belong to the metallic molybdenum of the substrate. The XRD pattern reveals the diffraction lines of hexagonal Mo2C and molybdenum subsulfide (Mo2.06S3). No evidence for MoS2 could be obtained from the XRD pattern. Presumably the molybdenum subsulfide forms by a reaction between the metallic molybdenum of the substrate and the MoS2 vapor.
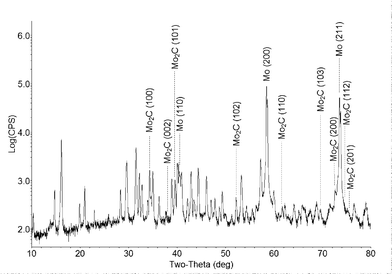 | ||
| Fig. 2 X-ray diffraction pattern of the substrate with the reaction products (Cu-Kα irradiation). Reflections of Mo and Mo2C are indexed, and the rest of the peaks (unindexed) belong to the Mo2.06S3 phase. | ||
SEM examination of the substrate surface revealed that the product consists of nanoparticles of assorted shapes in the size range of 10–1000 nm, as well as elongated structures of 1–7 μm long (Fig. 3). Much of the deposited material contains microscopic molybdenum carbide coated with a few layers of, usually discontinuous MoS2. Nonetheless, a minor amount of what appears to be nanoparticles and elongated nanostructures was clearly observed. To better understand the nature of these nanoparticles TEM analysis was used.
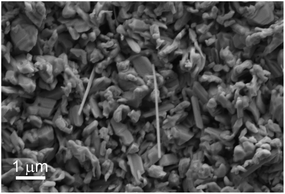 | ||
| Fig. 3 SEM image of the reaction product. | ||
TEM examination of the nanostructures revealed their core–shell nature. Fig. 4 shows the TEM micrograph of a MoS2 closed-cage nanoparticle encapsulating the molybdenum carbide single crystal core. On the top right, there is a line profile of the selected area. The measured spacing of ∼0.62 nm is consistent with (002) crystallographic planes of MoS2. The diffractogram of the particle shows the single-crystal pattern of hexagonal Mo2C (β-Mo2C, d100 = 0.26 nm, d110 = 0.15 nm) viewed down the [001] zone axis alongside with the 002 reflections (d = 0.62 nm) associated with the crystal structure of the encapsulating MoS2.
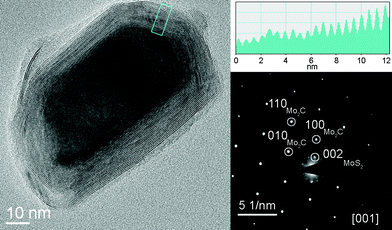 | ||
| Fig. 4 TEM image of a Mo2C@MoS2 core–shell nanoparticle found on the substrate surface. The line profile of the selected area on the MoS2 coating is shown on the top right. The ED pattern (bottom right) clearly shows the reflections of the hexagonal pattern of the Mo2C core and the MoS2 layers coating the carbide core. | ||
EDS and EELS analysis confirmed the presence of Mo, S and C, with sulfur to carbon ratios ranging from 1![[thin space (1/6-em)]](https://www.rsc.org/images/entities/char_2009.gif) :1 to 1:9 on different nanoparticles.
:1 to 1:9 on different nanoparticles.
The elongated nanostructures observed in the SEM were also analyzed by TEM. This analysis revealed that while some of the elongated nanoparticles were actually molybdenum sulfide or molybdenum carbide nanowhiskers, at least 30% among these elongated nanostructures were actually made of MoS2 nanotubes encapsulating the Mo2C core. Fig. 5 shows several carbide-filled MoS2 nanotubes accompanied by several fullerene-like particles as obtained by energy filtered transmission electron microscopy (EFTEM) analysis performed in the F30 HRTEM. On top from left to right: sulfur map, carbon map and false-color image produced by overlapping the two maps. It is evident that sulfur is present only at the outer shells of the tubes and the interior material is carbon-rich. In Fig. 6 the HRTEM image of the continuous interface suggests epitaxial growth of MoS2 on Mo2C in limited number of interface zones of this core–shell nanotube. The similarity between the hexagonal lattices allows for the epitaxy to occur along more than one crystallographic direction, enabling the ultimate coverage of the carbide by the sulfide. In Fig. 6, the (100) spacing of MoS2 (d = 0.273 nm) coincides with the (100) spacing of Mo2C (d = 0.26 nm), but similar seamless growth along other directions was observed as well (see for example Fig. 4 where such growth can be observed on at least three of the facets of the encapsulated crystal). The almost perfect interface coincidence may be of outmost importance when 1D superconductivity is considered.
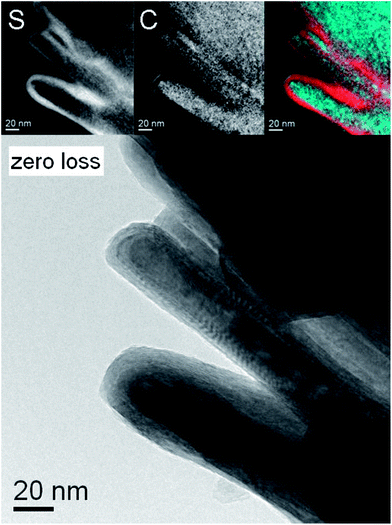 | ||
| Fig. 5 Energy-filtered TEM analysis of the core–shell nanotubes. Top from left to right: sulfur map, carbon map and false-color image produced by overlapping the two maps (red – sulfur, blue – carbon), bottom: zero-loss image. | ||
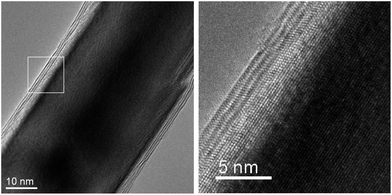 | ||
| Fig. 6 HRTEM images of multiwall MoS2 nanotube coating a Mo2C core. Note the almost perfect matching between the two lattices at the interface in the enlargement image on the right. | ||
Combining the information from the XRD pattern and the electron microscopy suggests that the molybdenum subsulfide (Mo2.06S3) is formed between the molybdenum substrate and the encapsulated MoS2–Mo2C structures formed on the outer surface. This is further confirmed by differences in the TEM samples which were collected from the substrate surface using several different techniques. Using the technique of rubbing the TEM grid against the substrate surface resulted in more than 90% of the collected particles being molybdenum carbide partially or completely encapsulated by the MoS2 layers. In grids prepared from the sonicated specimen, a much more non-encapsulated sulfur-rich material was present. Whilst the rubbing affects only the surface, sonication releases material also from deeper layers of the coating, which are presumably rich in Mo2.06S3.
The route to the formation of the encapsulated structures is suggested below. Upon heating, MoS2 is sublimed (sublimation onset circa 1050 °C (ref. 22)) and present in the gas phase in the volume of the heated zone. In addition, molybdenum trioxide and molybdenum dioxide from the substrate surface both decompose at temperatures above 1100 °C and a small amount of oxygen is released to the reaction volume. The oxygen can recombine with the carbon vapor (originated from the crucible and the susceptor) to form CO. In this temperature range, the CO2 formation process is subject to a less negative free energy change compared with CO formation, thus, CO predominates at high temperatures. CO, in its turn, reacts with MoS2 to give Mo2C:23
| 2MoS2 + 6CO → Mo2C + 4COS + CO2 |
Mo2C, having high melting temperature (2687 °C (ref. 24)), solidifies on the substrate and probably also as small clusters and whiskers in the gas phase. Upon cooling, MoS2 condenses to provide the concentric shells surrounding the Mo2C nanocrystals. Future studies will aim at increasing the yield of the core–shell nanotubes and nanoparticles. The increased yield will allow elucidating their physical properties and studying the superconducting behavior of the molybdenum carbide core, in particular.
In conclusion, Mo2C nanocrystals encapsulated in MoS2 nanoparticles and nanotubes were produced by high-temperature carbothermal reaction. The synthesis of this phase may open new possibilities in the investigation of properties of quasi-1D superconductors. In addition, this composite phase may prove advantageous in certain lubrication, structural and catalytic applications. The use of a high temperature induction furnace with a gas flow system opens up many opportunities for the synthesis of new nanomaterials, in particular from refractory metals such as Nb, Ta and others.
Acknowledgements
The authors would like to thank WIS Engineering & Instrumentation Branch and Dr Leonid Odnopozov for help with induction furnace construction, Dr Yishay (Isai) Feldman for XRD and Dr Tatyana Bendikov for XPS analyses. This research was supported by the ERC grant INTIF 226639; the Israel Science Foundation; The Harold Perlman Foundation and the Irving and Azelle Waltcher Endowed Research Fund in honor of Prof. Moshe Levy. The Irving and Cherna Moskowitz Center for Nano and Bio-Nano Imaging is also acknowledged. RT is the Drake Family Chair in Nanotechnology and director of the Helen and Martin Kimmel Center for Nanoscale Science.References
- J. Sloan, J. Cook, M. L. H. Green, J. L. Hutchison and R. Tenne, J. Mater. Chem., 1997, 7, 1089–1095 RSC.
- M. Monthioux, E. Flahaut and J. P. Cleuziou, J. Mater. Res., 2006, 21, 2774–2793 CrossRef CAS.
- S. F. Yang, F. P. Liu, C. B. Chen, M. Z. Jiao and T. Wei, Chem. Commun., 2011, 47, 11822–11839 RSC.
- K. C. Hwang, J. Phys. D: Appl. Phys., 2010, 43, 374001/1–374001/13 CAS.
- S. Y. Hong, R. Kreizman, R. Rosentsveig, A. Zak, J. Sloan, A. N. Enyashin, G. Seifert, M. L. H. Green and R. Tenne, Eur. J. Inorg. Chem., 2010, 27, 4233–4243 CrossRef.
- M. Terrones, W. K. Hsu, A. Schilder, H. Terrones, N. Grobert, J. P. Hare, Y. Q. Zhu, M. Schwoerer, K. Prassides, H. W. Kroto and D. R. M. Walton, Appl. Phys. A: Mater. Sci. Process., 1998, 66, 307–317 CrossRef CAS.
- Y. Saito, Carbon, 1995, 33, 979–988 CrossRef CAS.
- Y. Saito, T. Matsumoto and K. Nishikubo, J. Cryst. Growth, 1997, 172, 163–170 CrossRef CAS.
- Y. Saito, T. Masumoto and K. Nishikubo, Carbon, 1997, 35, 1757–1763 CrossRef CAS.
- R. Tenne, Nat. Nanotechnol., 2006, 1, 103–111 CrossRef CAS.
- Y. Feldman, G. L. Frey, M. Homyonfer, V. Lyakhovitskaya, L. Margulis, H. Cohen, G. Hodes, J. L. Hutchison and R. Tenne, J. Am. Chem. Soc., 1996, 118, 5362–5367 CrossRef CAS.
- A. Rothschild, J. Sloan, A. P. E. York, M. L. H. Green, J. L. Hutchison and R. Tenne, Chem. Commun., 1999, 4, 363–364 RSC.
- G. F. Hardy and J. K. Hulm, Phys. Rev., 1954, 93, 1004–1016 CrossRef CAS.
- N. Morton, B. W. James, G. H. Wostenholm, D. G. Pomfret, M. R. Davies and J. L. Dykins, J. Less-Common Met., 1971, 25, 97–106 CrossRef CAS.
- T. Y. Velikanova, V. Z. Kublii and B. V. Khaenko, Sov. Powder Metall. Met. Ceram., 1988, 27, 891–896 CrossRef.
- N. Giordano, Phys. B, 1994, 203, 460–466 CrossRef CAS.
- D. E. McCumber and B. I. Halperin, Phys. Rev. B: Solid State, 1970, 1, 1054–1070 CrossRef.
- D. S. Golubev and A. D. Zaikin, Phys. Rev. B: Solid State, 2001, 64, 014504/1–014504/14 CrossRef CAS.
- A. Johansson, G. Sambandamurthy, D. Shahar, N. Jacobson and R. Tenne, Phys. Rev. Lett., 2005, 95, 116805/1–116805/4 CAS.
- S. Eijsbouts, S. W. Mayo and K. Fujita, Appl. Catal. A, 2007, 322, 58–66 CrossRef CAS.
- E. Furimsky, Appl. Catal. A, 2003, 240, 1–28 CrossRef CAS.
- P. Cannon, Nature, 1959, 183, 1612–1613 CrossRef CAS.
- P. S. Rao, T. R. Mankhand and P. M. Prasad, Mater. Trans. JIM, 1996, 37, 239–244 CAS.
- CRC Handbook of Chemistry and Physics, ed. D. R. Lide, CRC Press, Boca Raton, 84th edn, 2003–2004, section 4, p. 70, table entry number 1456 Search PubMed.
| This journal is © The Royal Society of Chemistry 2013 |