 Open Access Article
 This Open Access Article is licensed under a
 Creative Commons Attribution 3.0 Unported Licence
Mechanism of action-based classification of antibiotics using high-content bacterial image analysis†
Kelly C.
Peach
a,
Walter M.
Bray
b,
Dustin
Winslow
c,
Peter F.
Linington
d and
Roger G.
Linington
*a
aDepartment of Chemistry and Biochemistry, University of California Santa Cruz, 1156 High Street, Santa Cruz, CA 95064, USA. E-mail: rliningt@ucsc.edu
bUniversity of California Santa Cruz Chemical Screening Center, 1156 High Street, Santa Cruz, CA 95064, USA
cDepartment of Earth and Planetary Sciences, University of California Santa Cruz, 1156 High Street, Santa Cruz, CA 95064, USA
dSchool of Computing, University of Kent, Canterbury, Kent CT2 7NF, UK
First published on 23rd April 2013
Abstract
Image-based screening has become a mature field over the past decade, largely due to the detailed information that can be obtained about compound mode of action by considering the phenotypic effects of test compounds on cellular morphology. However, very few examples exist of extensions of this approach to bacterial targets. We now report the first high-throughput, high-content platform for the prediction of antibiotic modes of action using image-based screening. This approach employs a unique feature segmentation and extraction protocol to quantify key size and shape metrics of bacterial cells over a range of compound concentrations, and matches the trajectories of these metrics to those of training set compounds of known molecular target to predict the test compound's mode of action. This approach has been used to successfully predict the modes of action of a panel of known antibiotics, and has been extended to the evaluation of natural products libraries for the de novo prediction of compound function directly from primary screening data.
Introduction
Despite the growing percentage of antibiotic-resistant bacterial pathogens isolated from hospitals, campaigns for the development of novel drug leads to remedy these infections are failing to produce sufficient leads to combat this public health crisis. This shortfall is not due to lack of effort by screening programs, which have now screened hundreds of thousands of small molecules for antibacterial activity.1 Unfortunately, useful compound yields from these campaigns have been low, and the number of major pharmaceutical companies involved in antibiotic drug development is steadily declining. These problems are exacerbated by the technical difficulty and time investment required to bring a novel antibiotic to market. Furthermore, the relatively low financial return on investments in this area compared to development in other disease areas has led to a significant corporate withdrawal from the field, leaving the discovery landscape bleak.2Both whole cell and pure enzyme assays have seen widespread use in antibiotic discovery programs. Pure enzyme assays are popular because they provide direct information regarding molecular targets, though challenges often arise in translating these hits to validated lead compounds; in particular, compounds can suffer from issues of permeability and/or target selectivity in whole cell secondary screens.3 Alternatively, whole cell assays provide hits that are active in their physiological context, but the lack of mechanistic information afforded by whole cell screens often means that lead compounds either hit targets with extensive existing drug coverage, or are nonspecific nuisance compounds with little pharmaceutical relevance. The time and energy required to filter these hits to find promising lead compounds for further development significantly hinders this approach.
The recent development of image-based phenotypic whole cell screening offers a third approach to primary screening. By acquiring images of test cells, and using these to interrogate elements of phenotype variation, image-based screening allows information about the target to be inferred at the primary screening stage, which in turn provides a mechanism for informed triage decisions before committing a large time and resource investment to specific molecules.4 Although this technology is widely used for mammalian cells there are currently no phenotypic platforms for examining bacterial systems under high-throughput conditions. This is largely because bacterial visualization requires magnifications that are not compatible with existing high-throughput imaging technologies.
A significant proportion of the antibiotics to reach the market in recent years have been analogues of existing scaffolds.5 Although these compounds remedy the immediate need for antibiotic development by incremental improvements in scope or potency, they inevitably suffer from many of the same underlying resistance mechanisms of their predecessors, and are therefore of only modest value in the wider context of controlling the emergence and spread of drug-resistant pathogens.1 Although unproven, the possibility of using high-content screening (HCS) to find compounds with unique mechanisms is an exciting new avenue for antibiotic discovery. This type of technology and mechanism-based profiling opens up the potential to approach antibiotic drug discovery from a different perspective. We hypothesized that the development of image-based profiling technologies for bacterial systems would permit the direct assignment of mechanism of action to antibiotic lead compounds from primary screening data, and would provide a new approach to the discovery of novel lead compounds. To examine this hypothesis we have developed a bacterial imaging platform, and created new software tools to explore the potential for using bacterial image-based screening for antibiotic discovery.
There is clearly a need for novel screening methods to address the challenges associated with antibiotic drug discovery. By developing novel image analysis technologies we have created a phenotypic profiling screening platform for the direct annotation of drug function from primary screening data, and applied this methodology to the characterization of a natural products library to examine the validity of this approach for clustering drug leads from natural sources.
Results and discussion
Bacterial image-based screening platform
We recently reported the development of a 384-well, high-throughput image-based screen using GFP-tagged Vibrio cholerae to directly observe and quantify biofilm formation in response to treatment with compound libraries.6 This system uses an epifluorescence microscope to capture images at a single focal plane, followed by segmentation of the image and quantification of biofilm regions to directly determine the effect of test compounds on biofilm formation. This platform is one of very few examples of high-throughput imaging systems for bacterial targets, and significantly reduces the time required to collect data for 384-well plates compared with the confocal or electron microscopy techniques traditionally used for this type of study.Concentration-dependent morphological changes in response to antibiotic treatment have been well documented.7 Previous reports have examined the effects of treatment of bacterial cells with varying concentrations of FDA-approved antibiotics, and provided formal descriptions of the resulting phenotypes.8,9 These studies were accomplished with either electron microscopy or differential interference contrast microscopy; techniques that are both low throughput and executed at far higher resolution than is possible with the fluorescence microscope available for the screen described in this study. Regardless of these differences, we found that the phenotypes observed from our HCS platform (Fig. 1) closely resembled those described in the literature.
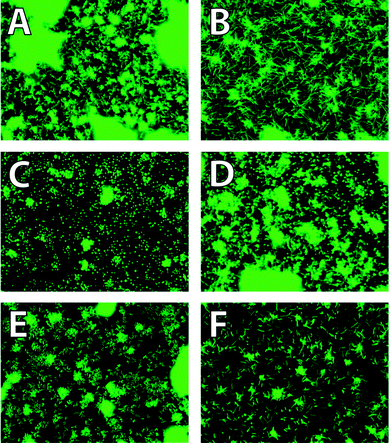 | ||
| Fig. 1 Fluorescence images displaying unique phenotypes with treatment of sub-lethal doses of antibiotics against V. cholerae (A) DMSO negative control, (B) ‘filament’, 12 nM ciprofloxacin (C) ‘spheroplast’, 2 mM ceftazidime, (D) ‘spherorod’, 25 μM ceftazidime, (E) ‘cobblestone or raspberry’, 0.8 μM tetracycline, (F) ‘ovoid’, 0.1 μM ciprofloxacin. | ||
Because a number of distinct morphological alterations were observed, we postulated that these phenotypes could be correlated to the mechanisms of action for antimicrobial compounds. It is well documented that the morphological changes observed resulting from antimicrobial agents targeting cell-wall synthesis correlate well with their mechanism of action.9 Findings have also confirmed that, regardless of their precise targets, compounds shown to disrupt protein synthesis exhibit very similar cell surface disruptions.10 Observation of morphological alterations matching reported phenotypes in other Gram-negative organisms therefore prompted the investigation of the antimicrobial action of test compounds against V. cholerae using the imaging platform described above.
Fig. 1 shows the relevant morphological phenotypes observed using our screening platform. In total, five distinct phenotypes were recognizable and differentiable using the system described below. Fig. 1A shows the typical morphology of cells treated with DMSO vehicle control. Fig. 1B contains elongated cells, which are ascribed in the literature to cells which are continuing to grow and initiate new rounds of protein synthesis, yet fail to divide into daughter cells.11Fig. 1C, termed the spheroplast phenotype, features uniformly spherical, punctate cells where the individual cells are distinct, with little neighboring cell overlap. The literature ascribes this morphology to a bacterium whose cell wall has been completely removed and thus the membrane tension causes the spherical shape.12Fig. 1D displays the ‘sphero-rod’ phenotype,9,13 which is a hybrid between the elongated and spheroplast morphologies. In Pseudomonas aeruginosa this phenotype is attributed to the affinity of β-lactam therapeutics to bind two different penicillin-binding proteins. Fig. 1E is termed ‘cobblestone’ or ‘raspberry’14 and contains cells that appear deflated or collapsed due to membrane damage.10Fig. 1F is termed ‘ovoid’, and represents cells that are slightly larger and more elongated than healthy cells.15 This phenotype is coupled with notable decreases in cell coverage indicating significant cell death.
Broadly speaking, most antibiotics target one of three stages of bacterial cell replication: inhibition of ribosomal function, disruption of cell wall biosynthesis, or inhibition of DNA synthesis.16,17 Within these target classes there are numerous specific targets and binding sites. The compounds chosen for the training set cover each of these three stages and include a number of different targets within each class. To prepare these materials for screening, each compound was arranged as a 2-fold serial dilution, beginning at the highest soluble concentration in DMSO and continuing to concentrations well below the reported MIC values against V. cholerae for visual evaluation in the high-throughput screening platform.
The strain of V. cholerae used for this screen is a mutant in which the genes responsible for the production of c-di-GMP, a small molecule whose production has been shown to promote biofilm production, are constitutively expressed. Use of this strain is essential to the study, as cellular adherence to the screening plate is required for downstream imaging. However, because biofilm formation is capable of reducing antibiotic efficacy by 10–1000-fold, not all antibiotic classes were effective against this strain at accessible concentrations.
Of the compounds targeting cell wall biosynthesis, we found the penicillins and cephalosporins were able to inhibit cell growth and exhibit an appreciable phenotype. Within the class of compounds inhibiting translation, the tetracyclines, the peptidyl transferase inhibitors, and the macrolides showed valuable activities. Finally, of the DNA synthesis inhibitors, the fluoroquinones, nitrofurans, aminocoumarins, and novobiocin displayed notable activities. Each of the active compounds displayed phenotypes for at least three of the tested concentrations, and many showed morphological variations over the entire dilution series. The remaining compounds lacked the efficacy required at an achievable concentration to be useful for the development of our screening platform.
Visual inspection of the concentration-dependent phenotypes clearly identified three distinct phenotypic trajectories, which correlated well with the three major classes of drug action for the antibiotics in the training set: protein synthesis, DNA synthesis and cell wall biosynthesis. The active protein synthesis inhibitors are presented in Table 1. At low concentrations, the cell surface for treated bacteria appear wrinkled or deflated (Fig. 1E), indicative of loss of intracellular contents through lytic points in the cell wall.18 As the concentration increases, cells begin to separate, and cell size decreases, leading ultimately to cell death.
| Antibiotic class | Antibiotic name | Primary target |
|---|---|---|
| Cell wall synthesis inhibitors/disruptors | ||
| β-Lactams | Penicillins [piperacillin, carbenicillin, ampicillin, penicillin G, cloxacillin] | Penicillin-binding proteins |
| cephalosporins [cefadroxil, cefaclor, ceftazidime] | ||
| Lipopeptides | Polymyxin B | Disruption of inner and outer membranes through binding to lipopolysaccharide (LPS) in the outer membrane |
| Others | Alafosfalin | Peptidoglycan units terminal D-Ala-D-Ala dipeptide |
| Bacitracin | C55-isoprenyl pyrophosphate | |
| D-Cycloserine | D-Alanine ligase and alanine racemase | |
| Fosfomycin | UDP-N-actetylglucosamine-3-enolpyruvyltransferase | |
| DNA synthesis inhibitors | ||
| Fluoroquinolones | Nalidixic acid, ciprofloxacin, levofloxacin, sparfloxacin, norfloxacin | Topoisomerase II (DNA gyrase), topoisomerase IV |
| Sulfonamides | Sulfamethazine, sulfapyridine, sulfamethoxazole, sulfadiazine, sulfamerazine | Competitive inhibitor for DHPS involved in folate synthesis |
| Others | Novobiocin | DNA gyrase |
| RNA synthesis inhibitors | ||
| Rifamycins | Rifampicin, rifabutin, rifaximin | DNA-dependent RNA polymerase |
| Protein synthesis inhibitor | ||
| Tetracyclines | Oxytetracycline, doxycycline, tetracycline, demeclocycline, minocycline | 30S ribosome (inhibit aminoacyl tRNA binding to ribosome) |
| Aminoglycosides | Tobramycin, gentamicin, amikacin, streptomycin, spectinomycin | 30S ribosome (mistranslation by tRNA mismatching) |
| Macrolides | Erythromycin, clarithromycin, midecamycin, roxithromycin, spiramycin, azithromycin | 50S ribosome (stimulating dissociation of the peptidyl-tRNA molecule from the ribosomes during elongation) |
| Amphenicols | Chloramphenicol, thiamphenicol, florfenicol | 50S ribosome (inhibit elongation step) |
| Lincosamides | Clindamycin, lincomycin | 50S ribosome (stimulate dissociation of the peptidyl-tRNA molecule from the ribosomes during elongation) |
| Pleuromutilins | Tiamulin | 50S ribosome (prevent correct positioning of the CCA ends of tRNA for peptide transferase) |
| DNA replication (intercalators) | ||
| Anthracyclines | Doxorubicin, epirubicin, idarubicin | Intercalate DNA/RNA strand and topoisomerase II |
| Others | Actinomycin D | Intercalates G–C base pairs and minor groove DNA at the transcription initiation complex |
| Mithramycin | Intercalates GC-rich DNA strands | |
| Tetracenomycin | Intercalates DNA | |
| Anaerobic DNA inhibitors | ||
| Nitrofurans | Furazolidone, nitrofurantoin | Highly reactive reduced form (by nitrofuran reductase) |
| Nitro-imidazole | Ornidazole | Damages bacterial DNA |
Both the compounds that effect DNA synthesis and those that disrupt cell wall biosynthesis have more complex phenotype trajectories. The DNA synthesis disruptors cause the formation of very long, slender fibrils at low concentrations (Fig. 1B). As the concentration increases, these elongated cells begin to shorten and widen (Fig. 1F) until they reach the ‘ovoid’ phenotype. At low concentrations, cell wall biosynthesis inhibitors also form slender elongated fibril-like cells that share strong phenotypic similarity to those from DNA synthesis inhibitors (Fig. 1B). However, as the concentration of cell wall biosynthesis inhibitors increases a unique ‘sphero-rod’ phenotype develops (Fig. 1D), and eventually the spheroplast character of the cells overshadows the elongated morphology leaving only sparsely scattered, uniformly round punctate cells that are unique to this compound class (Fig. 1C).
The imaging data acquired for this training set allowed us to clearly delineate distinct morphological, concentration-dependent responses for each class of antibiotics. However, outside visual inspection, we lacked the tools to evaluate and score the phenotypes and their transitions through the course of a dilution series in order to bin them into separate categories. Even for the small training set described here, image analysis generates 2560 images per screening plate, making manual annotation an unrealistic strategy. Furthermore, manual annotation is taxing, given that phenotypes transition gradually from one to the next, making unequivocal assignment of specific phenotypes challenging for human operators. To overcome these issues we elected to develop an image analysis platform for characterizing bacterial phenotypes, and to apply this tool to the automatic mode of action prediction for unknown antibiotics from our marine natural products library.
Development of bacterial image analysis software platform
Unlike image-based screens for mammalian cells, even the highest magnifications possible using high-throughput imaging systems (typically 40×) are not sufficient to permit the straightforward annotation of individual bacterial cells using standard software tools. Bacterial cells are approximately 10 times smaller in size than eukaryotic cells; typically 0.5–5.0 μm in length. In addition, bacterial cells frequently associate closely together in three-dimensional assemblages, rather than forming confluent monolayers like many eukaryotic cell lines. The challenges in investigating phenotypic variations were therefore to design an image analysis tool capable of distinguishing and interpreting the faint intertwined monolayer of cells surrounding the prominent biofilm macrocolonies in our images at 40× magnification, and to generate relevant metrics from this enhanced image to differentiate concentration-dependent morphological changes for these cells.Examining the background detail in screening images is a challenge for most existing image analysis software tools. Because these features are small and cytoskeletal elements are typically not distinguishable at these magnifications, many of the commonly used discriminators do not apply. In addition, the overall shapes of these bacterial cell colonies are non-standard with respect to the geometries of eukaryotic cells, meaning that new metrics are required to accurately quantify and differentiate colony and single cell phenotypes, as seen in Fig. 1. Finally, given that the image-based screening for this project was performed with a bacterial strain capable of forming large biofilm colonies in the microtiter plates, removal of bright heterogeneous biofilm microcolonies that overshadow the surrounding cells was required, providing an additional hurdle for the design of the analysis tool. A bespoke suite of analysis software was therefore created to address these challenges and provide a quantitative set of measurements that differentiate bacterial phenotypes for hit classification and triage.
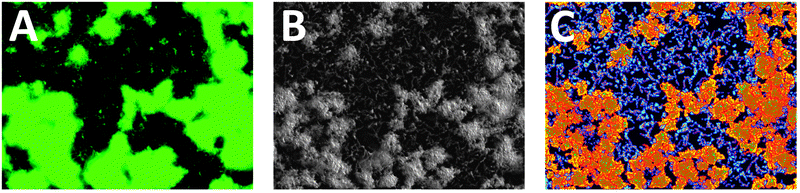 | ||
| Fig. 2 Analysis software image output. (A) Raw GFP fluorescence image of WT V. cholerae after 50 μM treatment with nitrofurantoin, a DNA damaging agent, (B) enhanced image generated, (C) analyzed image generated (colors and boundaries illustrate measurements required for metric calculation). | ||
The second step is the extraction of relevant individual features from the baseline corrected image. These features correspond to individual cells and intertwined masses of cells. A list of features is constructed by examining the image pixels in order of decreasing intensity. If none of a pixel's eight nearest neighbors have so far been included in a feature, it is used as the starting point of a new feature, and is added to the feature list. If the nearest neighbors include pixels from just one feature, the new pixel is added to that feature. If the pixel has neighbors from two different features, a decision has to be made. If either of the neighboring features is very small, or starts from a peak value close to the intensity value at the saddle point just detected, the features are merged and the list shortened. Otherwise the pixel is assigned to the most strongly connected of the features it touches. Using this approach, the most intense pixels are used as ‘nucleation sites’, and new features grow outwards from these starting points until they either reach very low pixel intensities, in which case the process stops, or they touch up against other growing features, in which case either features are combined as above, or a boundary between them develops.
The next step is to identify different populations within the list of features. The features are sorted on the basis of their intensity and a plot made of the logarithm of the intensity against rank in the ordered list. This plot shows distinct linear regions for biofilm features and background features, and features from these regions are processed separately. One group represents the individual bacterial cells and assemblages, which we have termed the background features. These features are colored cyan in the analyzed image, as can be seen in Fig. 2C. Metrics calculated for features of this type have names starting with the string ‘bottom’. The other group contains the biofilm microcolonies distinct from the background cells. Biofilm regions are colored yellow and metrics calculated for these areas have names starting with ‘top’. These two regions of features and the calculation of their corresponding metrics are treated independently, resulting in separate sets of metrics from the biofilm and non-biofilm regions of the image. Metrics are also calculated from the bare regions between the features.
Apart from the global metrics, values are evaluated for the features one at a time and then an ensemble average calculated from all these values to form the final metric. Separate values are calculated for top and bottom features and for the background regions between features. In total, 43 metrics are recorded for each image. Some of the shape-dependent metrics are based on the angular or radial distribution functions for the individual features, taking the centroid of the intensity as origin. For example, the angular distribution allows the number of maxima (arms) to be counted, and the mean difference between maxima and minima gives a mean angular variation. These calculations require pixels involved in a feature to be classified as either ‘boundary’ or ‘interior’.
Many of the features of interest possess branching, linear or network forms. To distinguish these, an additional marking process is used. A copy of the feature is made and pixels are discarded from it one at a time, starting with the dimmest. However, if removing a pixel would partition the feature, the pixel is retained and marked as part of the feature's skeleton. The result is strongly shape dependent; for a roughly circular feature, there is often only one central pixel to be marked, but for a linear feature, an extended crest-line remains. For more complex shapes, the skeleton may form a network around local minima (isolating regions we refer to as marrow). The mean fraction of skeleton and marrow points are both useful metrics for quantifying feature structure.
Full definitions of these metrics are presented in the ESI,† however because back interior count and bottom mean angular variation provided the most valuable information in terms of differentiating phenotypes their definitions are presented in detail here. Back interior count is the total number of interior pixels in the background features divided by the total number of pixels in the image (i.e. the fraction of the image classified as background interior). This global metric is a good indicator of background cell density, providing indirect information regarding the degree of cell survival, but also providing insight into the degree of surface coverage of cell aggregates at lower concentrations of antibiotics.
Mean angular variation is a more complex metric that is calculated in two stages. This first requires the calculation of the smoothed angular distribution for each feature. The angular distribution of a feature is determined by examining all pixels (interior and boundary) of a feature and building a histogram of intensity values distributed by the angle from the center of gravity to the pixel concerned (measured from the top of the image). The intensity value used is taken relative to the minimum value in the feature. This distribution is generally rather noisy, so it is smoothed to retain only significant peaks. This is done for all the background cell or ‘bottom’ features (designated by the color cyan in Fig. 2C). The metric for each individual feature is calculated by dividing the lowest trough value in the distribution by the highest peak. The overall metric value for the image is the unweighted average of the individual values over all the bottom features. This metric indicates the degree of variation of the radial size of the feature as a function of direction. This allows for strong differentiation between the elongated cell morphology of the fibril phenotype and the spheroplast phenotype, which has a nearly uniform angular distribution.
Evaluation of bacterial phenotypes using known antibiotics
The image results from the screening of the antibiotic training set dilution series were analyzed using the described software. When the back interior count metric was plotted against the bottom mean angular variation metric, the training set data partitioned into three visually distinct groups (Fig. 3). Examination of this plot reveals that each clustered trajectory consists exclusively of antibiotics belonging to one of the three core mechanisms of action described above (disruption of cell wall biosynthesis, protein synthesis, and DNA synthesis). This encouraging qualitative evaluation of the image analysis platform confirmed two key questions surrounding this project, and provided strong encouragement for further examination of these data. Firstly, the separation of compounds by mode of action confirmed our original hypothesis that the observed phenotypes were mechanism-dependent. Secondly, binning of these compounds by mechanism using the image analysis platform indicated that the designed metrics were capable of accurately quantifying phenotypes that we had originally identified by eye using qualitative descriptors.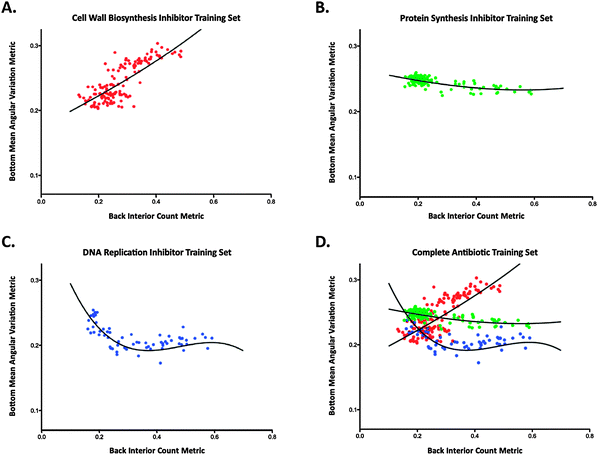 | ||
| Fig. 3 Metric plots displaying antibiotic training set data with model fits. (A) Cell wall biosynthesis inhibitor training set, (B) protein synthesis inhibitor training set, (C) DNA synthesis disrupter training set, and (D) combined training sets. | ||
In order to be of value as a quantification tool for compounds of unknown function, it was necessary to develop a statistical method for comparing the fit of metrics for dilution series of unknown compounds with those of the known antibiotic training set. To this end, these three groups were modeled using third order polynomials to generate fit lines for each mechanistic class (Fig. 3). These fits were generated using a total least squares method, which minimizes residuals in both metrics while calculating the model fit for each compound series.19 Points with a back interior count above 0.7 and a bottom mean angular variation below 0.15 were excluded while generating model fits because the image analysis platform does not generate useful data at the extremely low cell densities encountered at these ranges. The drug concentrations required to cause this level of bacterial clearance represent almost complete cell death, and therefore fail to contribute significant phenotypic responses.
The patterns and model fits displayed in these plots illustrate that broad antibiotic action can be directly assigned by the phenotype trajectory through the metric plots. Thus, using an antibiotic training library our screening platform is capable of classifying broad drug action of individual antibiotics based on these discrete whole-cell phenotypes.
Classification of antibiotic leads from natural product extracts
The antibiotic training set results showed that our image-based system was capable of elucidating antibacterial modes of action. In order to address whether this system would be appropriate for discovery and annotation of unknown compounds we evaluated a subset of our marine natural product extract library for the presence of antibiotics. Because natural products extracts are typically complex mixtures containing multiple constituents, we first examined the ability of this system to predict the mode of action for an extract containing a known antibiotic, using a bacterial type strain known to produce the protein synthesis inhibitor tetracycline. A liquid culture of Streptomyces aureofaciens (ATCC 10762) was extracted and fractionated into six prefractions using our standard extraction protocol (ESI†), and 2-fold dilution series of each prefraction were screened and imaged as described above.Image analysis for the prefraction dilution series revealed one prefraction (fraction C), with strong antibiotic activity. Calculated metrics for this prefraction were compared to each model fit line to determine whether the active constituent from this prefraction matched any of the three classes of modes of action from the training set (Fig. 3). In order to quantify this phenotype match, a goodness of fit value (FG) was calculated based on the fit of the dilution series metric values to model fit lines for each compound class from the training set. These values are reported as FG = (1 − σ), where σ is the standard deviation of residuals from each fit line as calculated by the total least squares method.
The FG value for the S. aureofaciens prefraction indicated that this prefraction most closely aligned with the model fit for protein synthesis inhibitors. Tetracycline is known to bind the 30S subunit of the bacterial ribosome, ultimately leading to inhibition of protein synthesis. Examination of prefraction C by HPLC-MS analysis confirmed the presence of tetracycline (Fig. S5, ESI†), and validated the ability of the platform to profile the MOAs of individual compounds within complex mixtures of natural products.
Marine natural product characterization and discovery
Next, this system was applied to a large natural product library containing 2543 prefractionated extracts from our collection of marine Actinobacteria, with the aim of predicting the modes of action of active constituents from the primary image-based screening, and confirming these predictions through isolation and characterization of active compounds. Screening was accomplished using a two-stage workflow. Initially, primary screening of the entire library at a single high concentration allowed for the identification of extracts that caused either complete cell death or intriguing visual phenotypes. From these results, secondary screening of 90 extracts as 2-fold serial dilutions provided the required series of images for image analysis and FG calculations of the phenotypic trajectories.Results from the secondary screening identified a number of extracts that closely matched either the protein synthesis inhibition or DNA synthesis disruption training set fit lines. To examine the validity of these predictions we selected a subset of these prefractions for further study to identify the active constituents responsible for the observed biological activities. Using a peak library strategy recently implemented in our laboratory,20,21 we created ‘one-compound-one-well’ libraries for four of these prefractions (1498E, 1565D, 1726D, 2001E) using HPLC-MS, and screened these to directly identify the active constituent in each trace (Fig. 4A).
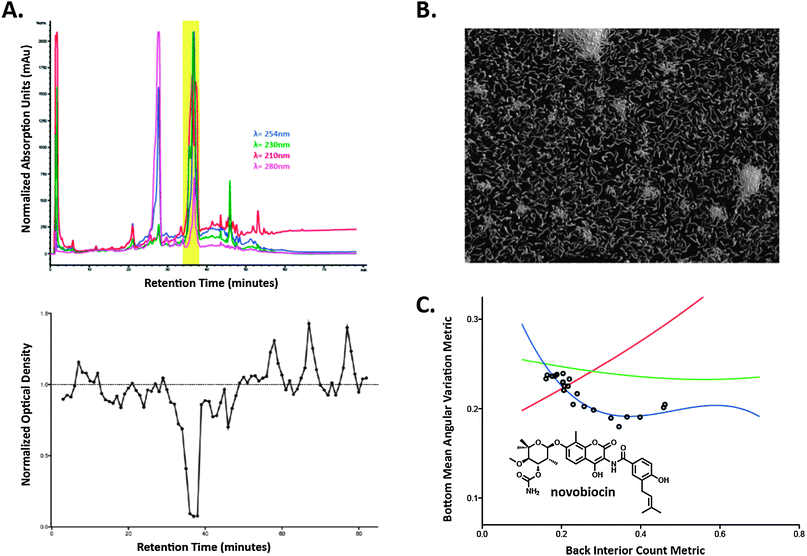 | ||
| Fig. 4 Outline of the discover process for the isolation of novobiocin from 1565D. (A) HPLC trace of the peak library prepared for secondary screening and the activity plot from the secondary screening session of the minutes collected from the peak library, (B) enhanced image of the DNA-damaging morphology from the dilution series of the purified novobiocin, (C) plot of the relevant metrics from screening of both the prefraction 1565D and the serial dilution of purified novobiocin with statistical model fits. | ||
The FG values for prefraction 1565D predicted that the active constituent from this prefraction should exert its antibiotic effect through inhibition of DNA synthesis (Table S1, ESI†). To test this prediction, the active constituent was first identified in the prefraction using a combination of peak library HPLC separation (Fig. 4A, upper trace) and biological screening against V. cholerae (Fig. 4A, lower trace). The antibacterial activity (minutes 36–39) corresponded to a single active peak in the HPLC trace with a distinctive UV absorbance profile. This compound was isolated from a large-scale culture of the producing organism (1 L) by C18 RP-HPLC to afford 4.56 mg of an off-white solid. Mass spectrometric analysis by (+)-HRESITOF indicated an exact mass for this compound of 612.2335, consistent with the molecular formula C31H36N2O11. Mass-based dereplication (Antimarin) identified novobiocin as a candidate structure for this metabolite, which was confirmed by comparison of the 1H NMR data for the purified compound against literature values (Fig. S2, ESI†).22
Novobiocin has been in clinical use registered under the trade name Albamycin since 1956 and is well documented as a DNA gyrase inhibitor,23 which is in agreement with the predicted mechanistic class from the image analysis platform. To verify that novobiocin was indeed responsible for the observed phenotypes from the initial prefraction, pure novobiocin was serially diluted, and re-screened in the HCS platform. Analysis of these images showed that pure novobiocin recapitulated the original activities, based on both its imaging morphology (Fig. 4B) and the concentration trajectory of the analyzed metrics with respect to the training set fit lines (Fig. 4C). Encouragingly, the elongated cell morphology observed for novobiocin in our image-based screen has been previously documented for this compound,24 further verifying that compounds which disrupt DNA processes can cause elongated cellular morphologies.
The FG values for prefractions 1498E indicated that it contained compounds capable of disrupting DNA synthesis (Table S1, ESI†). Investigation of the peak library traces from these prefractions identified a diagnostic UV profile for the anthracycline compound class overlapping with the active region (data not shown). Subsequent HPLC purification and NMR analysis revealed the presence of the known anthracycline derivative cosmomycin D. The structure of this glycosylated aromatic polyketide was confirmed by (+)-HRESITOF-MS and 1D- and 2D-NMR experiments (Fig. S1, ESI†). Cosmomycin D has been shown to cause DNA damage through its ability to intercalate DNA, which is in line with our predictions based on the phenotypic trajectory of this active constituent.
Together, the results from the discovery of novobiocin and cosmomycin D (Fig. 5) show that our mechanism-based antibiotic profiling platform is capable of identifying compounds that disrupt DNA synthesis. Detection of potential DNA damage by the cell is thought to initiate the SOS stress response. The SOS response has been reported to inhibit septation and lead to elongated cellular morphologies, which is likely the cause of the filamentous cells observed in this study.25 This mechanism has also been shown to cause elongation in cells treated with β-lactam therapeutics, which explains why both DNA damaging agents and cell wall biosynthesis disruptors exhibit filamentous phenotypes (Fig. 1B) as components of their dose-dependent phenotype trajectories.
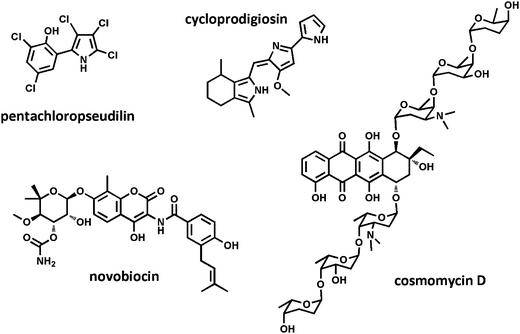 | ||
| Fig. 5 Natural product antibiotics isolated from our microbially-derived extract library. | ||
Both novobiocin and cosmomycin D function by interrupting type II topoisomerases. Type II topoisomerase enzymes control supercoiling DNA in cells by passing a double-stranded segment of DNA through a temporary double-stranded break. However, the means through which they execute this behavior are different. Novobiocin, a member of the coumarin class of antibiotics, inhibits the DNA gyrase B protein GyrB. GyrB functions through ATPase activity, and novobiocin inhibits this activity.26 The mechanism of action for cosmomycin D is complex, but is believed to behave in a mechanism similar to doxorubicin, which binds cleaved dsDNA, creating a DNA–drug–topoisomerase II complex27 that prevents DNA repair via lyases, and leads to cell death. These results indicate that, while this platform is well-suited for predicting modes of action, it is less well-suited for segregating these activities at the molecular level.
The FG values for prefraction 2001E predicted that a component of this mixture was exerting an antibiotic effect through inhibition of protein synthesis (Table S1, ESI†). Peak library screening of this extract identified one active constituent from this compound with a diagnostic UV absorbance in the visible range at λmax of 540 nm. Subsequent large-scale fermentation of the producing organism and purification by C18 RP-HPLC afforded 380 μg of a bright pink solid. (+)-HRESITOF MS measurement afforded an [M + H]+ adduct at m/z 322.1928, consistent with the molecular formula C20H23N3O. Subsequent database searching and comparison of 1H NMR data for this metabolite with reported literature values allow for the assignment of this active component as the known poly-pyrrole containing alkaloid cycloprodigiosin (Fig. S4, ESI†). This highly pigmented compound was originally reported in 198328,29 and is a member of the prodiginine group of compounds, which are known for their broad spectrum of activity as anti-malarials, antibiotics and anti-cancer agents.30 Although a number of studies have reported investigations of prodigiosin's mode of action against eukaryotic cells, there have been few focused studies on the antibacterial mechanism exerted by compounds in this class.31 Prodigiosin and a number of analogues have been reported to uncouple bacterial F-ATPases. The mechanism of ATPase inhibition has yet to be fully elucidated, but our study suggests that either this activity, or a second molecular target, initiates downstream inhibition of protein synthesis.
Finally, the FG values for prefraction 1726D indicated that the metrics from the analyzed images also fit most closely with the protein synthesis inhibitor training set fit line. (Table S1, ESI†). Peak library separation and secondary screening identified a single predominant active peak with a complex and unusual isotope pattern in the LR-ESI quadrupole mass spectrum. This isotope pattern, containing 5 major signals, each separated by two mass units in the ratio 216![[thin space (1/6-em)]](https://www.rsc.org/images/entities/char_2009.gif) :370:228:64:1, was indicative of a multiply halogenated compound containing five chlorine atoms. The exact mass from the (−)-HRESITOF MS, coupled with database searching and comparison of the 1H NMR with published literature values, allowed for the definitive assignment of this compound as the known marine alkaloid pentachloropseudilin (Fig. S3, ESI†).32 Both cycloprodigiosin and pentachloropseudilin (Fig. 5) were rescreened as pure compounds, and displayed mechanisms consistent with those predicted from the prefractions based on their FG values.
:370:228:64:1, was indicative of a multiply halogenated compound containing five chlorine atoms. The exact mass from the (−)-HRESITOF MS, coupled with database searching and comparison of the 1H NMR with published literature values, allowed for the definitive assignment of this compound as the known marine alkaloid pentachloropseudilin (Fig. S3, ESI†).32 Both cycloprodigiosin and pentachloropseudilin (Fig. 5) were rescreened as pure compounds, and displayed mechanisms consistent with those predicted from the prefractions based on their FG values.
Pentachloropseudilin is another pyrrole-based natural product that has been identified as an antibiotic, however to date its mechanism of action has not been reported.32 Pentachloropseudilin has been shown to inhibit myosin ATPase in mammalian cells;33 given that ribosome-dependent ATPases have been identified in other Gram-negative bacteria, including Escherichia coli,34,35 it is possible that the reported ATPase activity of these compounds in other systems is related to the protein synthesis inhibition predicted by our phenotype model. Previous in vitro work with reconstituted ribosomes has shown that protein synthesis is positively correlated with the presence of these ATPases,34 lending support to the hypothesis that inhibition of bacterial ATPases, such as RbbA in E. coli, could result in an endpoint phenotype consistent with protein synthesis inhibition.
Through the image-based screening of dilution series of marine bacterial extracts containing complex mixture of compounds, we have identified a number of pure compounds with antibiotic activities. Two of these compounds, novobiocin and cosmomycin D, were found to follow concentration-dependent morphological phenotypes indicating disruption of DNA synthesis. Previous reports indicate that these two compounds inhibit type II topoisomerases, which is consistent with our evaluation. Tetracycline was found to follow a concentration-dependent morphological phenotype indicative of protein synthesis inhibition. This also matches the reported mechanism for this compound through the binding of the 30S subunit of microbial ribosomes. Finally, we identified both cycloprodigiosin and pentachloropseudilin, which possess activities indicating these compounds cause protein synthesis inhibition. Little is known about the mechanisms of action of these compounds as antibacterial agents, thus in these cases our platform functions as a predictive tool for the broad mechanistic behaviors of these two naturally occurring antibiotics.
The screening platform described herein represents one of the only high-content, high-throughput screens for bacterial cell imaging. The majority of the existing imaging platforms for bacterial targets have been designed to quantify infectivity of intracellular bacteria in mammalian host cells, such as the detection of Mycobacterium tuberculosis inside murine macrophages.36,37 Although morphological features have previously been used to identify compounds with defined modes of action, such as the screening program developed by Merck to identify spheroplast-inducing compounds for their cell wall modulating activities,12 there are currently no available platforms that describe methods for target-independent prediction of drug action from imaging platforms in bacterial cells. This screening platform combines both advances in imaging technology and knowledge of whole-cell phenotypic responses to antibiotics to characterize and quantify concentration-dependent morphological transitions of bacterial cells in the presence of increasing concentrations of test drugs in order to assign broad mechanisms of action based on compound mechanistic class.
This strategy, referred to as ‘cytological profiling,’ is well developed in the screening arena and has been applied broadly to the evaluation of drug action against eukaryotic cell lines. To this end organic dyes, antibodies, nucleic acid probes, and quantum dots have been applied as biological markers for extensive phenotypic characterization.37 These studies have definitively illustrated that compound mechanism of action can be inferred through physiological response of cells. However, studies of this type are not straightforward for bacterial targets cells for a number of reasons. Firstly, bacterial cells do not have discrete organelles for which fluorescent markers have been developed. Secondly, the size and density of bacterial growth has precluded the acquisition of size and shape metrics on individual bacterial cells at the magnifications typically available for high-throughput image-based screening platforms. Finally, because bacterial cells are comparatively small, the fluorescence output from these cells is weak compared to other target organisms. This complicates the image analysis issue because most image analysis tools are designed to identify and segment large bright regions within images, rather than performing analysis of subtle intensity variations across a monolayer of cells, all of which are at similar low pixel intensities.
This screen is the first example of a high-throughput platform that can partition antibiotic lead compounds into different broad mechanistic classes. This has been accomplished through the development and application of novel software analysis technology capable of distinguishing individual cellular morphology from intertwined monolayers of cells. Although a number of individual antibiotic families possess discrete targets within each of these broad activity classes, we were not able to distinguish between compounds that hit different targets within each of these broader classifications. However, the utility of this tool lies in its ability to act as a preliminary screening platform for the broad differentiation of antibacterial action, with further mechanistic questions being addressed using secondary biological screens. Overall the screen is straightforward to perform, requiring no sophisticated staining protocols or expensive reagents, and the image analysis can be executed on any personal computer capable of running Java.
Conclusions and future directions
Using an epifluorescence image-based screening platform we have shown that the antibiotic mechanism of action of unknown compounds against V. cholerae can be correctly predicted using only whole-cell, concentration-dependent, morphological observations. This method has been validated using a broad antibiotic training set containing representative members of many of the classes of current clinically used antibiotics. We have subsequently applied this technology to the prediction of compound modes of action for unknown natural products from both a well-characterized type strain, and prefractions from our marine microbial natural products library, and have shown that this platform can correctly predict compound MOAs, even if no members of that structural class were present in the original pure compound training set.One of the major concerns in antibiotic discovery is the lack of new therapeutic options for treating drug-resistant pathogenic infections. In particular, the absence of antibiotic lead compounds that possess unique molecular targets raises concerns about a return to the pre-antibiotic era, where bacterial infections were a leading cause of death in the general population. This technology is capable of aiding in natural product dereplication by clustering compounds that have known drug targets via our extensive training set and, more importantly, potentially identifying compounds that do not fit these classes, which may act against novel molecular targets. The compound training set is dynamic, meaning that new classes of compounds can be added to expand the range of annotated compounds to include new phenotypes as they are discovered. This tool is therefore open-ended, with the potential to extend our ability to discover new classes of compounds for antibiotic development. This study has illustrated that the creation of more sophisticated analysis software has and will continue to allow access to additional information from high content screening image outputs for a broad range of targets beyond mammalian cells, and that these technologies are likely to play an increasing role in drug discovery and drug development programs in the coming years.
Methods
FDA-approved antibiotics
Training set antibiotics were chosen in order to cover a broad sampling of the existing major classes of clinically used antibiotics. Table 1 lists all the compounds used and their associated targets. Screening plates were generated by serially diluting antibiotics in DMSO (2-fold dilutions, 100 μM to 0.2 nM final testing concentrations). Compounds showing no activity at this highest concentration were re-prepared at higher concentrations for rescreening (concentrations limited only by compound solubility in DMSO). Plates were imaged at 40× magnification and analyzed using the described software.Preparation of type-strain prefractions
Freeze dried pellets of S. aureofaciens (ATCC 10762; tetracycline producer) were revived with ISP Medium 1 (5 g acid-hydrolyzed casein and 3 g yeast extract in 1 L distilled water) according to the recommended protocol. Large-scale cultures were fermented, extracted, and prefractionated using the standard protocol established for preparation of the marine natural product prefraction libraries (ESI,† Methods) using ISP Medium 1 as the large-scale fermentation medium. Serial dilutions (2-fold) were prepared using the generated DMSO stock for each prefraction.Biological screening
Images were acquired as previously reported.6 Briefly, liquid culture (prepared in LB with V. cholerae strain Fy_Vc_240) was dispensed into 384-well microtiter plates (40 μL, black-walled, clear-bottom) using a WellMate peristaltic microplate dispenser. Plates were centrifuged for 1 minute at 1200 rpm to remove air bubbles and bring the culture down from the walls of the plate. 384-well plates with DMSO stocks of test compounds were pinned into the culture plates (200 nL). Pinned culture plates were then incubated for 4.5 hours at 30 °C. Following incubation, OD600 readings were collected, followed by vigorous agitation and washing three times with 1% phosphate buffered saline (PBS). Plates were imaged in PBS by epifluorescence microscopy (ImageXpress Molecular Devices) at both 20× and 40× magnification. Eight sites (distributed throughout the well) were imaged for each well in the 384-well microtiter plate. The raw images collected for each plate were exported, and transferred for analysis using the developed image analysis software.Image analysis software and statistics
The image analysis software was written in Java, using the Eclipse IDE. It consists of two distinct programs, the first of which decodes the .tif files from the automated microscope, performs feature extraction, calculates a set of metrics for each image, and records these metrics together with summary images in a directory of intermediate results. A typical image contains about a thousand features, although the most fine grain ones can have up to 20000 features.
The second program provides browsing facilities for assessing the clustering using selected metrics and maintains a persistent history of decisions taken by the investigators about the exclusion of any malformed images, such as those containing foreign material or showing focusing problems. These histories are structured using XML. Finally, this program generates averages from the sets of images taken for each well and records these averages as the basis for further analysis.
Statistical analyses of metric response as a function of phenotypes and respective concentrations were performed in MATLAB. Third order polynomial regressions to training set data used built-in minimization procedures operating on orthogonal residuals calculated from the total least squares method.19 Goodness of fit calculations (FG) also operated on orthogonal residuals. Since no closed form method exists for performing total least squares on arbitrary non-linear functions, both cases had to be treated numerically by finely discretizing regression curves utilizing a nearest-neighbor search to determine minimum distances to data of interest. Discretization of each curve was done at a high resolution of 500–800 points over the domain.
General isolation strategy and structure elucidation procedures
Bacterial cultures were prepared from organism glycerol frozen stocks by plating upon solid media followed by preparation in liquid culture (1 L scale) using standard growth media. These 1 L liquid bacterial cultures were extracted with 1:1 CH2Cl2–MeOH, and concentrated to dryness in vacuo. The crude extracts were then resuspended in a MeOH–H2O solution, and further fractionated by solid phase extraction chromatography into six different prefractions. These prefractions were concentrated to dryness in vacuo, prepared as DMSO stock solutions and reformatted into 384-well screening plates. Hits from the primary screening platform were reformatted as serial dilutions. Promising phenotype trajectories from the secondary dilution screening were identified, and peak libraries of the prefractions were prepared and rescreened to identify active constituents. Further details on culture preparation, prefractionation, and peak library preparation are available in the ESI,† Methods.
Identified peaks were purified using standard HPLC-MS isolation methods. Solvents used for chromatographic isolation were HPLC grade and used without further purification. NMR data collected for pure compounds was acquired using a Varian Unity Inova spectrometer at 600 MHz equipped with a 5 mm HCN triple resonance cryoprobe and referenced to residual proton signals. HRMS data for pure compounds was acquired using an electrospray ionization (ESI) time-of-flight (TOF) mass spectrometer (Agilent 6230 ESI-TOF). Comparison of 1H NMR data and HRMS to literature values validated the known compound identities (ESI,† Methods).
Acknowledgements
We thank C. Schulze and K. Kurita for purification and characterization of cosmomycin D and cycloprodigiosin respectively, F. Yildiz and A. Cheng for bacterial strains and culture preparation, and W. Wong for bacterial prefraction preparation of the tetracycline-producing type strain. Financial support was provided by NIH-R21AI098836-01 and NIH-TW006634 (RGL).References
- D. J. Payne, M. N. Gwynn, D. J. Holmes and D. L. Pompliano, Nat. Rev. Drug Discovery, 2007, 6, 29 CrossRef CAS.
- D. M. Shlaes, S. J. Projan and J. E. Edwards, ASM News, 2004, 70, 275 Search PubMed.
- L. L. Silver, Clin. Microbiol. Rev., 2011, 24, 71 CrossRef CAS.
- D. W. Young, A. Bender, J. Hoyt, E. Mcwhinnie, G.-W. Chirn, C. Y. Tao, J. A. Tallarico, M. Labow, J. L. Jenkins, T. J. Mitchison and Y. Feng, Nat. Chem. Biol., 2008, 4, 59 CrossRef CAS.
- G. D. Wright, Chem. Biol., 2012, 19, 3 CrossRef CAS.
- K. C. Peach, W. M. Bray, N. J. Shikuma, N. C. Gassner, R. S. Lokey, F. H. Yildiz and R. G. Linington, Mol. BioSyst., 2011, 7, 1176 RSC.
- A. S. Klainer and R. L. Perkins, J. Infect. Dis., 1970, 122, 323 CrossRef CAS.
- J. M. Diver and R. Wise, J. Antimicrob. Chemother., 1986, 18, 31 CAS.
- J. J. Jackson and H. Kropp, Innate Immun., 1996, 3, 201 CrossRef CAS.
- A. S. Klainer and R. R. Russell, Antimicrob. Agents Chemother., 1974, 6, 216 CrossRef CAS.
- D. J. Mason, E. G. Power, H. Talsania, I. Phillips and V. A. Gant, Antimicrob. Agents Chemother., 1995, 39, 2752 CrossRef CAS.
- L. L. Silver, in Antibiotic Discovery and Development, ed. T. J. Dougherty and M. J. Pucci, Springer, US, 2012, p. 46 Search PubMed.
- C. Watanakunakorn and M. Hamburger, Appl. Microbiol., 1969, 17, 935 CAS.
- A. S. Klainer and R. L. Perkins, Antimicrob. Agents Chemother., 1972, 1, 164 CrossRef CAS.
- T. M. Cook, K. G. Brown, J. V. Boyle and W. A. Goss, J. Bacteriol., 1966, 92, 1510 CAS.
- C. T. Walsh and M. A. Fischbach, Sci. Am., 2009, 301, 44 CrossRef CAS.
- S. B. Falconer, T. L. Czarny and E. D. Brown, Nat. Chem. Biol., 2011, 7, 415 CrossRef CAS.
- F. G. Rodgers, A. O. Tzianabos and T. S. Elliott, J. Med. Microbiol., 1990, 31, 37 CrossRef CAS.
- I. Markovsky and S. Van Huffel, Signal Process., 2007, 87, 2283 CrossRef.
- W. R. Wong, A. G. Oliver and R. G. Linington, Chem. Biol., 2012, 19, 1483 CrossRef CAS.
- C. J. Schulze, W. M. Bray, M. H. Woerhmann, J. Stuart, R. S. Lokey and R. G. Linington, Chem. Biol., 2013, 20, 285–295 CrossRef CAS.
- F. W. Crow, W. K. Duholke, C. E. Hadden, R. F. Smith, T. J. Thamann, B. D. Kaluzny, D. A. Hahn, C. S. Mallory, K. A. Farley and G. E. Martin, J. Heterocycl. Chem., 1999, 36, 365 CrossRef CAS.
- M. Gellert, M. H. O'Dea, T. Itoh and J. Tomizawa, Proc. Natl. Acad. Sci. U. S. A., 1976, 73, 4474 CrossRef CAS.
- R. L. Robson and J. Baddiley, J. Bacteriol., 1977, 129, 1045 CAS.
- M. A. Kohanski, D. J. Dwyer and J. J. Collins, Nat. Rev. Microbiol., 2010, 8, 423 CrossRef CAS.
- R. J. Lewis, F. T. Tsai and D. B. Wigley, Bioessays, 1996, 18, 661 CrossRef CAS.
- R. L. A. Furlan, S. J. Watt, L. M. Garrido, G. P. Amarante-Mendes, M. Nur-e-alam, J. Rohr, A. Braña, C. Mendez, J. A. Salas, M. M. Sheil, J. L. Beck and G. Padilla, J. Antibiot., 2004, 57, 647 CrossRef CAS.
- N. N. Gerber, Tetrahedron Lett., 1983, 24, 2797 CrossRef CAS.
- H. Laatasch and R. H. Thomson, Tetrahedron Lett., 1983, 24, 2701 CrossRef.
- J. S. Lee, Y. S. Kim, S. Park, J. Kim, S. J. Kang, M. H. Lee, S. Ryu, J. M. Choi, T. K. Oh and J. H. Yoon, Appl. Environ. Microbiol., 2011, 77, 4967 CrossRef CAS.
- H. Konno, H. Matsuya, M. Okamoto, T. Sato, Y. Tanaka, K. Yokoyama, T. Kataoka, K. Nagai, H. H. Wasserman and S. Ohkuma, J. Biochem., 1998, 124, 547 CrossRef CAS.
- R. Martin, A. Jäger, M. Böhl, S. Richter, R. Fedorov, D. J. Manstein, H. O. Gutzeit and H.-J. Knölker, Angew. Chem., Int. Ed., 2009, 48, 8042 CrossRef CAS.
- M. Preller, K. Chinthalapudi, R. Martin, H.-J. Knölker and D. J. Manstein, J. Med. Chem., 2011, 54, 3675 CrossRef CAS.
- M. C. Kiel, H. Aoki and M. C. Ganoza, Biochimie, 1999, 81, 1097 CrossRef CAS.
- J. Xu, M. C. Kiel, A. Golshani, J. G. Chosay, H. Aoki and M. C. Ganoza, Nucleic Acids Res., 2006, 34, 1158 CrossRef CAS.
- T. Christophe, M. Jackson, H. K. Jeon, D. Fenistein, M. Contreras-Dominguez, J. Kim, A. Genovesio, J.-P. Carralot, F. Ewann, E. H. Kim, S. Y. Lee, S. Kang, M. J. Seo, E. J. Park, H. Skovierova, H. Pham, G. Riccardi, J. Y. Nam, L. Marsollier, M. Kempf, M.-L. Joly-Guillou, T. Oh, W. K. Shin, Z. No, U. Nehrbass, R. Brosch, S. T. Cole and P. Brodin, PLoS Pathog., 2009, 5, e1000645 Search PubMed.
- P. Brodin and T. Christophe, Curr. Opin. Chem. Biol., 2011, 15, 1 CrossRef.
Footnote |
| † Electronic supplementary information (ESI) available. See DOI: 10.1039/c3mb70027e |
| This journal is © The Royal Society of Chemistry 2013 |