 Open Access Article
Stress induces remodelling of yeast interaction and co-expression networks†
Sonja
Lehtinen
a,
Francesc Xavier
Marsellach
bc,
Sandra
Codlin
bc,
Alexander
Schmidt
d,
Mathieu
Clément-Ziza
e,
Andreas
Beyer
e,
Jürg
Bähler
bc,
Christine
Orengo
*f and
Vera
Pancaldi
*g
aCoMPLEX, UCL, Gower Street, London, WC1E 6BT, UK
bUniversity College London, Department of Genetics, Evolution and Environment, London, WC1E 6BT, UK
cUniversity College London, Cancer Institute, London, WC1E 6BT, UK
dProteomics Core Facility, Biozentrum, University of Basel, Basel, Switzerland
eCellular Networks and Systems Biology, Biotechnology Center, Technische Universität Dresden, Dresden, Germany
fInstitute of Structural and Molecular Biology, University College of London, Gower Street, London WC1E 6BT, UK. E-mail: c.orengo@ucl.ac.uk
gStructural Biology and BioComputing Program, Spanish National Cancer Research Centre (CNIO), 28029 Madrid, Spain. E-mail: v.pancaldi@cnio.es
First published on 28th February 2013
Abstract
Network analysis provides a powerful framework for the interpretation of genome-wide data. While static network approaches have proved fruitful, there is increasing interest in the insights gained from the analysis of cellular networks under different conditions. In this work, we study the effect of stress on cellular networks in fission yeast. Stress elicits a sophisticated and large scale cellular response, involving a shift of resources from cell growth and metabolism towards protection and maintenance. Previous work has suggested that these changes can be appreciated at the network level. In this paper, we study two types of cellular networks: gene co-regulation networks and weighted protein interaction networks. We show that in response to oxidative stress, the co-regulation networks re-organize towards a more modularised structure: while sets of genes become more tightly co-regulated, co-regulation between these modules is decreased. This shift translates into longer average shortest path length, increased transitivity, and decreased modular overlap in these networks. We also find a similar change in structure in the weighted protein interaction network in response to both oxidative stress and nitrogen starvation, confirming and extending previous findings. These changes in network structure could represent an increase in network robustness and/or the emergence of more specialised functional modules. Additionally, we find stress induces tighter co-regulation of non-coding RNAs, decreased functional importance of splicing factors, as well as changes in the centrality of genes involved in chromatin organization, cytoskeleton organization, cell division, and protein turnover.
Introduction
Biological systems are endowed with a considerable ability to adapt to different environments, allowing them to survive external insults by launching prompt and pervasive rearrangements of their regulatory systems.1,2 In the past decades, this phenomenon has been studied extensively based on genome-wide expression analysis, revealing the presence of a large subset of genes that are up- or down-regulated as part of a sophisticated stress response.2–5 The stress response leads to a transient arrest in growth, allowing the cell to invest energy in multiple protective mechanisms.6Regulation of the stress response occurs at the transcriptional level as well as post-transcriptional and post-translational levels.7 Generally, stress elicits the activation of a kinase cascade which culminates in the launch of a transcriptional response. Thus, the rapid and transient initial response is followed by long term cellular changes involving down-regulation of metabolism and growth in favour of defence against stress.1 This response limits the damage inflicted by the present threat but also promotes resilience against further insults.3
Genes that are induced under stress are more rapidly evolving and characterized by higher variability between cells and conditions.8,9 This finding suggests that a variable environment favours higher levels of heterogeneity (‘bet hedging’), making it more likely for at least part of the population to survive a change in conditions.1 It is thus possible that the rearrangements produced during the stress response lead the cell into a more plastic state, allowing it to explore larger portions of phenotypic space and ultimately favouring adaptation. Alternatively, one could imagine that stricter control is necessary to ensure survival of the cell in the face of adverse conditions.
While numerous studies have helped characterise specific stress response pathways and mechanisms,10 the integration of these pathways and mechanisms on a whole cell level is less well understood. Network approaches have proved to be a powerful tool for the analysis of genome-wide datasets; they provide insights into cellular behaviour, for example in explaining cellular adaptability11 and resilience to perturbations.12 The focus has recently shifted from the characterization of static networks towards understanding their dynamics and control, as well as the topological alteration produced by changes in the environment.13,14 For example, Gopalacharyulu et al. compiled an integrated budding yeast network combining physical protein interactions with curated pathways and metabolic data.15 Their analysis showed a dynamic modulation of the system's connectivity in response to oxidative stress. Similar large scale stress-induced topological changes have also been seen in budding yeast transcriptional networks.16
More recently, Mihalik and Csermely generated differing networks for stressed and non-stressed states by weighting the budding yeast interactome by the abundance of the interacting proteins in each condition. The authors reported a partial disassociation of this network under heat stress,17 with lesser communication between network modules. The authors suggest that this decoupling of modules represents a cellular survival strategy. The pruning of interactions could (i) decrease information flow between modules, thus minimizing the spread of damage;18 (ii) represent the emergence of more specialized and autonomic functional units; or (iii), in networks where links have a metabolic cost, be the result of energy saving measures.
Mihalik and Csermely's study used mRNA levels as a proxy for protein abundance and focused on two specific datasets, representing the natural and stressed state, collected in two different laboratories. In this study, we perform a similar analysis, but using protein, not mRNA, abundance, measured at several time points after stress induction. We investigate the effects of two distinct stress types and also explore alternative methods of weighting the interactome. Additionally, the analysis is expanded to gene co-regulation networks. This allowed us to gain further insight into stress induced network changes and to probe the role of non-coding RNAs in the stress response. All datasets used were collected in the same laboratory under standardized conditions.
Our results show a clear change in the co-expression networks towards a more modularised structure: genes within network modules become more tightly co-regulated, while co-regulation between modules is decreased. This change in network structure appears to be translated onto the protein–protein interaction network and to take place in response to both oxidative stress and nitrogen starvation.
Methods
Gene co-expression networks
Gene co-expression networks were constructed using gene expression data from genetic variants exposed to oxidative stress (0.5 mM hydrogen peroxide, H2O2). Spearman correlation coefficients were computed across the genetic variants for each gene pair, under both stressed and non-stressed conditions. To generate the networks, a specific number of gene pairs with the highest significant (p < 0.05) correlation coefficients were considered connected, yielding an unweighted network (see ESI† for further details). This ensured that networks compared under stressed and non-stressed conditions were of similar size. We verified our results using different numbers of edges and specific correlation coefficient cut-offs. The effect of stress was found to be the same across the networks generated using these different parameters (see ESI,† Tables S1 and S2). Two distinct sets of gene expression data (microarray and RNAseq) were used to generate networks, yielding a total of four co-expression networks (microarray non-stressed, microarray stressed, RNA-seq non-stressed, RNA-seq stressed). Details of the datasets are outline below:Protein interaction networks
The physical protein interaction network for S. pombe was downloaded from iRefIndex,19 a database consolidating interactions from a number of repositories (BIND, BioGRID, CORUM, DIP, HPRD, IntAct, MINT, MPact, MPPI and OPHID). To capture stress induced changes in the network, we sought to weight the interactions according to an approximation of the probability of their occurrence under specific conditions. We used two distinct approaches.The first method was to take the product of the abundances of the proteins involved in the interaction. This approximates the probability of the physical interaction occurring in the cell and is similar to the strategy adopted by Mihalik and Csermely.17 To adjust for the bias against lowly expressed proteins inherent in this method, the approximated probability of interaction (i.e. the product of the abundances) was normalised by the approximated probability under non-stressed conditions. This normalised product was used to weight the interactions. The weights in the non-stressed network thus all become one, whereas the edge weights in the stressed network reflect the ratio of the probabilities of the interaction occurring pre- and post- stress.
The second way of weighting the interactions was to use the correlation coefficient (from the RNA-seq dataset, as this represents correlation across a larger number of genetic variants, thus giving a better estimate of gene co-expression) as weights for the links. Negatively correlated protein pairs were assigned a weight of zero. This too is an approximation of the probability of the interaction occurring in the cell, as proteins both need to be present for the interaction to occur and the presence of the corresponding RNA can be a useful proxy.
To investigate the network effects of a different form of stress, we also built weighted abundance networks from protein abundance data from proliferating and quiescent cells. Quiescent cells had undergone 24 hours of nitrogen starvation prior to protein quantification. Protein levels were measured as described in ref. 20.
Modularisation
Though methods of finding overlapping modules in networks are increasingly popular, no consensus over the best method exists. We therefore used two distinct module finding algorithms: Link Communities21 and ModuLand.22| S(eik, ejk) = (n+(i) ∩ n+(j))/(n+(i) ∪ n+(j)) |
Results and discussion
Overview of networks
In order to study stress induced changes on a whole cell level, we constructed two types of network, as illustrated in Fig. 1 and Table 1: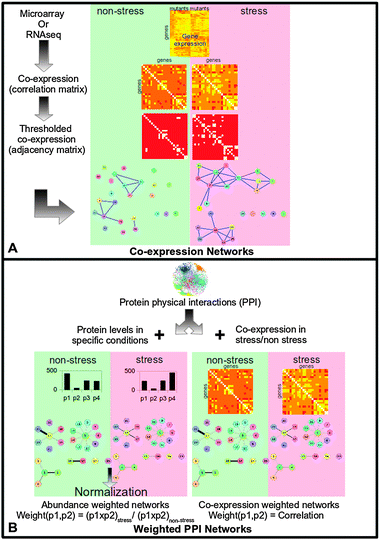 | ||
| Fig. 1 A general schematic illustrating how the networks used in this paper were generated. (A) Co-expression networks were generated from gene expression data in various genetic variants under non-stressed and stressed (60 minutes after exposure to 0.5 mM hydrogen peroxide) conditions. Correlations in expression between all gene pairs were calculated and the correlation matrix thresholded to give the adjacency matrix of the co-expression network. (B) Weighted protein–protein interaction (PPI) networks were generated by condition specific weighting of the physical interaction in fission yeast. The weight of the edge approximates the probability of the interaction occurring in the non-stressed or stressed cell. Two methods of edge weighting were used. (1) Abundance weighting, where the interaction between two proteins was weighted by the product of the proteins' abundances. To avoid bias against lowly expressed proteins, these products were normalized by the product in the non-stressed condition. (2) Co-expression weighting, where the interaction between two proteins was weighted by how correlated their expression is. | ||
| Network | Method | Analyses |
|---|---|---|
| Microarray co-expression | Thresholded correlation coefficients across stress related mutants. | Basic network properties, module overlap, GO category analysis. |
| RNA-seq co-expression | Thresholded correlation coefficients across 117 genetic segregants. | Basic network properties, module overlap, GO category analysis, role of non-coding genes. |
| Abundance-weighted PPI | Link weight is the product of the abundance of the connected proteins, normalized by this product in the non-stressed state. | Module overlap, betweenness centrality. |
| Co-expression weighted PPI | Correlation coefficients from RNA-seq data assigned as weights for connected proteins. | Module overlap, GO category analysis. |
1. Gene co-expression networks: these capture the correlation in gene expression across genetic variants, thus representing patterns of co-regulation across the genome. We performed our analyses on two distinct networks constructed from different datasets: a microarray dataset of gene expression levels across different mutants and an RNA sequencing datasets across different genetic segregants.
2. Weighted protein–protein interaction (PPI) networks: these networks approximate the condition specific probability of physical interactions occurring between proteins. We estimate this probability in two different ways, yielding two distinct networks: firstly using the abundance of the interacting proteins, as measured by mass spectrometry quantification; and secondly using the correlation in gene expression of the interacting proteins.
Stress induced changes in co-expression networks
The stress induced changes in the co-expression networks can be visually appreciated (Fig. 2). However, to meaningfully quantify the stress induced changes in network structure, we computed various network statistics.
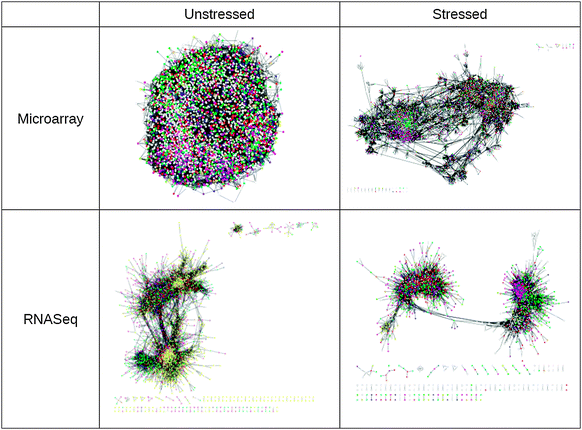 | ||
| Fig. 2 Visualization of co-expression networks before and after exposure to peroxide stress (0.5 mM), showing the re-structuring of the network into more distinct modules. Nodes represent genes while the links between them represent a high level of co-regulation (that is, a high correlation in gene expression across genetic variants). The visualizations were generated using force directed layout in cytoscape and nodes are colour coded according to GO category. Yellow nodes in the RNA-seq unstressed network are either non-coding RNAs or neighbours of a non-coding RNA. | ||
We started by calculating the average shortest path length. This is the average minimum number of steps from one node to another in the network, which captures information about the network's connectivity structure. If the network is not fully connected (i.e. paths do not exist between all nodes), only the largest connected component is considered. In both microarray and RNA-seq datasets, stress was found to increase this measure (from 4.58 to 6.10 and from 4.85 to 6.33, respectively). This increase was conserved using different correlation cut-offs for network generation (see ESI,† Table S1).
To check whether this stress induced increase was not simply due to a change in the number of nodes in the network (or in the largest component), we calculated an expected path length for each component size. Twenty control networks were generated for each co-expression network, keeping the same degree structure as the original network but randomly reshuffling the edges (for more details see ESI†). Calculating the average shortest path for these control networks gave an expected average shortest path length for each network. In both microarray and RNA-seq networks, stress was found to increase the actual average shortest path length significantly more than the expected average shortest path length (p < 10−9, two-tailed t-test). Therefore, stress causes a restructuring of the network, leading to a longer average shortest path length.
The increase in average shortest path length is particularly noteworthy, given that the density of the largest connected component is increased (from 0.0067 to 0.0068 for the microarray and from 0.012 to 0.026 for the RNA-seq networks). Network density is the number of existing connections divided by the maximum possible number of connections for a fully connected network: a higher network density would thus be expected to yield a shorter path length, as more connections exist in the network. The increase in both path length and density suggests that stress leads to a restructuring of the network where links between “local” genes (i.e. gene pairs that already have short paths between them) are increased, but connections to more “distant” genes become fewer. In other words, the network becomes more modularised.
We tested this idea by looking at the change in transitivity, the likelihood with which two neighbours of a gene are also connected in the network. Consistent with the hypothesis above, stress was found to increase transitivity in both microarray and RNA-seq networks (from 0.38 to 0.42 and 0.52 to 0.60, respectively).
Thus, the increase in path length, transitivity and density all suggest that stress creates a network structure with more tightly co-regulated modules, but fewer inter-modular connections. We further investigated these changes in network structure by directly examining the modular structure of the network.
1. Link Communities (LC): this algorithm divides the links in a network into non-overlapping subsets, which define the link modules. The nodes are then associated with all the modules to which their links belong.
2. ModuLand (ML): this algorithm assigns nodes into modules based on a measure of a node's “influence” on others (see Methods for details).
To understand the stress induced change in the network structure, we looked at changes in module overlap. Module overlap reflects the extent to which a single protein belongs to more than one set of tightly co-regulated proteins. For Link Communities, the overlap is simply the average number of module assignments per node, whereas for ModuLand, the overlap measure takes into account the strength of each module assignment (see Methods).
As seen in Fig. 3, overlap decreases significantly in response to stress in both microarray and RNA-seq networks (Wilcoxon ranked sum test, p < 10−6). This finding is robust when using different thresholds for edge inclusion (ESI†, Table S2). These results confirm the breakdown of the network into modules that have fewer interconnections between them.
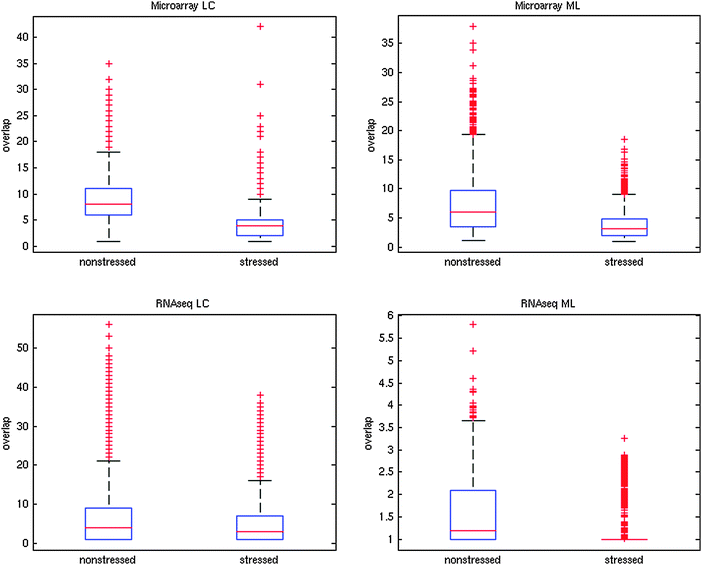 | ||
| Fig. 3 Changes to modular overlap in co-expression networks in response to oxidative stress (0.5 mM hydrogen peroxide). Two distinct module finding algorithms were used: ModuLand (ML) and Link Communities (LC, using clustering cut-off of 0.4, see Methods). For ModuLand modules, overlap was measured as ML overlap (see Methods), while for LC modules, overlap was measured as the number of modules a protein belonged to. Average LC overlap decreased from 8.88 to 3.43 for the microarray network and from 9.98 to 3.31 for the RNAseq network. Average ML overlap decreased from 7.15 to 3.63 for the microarray network and from 1.58 to 1.18 for the RNAseq network. All changes were significant (Wilcoxon ranked sum test, p < 10−6). | ||
This type of structural re-organization is consistent with increased network robustness: decreased communication between functional modules could ensure that perturbations in one module are not spread across the entire network. This increase in robustness could contribute to resilience against further insults.
To test whether the mutant microarray and genetic variant RNA-seq networks capture the same information, we tested the correlation between a gene's co-expression pattern as computed from the two datasets. The average correlation was 0.093 (range: −0.31 to 0.43 Spearman rank correlation).
The low correlation between the two datasets suggests that there is a difference in the information captured by the networks. One explanation for this discrepancy could be that seven genetic conditions are not sufficient to accurately capture gene co-expression. To check whether this was the case, we calculated co-expression using a wider pool of mutants including 24 additional mutants (which could not be used for network construction, because they lacked expression data post exposure to stress). The co-expression, as calculated from these 7 mutants correlated (0.68 Spearman coefficient) with the co-expression as calculated from the 31 mutants. Thus, the 7 mutants are sufficient to produce a fairly representative approximation of co-expression (see ESI† for further discussion of the robustness of the microarray dataset).
A second possible explanation is a bias introduced because all mutants in the microarray dataset are stress related. This could affect the co-expression network in two ways: first, the variability between the genetic conditions is low, explaining the higher average correlation in the microarray dataset. This gives us less power to probe co-expression – some patterns of co-regulation may therefore be missed. Second, the related perturbations could mean that we may not be fully capturing co-regulation for stress related genes: the expression of these genes may be dominated by the direct effects of the perturbation, masking effects of co-regulation.
Despite these points, the stress-induced changes are remarkably consistent in the two networks, suggesting that the effect of stress on the co-expression network is robust.
An analysis of the non-coding RNAs that appear to be strongly co-regulated only during stress reveals that the majority are annotated antisense RNAs, overlapping protein coding transcripts on the opposite strand. The corresponding protein-coding transcripts (mRNAs) represent a mixture of cell-cycle factors, chromatin remodellers and metabolism related proteins (data not shown). This suggests these strongly co-regulated non-coding RNAs might play a role in the regulation of these functions during stress. More specifically, we classified links into three classes: links between two non-coding RNAs, links between two coding RNAs and links connecting one coding transcript to a non-coding one. Fig. 4 shows the proportion of existing links compared to the total number of possible links within each of these categories, in other words, capturing the density within each of these categories. Stress produces an increase in links connecting the same type of gene (both coding or non-coding) whereas there is no increase in the density of mixed (coding to non-coding) links. This result confirms findings that non-coding antisense RNAs can be regulated independently from their corresponding coding partners.26 In addition to the antisense RNAs discussed above, some of the non-coding RNAs appearing only in the stressed network are paired with other non-coding RNAs on the opposite strand, while others are intergenic RNAs.
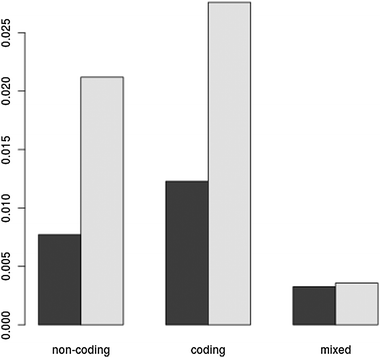 | ||
| Fig. 4 The density (existing links over possible links) of coding and non-coding RNA sub-networks in the RNAseq co-expression network. The three categories of links shown are: non-coding to non-coding; coding to coding; and non-coding to coding (mixed). Dark bars shows measures for the non-stressed network, lighter bars shows measures for the stressed network. Stress increases the density of coding to coding and non-coding to non-coding links, without greatly affecting the mixed links. | ||
Protein interaction networks
1. Abundance weighting: we approximate the probability of interaction based on the abundance of the interacting proteins. To remove bias against interactions involving lowly expressed proteins, the edge weights were normalised by the edge weight in the non-stressed condition. Because abundance data was available for a limited number of proteins, this network was relatively small (563 proteins).
2. Co-expression weighting: edges in the interactome are weighted according to co-expression; this is also an estimate of the probability of the interaction occurring, as both proteins need to be present at the same time.
The average edge weight using both methods of network construction was increased by stress (from 1 to 2.41 for abundance weighting and from 0.27 to 0.33 for co-expression weighting) indicating that, according to our approximation, the probability of protein–protein interaction is higher after exposure to stress.
We also examined changes in overlap for the PPI networks. Calculating ModuLand overlap confirms a decrease in overlap in response to stress for both methods of networks weighting (Fig. 5), though this finding is only significant for the abundance weighting (Wilcoxon signed rank test, p < 0.001 for abundance weighting, p = 0.6 for co-expression weighting). The Link Communities algorithm assigns the vast majority of nodes to a single module (Fig. 5) – making analysis of overlap difficult using this algorithm. These effects on the PPI network are less pronounced than in the co-expression network. Although this result may be a genuine difference between the networks, it could also be due to the relatively small coverage of the PPI network, which gives us less statistical power to detect stress induced changes.
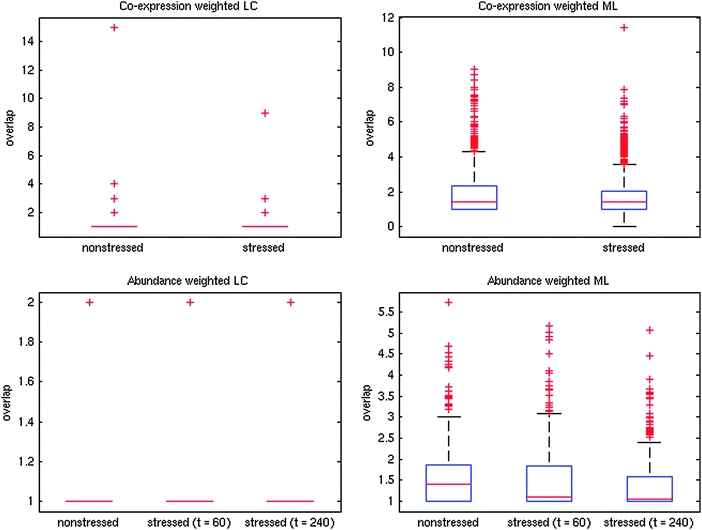 | ||
| Fig. 5 Changes to modular overlap in response to oxidative stress (0.5 mM hydrogen peroxide). The distinct module finding algorithms were used: ModuLand (ML) and Link Communities (LC, using clustering cut-off of 0.4, see ESI†). For ModuLand modules, overlap was measured as ML overlap (see Methods), while for LC modules, overlap was measured as the number of modules a protein belonged to. Average ML overlap decreases from 1.90 to 1.75 for the co-expression weighted networks and from 1.53 to 1.50 (at t = 60 min) and 1.33 (at t = 240 min) for the abundance weighted networks. Average LC overlap decreases from 1.12 to 1.04 for co-expression weighting and from 1.0043 to 1.0022 (at t = 60 and 240 min) for abundance weighting. Changes in the ML overlap are significant for the abundance weighted network (Wilcoxon signed rank test, p < 0.001), though not co-expression weighting (p = 0.59). | ||
To test whether a similar change in network structure is also seen in response to other cellular stresses, we also constructed weighted abundance networks from protein abundance data in response to 24 hours of nitrogen starvation (quiescence). As shown in Fig. 6, the ModuLand overlap is also significantly decreased in response to nitrogen starvation (Wilcoxon signed rank test, p < 10−10). Average Link Communities overlap, however, is increased in response to nitrogen starvation (Wilcoxon signed rank test, p < 10−3). As with stress, the Link Communities algorithm assigns the majority of the nodes to a single module, again, complicating the interpretation of the results. It is therefore possible that the increase in Link Communities overlap represents a difference in the response to oxidative stress and nitrogen starvation. However, we cannot exclude the possibility that the Link Communities overlap is not adequately capturing the overlap for these networks. It is interesting that, although these two stresses produced different cellular responses, the network effect, as measured by ModuLand overlap, is similar. The potential reasons for the network restructuring – increased robustness, energy saving and development of more distinct functional modules – are plausible responses to both oxidative stress and nitrogen starvation.
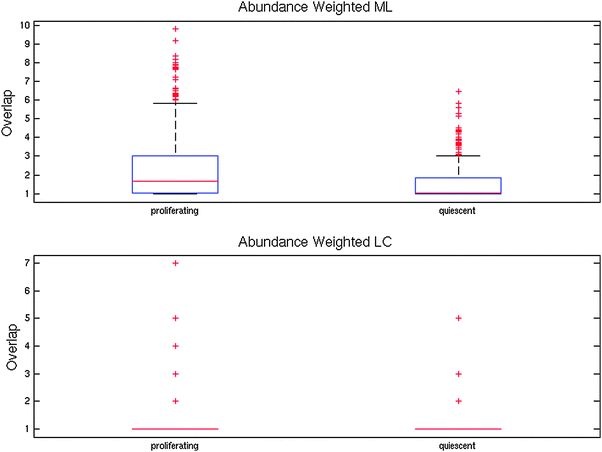 | ||
| Fig. 6 Changes to modular overlap in proliferating and quiescent cells. Quiescent cells have been exposed to 24 hours of nitrogen starvation. For ModuLand modules, overlap was measured as ML overlap (see Methods), while for LC modules, overlap was measured as the number of modules a protein belonged to. Average ML overlap decreases from 2.23 to 1.53 while LC overlap increases from 1.08 to 1.13. The decrease in ML overlap is significant, Wilcoxon signed rank test, p < 10−10). Note that these boxplots do not capture the size difference in the networks: therefore, although the proliferation network has nodes with higher LC overlap, its average overlap is lower because of a larger number of nodes with LC overlap of 1. | ||
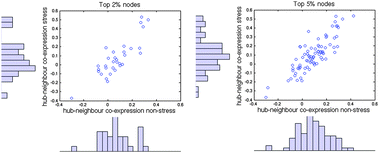 | ||
| Fig. 7 The effect of stress on the extent to which hubs are co-expressed with their neighbours. Co-expression values represent the average correlation coefficient (calculated from the RNA-seq data) between a hub (top 2% (left) and top 5% (right) most connected nodes) and its neighbours. | ||
We analysed the weighted PPIs (abundance weighted and co-expression weighted) finding that overall neither average BC calculated on the whole network, nor average BC calculated within specific GO-category sub-networks (BCsub) changed significantly after stress treatment. However, when looking at the following sub-networks in the abundance weighted PPIs, we found BCsub to be increased in response to stress: DNA dependent transcription, cytokinesis, nucleocytoplasmic transport and chromatin modification. These functional sub-networks are therefore likely to become more densely interconnected.
Interestingly, BCsub in the chromatin modification sub-network continues to increase at the late stress time point (240 minutes), compared to the 60 minutes point, a behaviour not observed in other GO categories. This is consistent with changes at the chromatin level being part of a more permanent stress induced rearrangement of cellular regulation.28,29 A more thorough analysis of genes that change BC upon stress treatment is presented in the following section and in ESI,† Tables S5–S7 and Fig. S4 and S5.
The concept of linkerity expresses the sub-network centrality of a node relative to its global centrality. Nodes with high linkerity values are thus at the edges of sub-networks, but central in the full network. High linkerity proteins are therefore thought to represent linkers between separate functional sub-networks. Although different genes display high linkerity before and after stress treatment, no general change in average linkerity values is observed (see ESI†). However, specific functional categories of genes are seen to change their linkerity values due to stress.
Biological correlates of network change
We performed a similar analysis for PPI networks (only the co-expression weighted, as all genes were present in both networks for abundance weighted networks). Here, the absence of a protein under only one of the conditions is due to all its edges having a weight of zero, indicating that the protein is not important either pre- or post- stress. Neither set of proteins, however, was enriched for any particular GO category when using the PPI network as background.
To investigate changes in connectivity of genes and proteins present in both stressed and unstressed networks, we looked at genes undergoing the largest change in degree following exposure to stress. In the co-expression networks, this indicates which genes' co-expression relations are most affected in response to stress. We sorted the genes according to the magnitude of the change in degree between non-stressed and stressed networks. In the RNA-seq networks, the top 10% of genes with the biggest stress-induced decrease in degree (reaching 173 vs. 1) are weakly enriched for monosaccharide catabolic processes (corrected p = 0.0038). As for the genes with the greatest increase in degree after exposure to stress, the top 10% are enriched for cytoplasmic translation (corrected p = 0.00084). Again, the genes present in the network were used as the background set for the analysis. In the microarray co-expression network, no enrichment was found in either set of genes, although when using the whole genome as background, the enrichment for cytoplasmic translation in the genes with increasing degree was recovered (corrected p < 10−17).
We then tested which proteins undergo the largest change in weighted degree in the PPI networks in response to stress. Weighted degree is the sum of the weights of a protein's interaction; thus, in these PPI networks, it represents its probability of participating in an interaction. We examined the 10% of proteins with the greatest stress induced decrease in degree. In the co-expression weighted network, these are enriched (using the rest of the network as background) for mRNA processing and particularly RNA splicing (corrected p < 0.00628). In the abundance weighted networks, there is no enrichment using the abundance weighted network as background. However, using either the larger PPI network (that is, not excluding proteins for which no proteomics data was available) or the whole genome as background, the mRNA processing and RNA splicing enrichment is recovered (corrected p < 0.00275). The 10% of proteins undergoing the largest degree increase were not enriched for any GO-terms in either of the networks using the network as background.
In summary, these results suggest a stricter control of proteins involved in translation in the stressed condition. Furthermore, stress appears to decrease the involvement of genes related to RNA splicing in interactions. This finding could reflect that rapidly regulated stress-response genes are under-enriched for introns,30 thus leading to a decreased importance of splicing-related proteins during the stress response. This hypothesis is supported by the finding that the enrichment for splicing related categories is no longer present at 4 hours post exposure to stress.
We repeated the enrichment analysis for sets of proteins undergoing a change in centrality in response to stress. Proteins that decrease their overall BC upon stress treatment are enriched for cytokinesis (corrected p < 10−14), while the proteins that increase BC are enriched in proteasome subunits (corrected p < 10−19).
An interesting group of proteins increase their overall BC at the 240 min time-point, and they are enriched in cytoskeleton re-organization (corrected p < 10−6).
Although the numbers of genes in these lists are small, the enrichments suggest a fundamental role for the proteasome after stress treatment, probably involved in the elimination of the oxidatively damaged protein. Both the enrichment for cytokinesis and cytoskeleton re-organization are likely to be explained by the growth arrest which is initiated during stress response. These findings also suggest an important rearrangement of the cellular structure as a long-term consequence of stress, in line with recent reports of cross-talk between cell cycle and cell shape regulation.24
Finally, confirming our previous findings, genes that have changes in linkerity upon stress treatment are enriched for splicing.
Conclusions
Gene correlation networks become fragmented in response to stress
Gene correlation networks show higher positive correlation coefficients, longer average shortest path lengths, higher transitivity, and less overlap between modules after exposure to stress. These findings are indicative of a tighter co-regulation between genes within a module, but lesser communication between modules. This type of re-organization might represent the emergence of more specialized functional units in response to stress. It is also consistent with increased network robustness, potentially ensuring resilience to further challenges. Though changes in the weighted PPI networks are more difficult to assess, it appears that the re-organization seen at a gene expression level is indeed translated to the protein level.Under stress, the co-expression between a group of hubs and their neighbours increases. These findings are reminiscent of a long standing debate about the existence of bimodality in the hub-neighbour co-expression distribution and the distinction between party-hubs (co-expressed with neighbours and binding many partners at once) and date-hubs (not co-expressed with neighbours and binding partners in different places or at different times).31–33 We do not believe that our dataset is of a sufficient size to justify any claims in this regard. However, we do observe bimodality in hub-partner co-expression in stressed networks, consistent with the strengthening of inter-module connections parallel to a weakening of intra-module links.
Specific gene functional categories are seen to be affected by the stress
Our analysis also suggests a decreased importance for splicing factors under stress. This effect is observed in two distinct types of protein interaction network: those weighted according to protein abundance as well as those weighted according to protein co-expression. These genes also present changes in their linkerity upon treatment. The lesser functional importance of this regulatory mechanism after stress exposure could arise from the need for rapid control of genes in response to stress. Importantly, the phenomenon is no longer seen four hours after exposure to stress, highlighting its association with the transient stage of the transcriptional response.The decreased network centrality of proteins involved in cell division is consistent with the stress-induced growth arrest, while increased centrality of proteasome subunits could indicate a higher turnover of proteins needed to eliminate the oxidatively damaged proteins.
The local betweenness centrality analysis within specific functional subnetworks also suggests the importance of chromatin modification in the long term following stress exposure, accompanied by a rearrangement of the cytoskeleton.
Finally, increased co-expression between non-coding RNAs in the stressed conditions suggests that they might play an important role in cellular stress response.
Acknowledgements
The authors would like to thank two anonymous referees for suggesting interesting improvements to this work. This research was funded by PhenOxiGEn (an EU FP7 research project) and a Wellcome Trust Senior Investigator Award to JB. S.L. is supported by the Engineering and Physical Sciences Research Council.A.B. is supported by the Klaus Tschira Foundation. A.B. and M.C.Z are supported by a EU FP7 HEALTH grant (HEALTH-F4-2008-223539).
Notes and references
- L. López-Maury, S. Marguerat and J. Bähler, Nat. Rev. Genet., 2008, 9, 583–593 CrossRef.
- D. B. Berry, Q. Guan, J. Hose, S. Haroon, M. Gebbia, L. E. Heisler, C. Nislow, G. Giaever and A. P. Gasch, PLoS Genet., 2011, 7, e1002353 CAS.
- D. B. Berry and A. P. Gasch, Mol. Biol. Cell, 2008, 19, 4580–4587 CrossRef CAS.
- D. Chen, W. M. Toone, J. Mata, R. Lyne, G. Burns, K. Kivinen, A. Brazma and N. Jones, Mol. Biol. Cell, 2003, 14, 214–229 CrossRef CAS.
- D. Chen, C. R. M. Wilkinson, S. Watt, C. J. Penkett, W. M. Toone, N. Jones and J. Bähler, Mol. Biol. Cell, 2008, 19, 308–317 CrossRef CAS.
- H. Saito and F. Posas, Genetics, 2012, 192, 289–318 CrossRef.
- D. H. Lackner, M. W. Schmidt, S. Wu, D. A. Wolf and J. Bähler, Genome Biol., 2012, 13, R25 CrossRef CAS.
- B. Lehner, PLoS One, 2010, 5, e9035 Search PubMed.
- V. Pancaldi, F. Schubert and J. Bähler, Mol. BioSyst., 2010, 6, 543–552 RSC.
- E. de Nadal, G. Ammerer and F. Posas, Nat. Rev. Genet., 2011, 12, 833–845 CAS.
- W. Ma, A. Trusina, H. El-Samad, W. A. Lim and C. Tang, Cell, 2009, 138, 760–773 CrossRef CAS.
- N. Kashtan and U. Alon, Proc. Natl. Acad. Sci. U. S. A., 2005, 102, 13773–13778 CrossRef CAS.
- B. Papp, R. A. Notebaart and C. Pál, Nat. Rev. Genet., 2011, 12, 591–602 CrossRef CAS.
- C. Pál, B. Papp, M. J. Lercher, P. Csermely, S. G. Oliver and L. D. Hurst, Nature, 2006, 440, 667–670 CrossRef.
- P. V Gopalacharyulu, V. R. Velagapudi, E. Lindfors, E. Halperin and M. Oresic, Mol. BioSyst., 2009, 5, 276–287 RSC.
- N. M. Luscombe, M. M. Babu, H. Yu, M. Snyder, S. A. Teichmann and M. Gerstein, Nature, 2004, 431, 308–312 CrossRef CAS.
- Á. Mihalik and P. Csermely, PLoS Comput. Biol., 2011, 7, e1002187 Search PubMed.
- H. Kitano, Nat. Rev. Genet., 2004, 5, 826–837 CrossRef CAS.
- S. Razick, G. Magklaras and I. M. Donaldson, BMC Bioinf., 2008, 9, 405 CrossRef.
- S. Marguerat, A. Schmidt, S. Codlin, W. Chen, R. Aebersold and J. Bähler, Cell, 2012, 151, 671–683 CrossRef CAS.
- Y.-Y. Ahn, J. P. Bagrow and S. Lehmann, Nature, 2010, 466, 761–764 CrossRef CAS.
- I. A. Kovács, R. Palotai, M. S. Szalay and P. Csermely, PLoS One, 2010, 5, 14 Search PubMed.
- M. Szalay-Beko, R. Palotai, B. Szappanos, I. A. Kovács, B. Papp and P. Csermely, Bioinformatics, 2012, 28, 2202–2204 CrossRef CAS.
- F. Vaggi, J. Dodgson, A. Bajpai, A. Chessel, F. Jordán, M. Sato, R. E. Carazo-Salas and A. Csikász-Nagy, PLoS Comput. Biol., 2012, 8, e1002732 CAS.
- D. Szklarczyk, A. Franceschini, M. Kuhn, M. Simonovic, A. Roth, P. Minguez, T. Doerks, M. Stark, J. Muller, P. Bork, L. J. Jensen and C. von Mering, Nucleic Acids Res., 2011, 39, D561–D568 CrossRef CAS.
- T. Ni, K. Tu, Z. Wang, S. Song, H. Wu, B. Xie, K. C. Scott, S. I. Grewal, Y. Gao and J. Zhu, PLoS One, 2010, 5, e15271 CAS.
- H. Yu, P. M. Kim, E. Sprecher, V. Trifonov and M. Gerstein, PLoS Comput. Biol., 2007, 3, e59 Search PubMed.
- M. Nadal-Ribelles, N. Conde, O. Flores, J. Gonzalez-Vallinas, E. Eyras, M. Orozco, E. de Nadal and F. Posas, Genome Biol., 2012, 13, R106 CrossRef.
- S. Pelet, F. Rudolf, M. Nadal-Ribelles, E. de Nadal, F. Posas and M. Peter, Science, 2011, 332, 732–735 CrossRef CAS.
- D. C. Jeffares, C. J. Penkett and J. Bähler, Trends Genet., 2008, 24, 375–378 CrossRef CAS.
- J.-D. J. Han, N. Bertin, T. Hao, D. S. Goldberg, G. F. Berriz, L. V Zhang, D. Dupuy, A. J. M. Walhout, M. E. Cusick, F. P. Roth and M. Vidal, Nature, 2004, 430, 88–93 CrossRef CAS.
- N. N. Batada, T. Reguly, A. Breitkreutz, L. Boucher, B.-J. Breitkreutz, L. D. Hurst and M. Tyers, PLoS Biol., 2007, 5, e154 Search PubMed.
- S. Agarwal, C. M. Deane, M. A. Porter and N. S. Jones, PLoS Comput. Biol., 2010, 6, e1000817 Search PubMed.
Footnote |
| † Electronic supplementary information (ESI) available. See DOI: 10.1039/c3mb25548d |
| This journal is © The Royal Society of Chemistry 2013 |
