Analysis of omics data with genome-scale models of metabolism
Daniel R.
Hyduke
*a,
Nathan E.
Lewis
ab and
Bernhard Ø.
Palsson
a
aDepartment of Bioengineering, University of California – San Diego, La Jolla, CA 92093-0412, USA. E-mail: hyduke@ucsd.edu
bWyss Institute for Biologically Inspired Engineering and Department of Genetics, Harvard Medical School, Boston, MA, USA
First published on 13th December 2012
Abstract
Over the past decade a massive amount of research has been dedicated to generating omics data to gain insight into a variety of biological phenomena, including cancer, obesity, biofuel production, and infection. Although most of these omics data are available publicly, there is a growing concern that much of these data sit in databases without being used or fully analyzed. Statistical inference methods have been widely applied to gain insight into which genes may influence the activities of others in a given omics data set, however, they do not provide information on the underlying mechanisms or whether the interactions are direct or distal. Biochemically, genetically, and genomically consistent knowledge bases are increasingly being used to extract deeper biological knowledge and understanding from these data sets than possible by inferential methods. This improvement is largely due to knowledge bases providing a validated biological context for interpreting the data.
 Daniel R. Hyduke | Daniel R. Hyduke is a Project Scientist in the Bioengineering Department at the University of California, San Diego. His research focuses on investigating the influence of molecular economics on host/pathogen interactions, evolution of regulation, and stress responses. He is a member of the Center for the Systems Biology of Enteropathogens, has co-authored 27 peer-reviewed articles, and recipient of a Seed award from the San Diego Center for Systems Biology. He received his PhD in Chemical Engineering from the University of California, Los Angeles and was a molecular cancer research fellow at Harvard and Georgetown Universities. |
 Nathan E. Lewis | Nathan E. Lewis is a postdoctoral fellow at the Wyss Institute for Biologically Inspired Engineering and Department of Genetics at Harvard Medical School, where he is using genome editing technologies and modeling to study the biochemical properties of enzymes in metabolic networks. He also holds a BS degree in Biochemistry from Brigham Young University and a PhD in Bioengineering from the University of California, San Diego. |
 Bernhard Ø. Palsson | Bernhard Palsson is the Galetti Professor of Bioengineering at the University of California, San Diego, a member of the National Academy of Engineering, and a Fellow of both the AAAS and AAM. His research includes the development of methods to analyze metabolic dynamics, and the formulation of complete models of selected cells. He sits on the editorial board of several microbiology, bioengineering, and biotechnology journals. He has authored 40 U.S. patents, 3 books and 340 peer-reviewed articles, and is the co-founder of several biotechnology companies. He holds a PhD in Chemical Engineering from the University of Wisconsin, Madison. |
Introduction
Omics technologies have transformed molecular biology into a data-rich discipline by enabling scientists to simultaneously measure large numbers of molecular components (e.g., proteins, metabolites, and nucleic acids) that operate simultaneously through a network of interactions to generate cellular functions and phenotypic states.1 However, extraction of ‘knowledge’ from this ocean of omics has proven to be nontrivial.2 Analysis efforts are lagging for several reasons, including incompleteness of data,3 variability between experimental platforms,4 and multiple hypotheses testing with few replicates.5Two major network approaches have emerged to extract biological insight from omics data: inference-based and knowledge-based. Both approaches use an interconnected network of biological molecules to interpret omics data; however, there are crucial differences in how the networks are constructed, and therefore in the biological questions that they can answer. Inference-based approaches employ statistical methodologies to construct network models from correlation or recurring patterns in omics data (see ref. 6 and 7 for reviews). Reconstruction-based approaches are essentially 2-D genome annotation efforts8 that construct networks from biochemical and genetic data (reviewed in ref. 9 and 10). Like KEGG11 and EcoCyc,12 network reconstructions are knowledge bases of organized biochemical and genetic data. However, network reconstructions are also amenable to ready transformation into mathematical models to facilitate hypotheses generation and testing. In this perspective, our focus is on network reconstructions.
Network reconstruction employs established biochemical, genetic, and genomic data9,13 to assemble a knowledgebase of an organism's molecular components and their interactions. Although network reconstructions may be used for regulatory14 or signaling10 networks, they have enjoyed the greatest success with metabolic networks.13 This success is due to the availability of decades of legacy biochemical research in the area of metabolism and to difficulties in modeling signaling and regulation at the genome-scale.10 Metabolic network reconstructions have been employed for a range of analyses of omics data, including applications in data visualization,15 network medicine,16 deducing regulatory rules,17–19 constructing tissue-specific models,20–23 and multi-cellular modeling.24–26 More recently, we've developed a method for genome-scale modeling metabolism and macromolecular expression that supports direct analysis of a variety of omics data.27
In this work, we focus on progress in integrated analysis of omics data with functional genome-scale models of metabolism. A functional network model of metabolism is a mathematical model that is capable of simulating cellular and molecular phenotypes (Fig. 1). Two common approaches for integrating omics data with metabolic network reconstructions are: comparison of model simulations with omics data and using omics data to constrain the model and create condition- or tissue-specific models. Over the past five years, there have been significant advances in computational methods development. Now, we are at the point where we expect to see increasing applications of these methods in biological research.23,28 One of the most exciting developments, is Frezza et al.'s23 application of an integrated method to identify how a cancer cell line proliferates without a functional tricarboxylic acid (TCA) cycle (highlighted below).
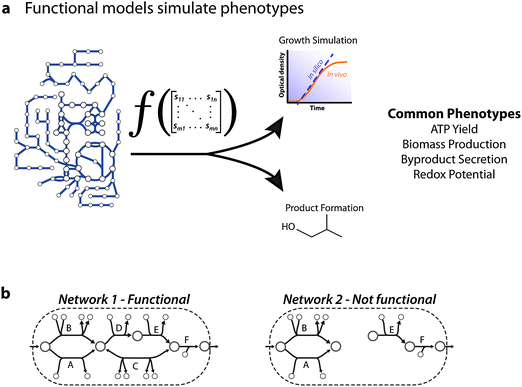 | ||
| Fig. 1 Functional network models. A network reconstruction is functional if it can be converted to a mathematical model that can compute systems level properties, i.e. phenotypes. (a) For metabolic networks, the phenotypes of interest have historically focused on production of cellular materials, growth rates, and byproducts.62 For models created for a cell type or tissue, the functional phenotype depends on the cell type and state; e.g. activated macrophages would be expected to manufacture nitric oxide. (b) A simplified example is the ability to produce an output from an input. Network 1 would be termed functional whereas Network 2 would not be functional. | ||
The major goals of this perspective are to highlight how genome-scale models derived from knowledge bases may be used to extract additional biological understanding from omics data sets and inspire novel applications of this technology to the interpretation of complex data sets. The first part covers integration of models with yeast phenomics data; and, the second part describes methods that have been developed to use omics data to guide creation of condition-specific models.
Comparing phenomics with predictions
The most direct way to analyze omics data with genome scale models of metabolism is to compare omics measurements with model topology or predictions. It is possible to compare a variety of omics data with metabolic network model simulations because the models relate genes to enzymatic activities to global phenotypes (Fig. 2a). Overlaying omics data on a functional model organizes the data in terms of underlying biochemistry (Fig. 2b). Comparing omics data with model simulations can also identify points of discord between the model and reality (Fig. 2c). Discrepancies between measurements and simulations are then used to refine our understanding of a biological process or to develop hypotheses.29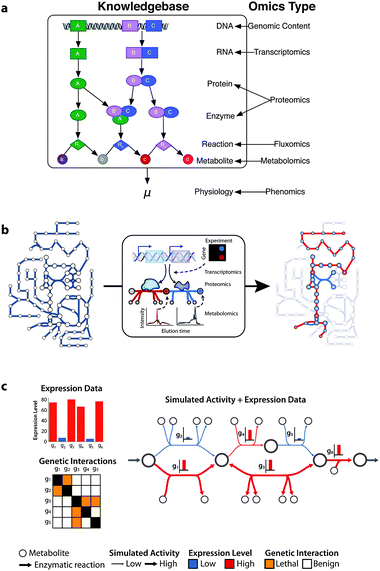 | ||
| Fig. 2 Direct comparison of omics data and models derived from metabolism knowledge bases. (a) Metabolism knowledge bases explicitly capture the relationship between genes and enzyme activities. The relationships between genomic loci, mRNAs, proteins, and enzymatic activities provide points to integrate omics data with metabolic network models. Model simulations of global phenotypes, such as specific growth rate (μ), afford the opportunity for comparison with phenomics data. (b) It is possible to overlay transcriptome, proteome, and metabolome data on a network model and gain insight into active metabolic pathways. (c) Examining omics data in the context of functional metabolic network models can direct research and provide insight. For example, when mRNA expression levels are overlaid on a model simulation we see a high expression level for gene g4 but the predicted flux for the associated reaction is relatively low. This discrepancy could be due a measurement error, g4 encoding for another unknown activity, or indicate that g4 is post-transcriptionally regulated. Examining genetic interaction data in the context of the network model reveals the underlying reason for lethalities. The double mutants Δg1Δg2, Δg3Δg4, and Δg3Δg5 are synthetic lethal pairs because they render the network non-functional. | ||
There is growing interest in using the models to predict biosynthetic and synthetic lethalities as well as identify other genetic interactions. Genome-scale models have been used widely to predict gene essentiality and more, recently, synthetic lethalities.30 Lethal interactions could serve to identify gene products as novel strategies for next generation antibiotics.31 Analysis of model predictions with high-throughput phenomic assays, such as a yeast synthetic genetic array32 (SGA), should allow us to identify possible biochemical mechanisms underlying synthetic lethal interactions and assess the accuracy of models and methods (Fig. 2c). The comparison of SGA results with model predictions, could be used to assess specific mechanistic hypotheses,33 as described below. Integrated analysis of SGA results and simulations may eventually be able to delineate a set of likely biochemical pathways responsible for observed genetic interactions.
Snitkin et al.33 asked whether combining simulations with yeast phenomics data could be used to assess two alternative pathways for raffinose consumption. In the first pathway, YBR184W ‘cleaves’ raffinose at the α-galactosidic bond resulting in galactose and sucrose that SUC2 ‘digests’ into glucose and fructose both of which are subsequently used in glycolysis. Whereas in the second pathway, there is no α-galactosidase for raffinose and SUC2 ‘digests’ raffinose into fructose and melobiose; fructose is consumed by glycolysis while melobiose must be secreted because the strain of S. cerevisiae in question is unable to metabolize melobiose.
To determine if the model could provide support for either mechanism, they simulated gene essentiality in raffinose for the wild-type (WT) model and a mutant model in which YBR184W's α-galactosidase activity was removed. Then they compared these predictions with their raffinose phenomics measurements. Interestingly, removal of the α-galactosidase activity from the model lead to the correction of 6 errors versus the WT model, thus supporting the hypothesis that YBR184W encodes an α-galactosidase activity. While an assay for α-galactosidase activity may be considered an even stronger method to test the two pathways, it may not always be possible to perform an enzyme assay. Also, this integrated approach with the model and phenomics data could be used to prioritize a large number of alternative hypotheses for biochemical validation or provide supporting evidence when a decisive assay is not available.
High-throughput genetic interaction assays can rapidly and quantitatively assess whether a mutation of a pair of genes results in a positive or negative effect compared with that expected from the individual mutants. Unfortunately, these high throughput assays do not provide hypotheses for how the interactions occur. As the genetic interactions appear to occur mostly between pathways,34 the biochemical connections underlying the interaction are not likely to be obvious.
Szappanos et al.35 used an SGA to measure the interactions of 613 metabolic genes to explore the utility of metabolic network models in investigating genetic interactions. When they analyzed the genetic interactions in the context of the model, they found that most genetic interactions occur between genes that are not within the same pathway (as previously noted34) and are not flux coupled. Unfortunately, when comparing simulated genetic interactions to their measurements they found that simulations only identified 2.8% and 12.9% of negative and positive interactions, respectively. Possible reasons for these discrepancies include, errors in the model, errors in the assay,33 inappropriate model assumptions, or lack of regulation in model. Modeling transcriptional regulation at the genome-scale has proven difficult and methods using omics data as surrogates for regulatory modeling are discussed in the next section.
Omics as surrogates for modeling regulation
Metabolic network reconstructions aim to be comprehensive repositories of biochemical data for an organism. Thus, models derived from these knowledge bases will include all possible reactions catalyzed by an organism's gene products regardless of whether they are active in a given environment. The all-inclusive nature of these knowledge bases is partially responsible for false negatives observed in gene essentiality or genetic interaction simulations.35 Biological networks have evolved a degree of robustness against perturbations that result cascading failures36 – this robustness is due, in part, to the presence of alternative compensatory pathways. However, an alternative pathway that is present in the global knowledgebase may not be accessible to the organism in the given growth medium, thus mutation of the principle pathway will result in a phenotype in vivo but not in silico. For example, if the oxygen-stable form of fumarase is mutated in an aerobic medium then the model is likely to propose the oxygen-labile form as an equivalent alternative, whereas, in reality there will be a phenotypic effect.37The regulatory apparatuses of successful organisms have evolved to express the network components that are suited to their current environment. If we knew the complete regulatory structure of an organism and how it worked then we could plausibly compute which cellular components may be expressed in a given condition; unfortunately, this isn't known even for the arguably best-studied bacterium.38 Due to stochastic effects arising from low copy numbers of regulators and enzymes,39,40 and intracellular heterogeneity, integrated models of metabolism and regulation will still be an approximation of individual cells and populations. Including probabilistic effects in genome-scale models of organisms will likely improve their predictive capabilities; however, there are significant computational hurdles that must be overcome, as illustrated by Karr et al.'s recent attempt to construct a whole-cell model.41
In the absence of experimentally elucidated regulatory rules, we can still use omics surveys in conjunction with functional models to serve as surrogates for a regulatory model, and create condition- and tissue-specific models20,21,24–26,42–45 (Fig. 3a). There are two general classes of semi-automated methods for generating condition-specific models from omics data: switch-based and valve-based (Fig. 3b). The former, loosely uses omics data to indicate the ‘presence’ of gene products in a given condition;43,44,46 whereas, the latter uses omics data as relative constraints on enzyme activities.45,47,48 Because these approaches employ different fundamental assumptions, it is possible that they will be successful in different arenas. As these methods are used and improved in prospective research their utility and limits will become clear. In the remainder of this work, we provide an overview of a few key methods and describe results from recent studies using these methods.
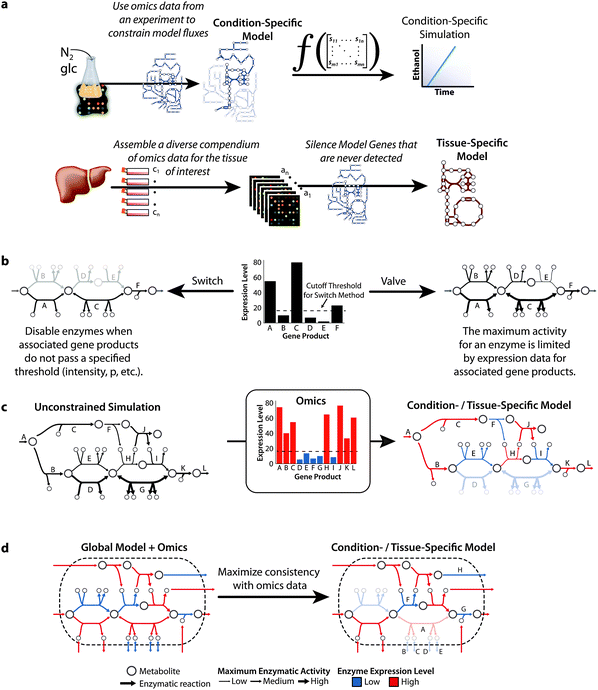 | ||
| Fig. 3 Omics data may be used as a substitute for regulatory information to guide creation of condition- and tissue-specific models. (a) Omics data are increasingly used to create condition- and tissue-specific models which may then be used to simulate specific phenotypes. Condition-specific models use omics data to limit which enzymes may participate in a specific simulation. For example, a nitrogen (N2) fixing bacterium can be expression profiled in a glucose (glc) minimal medium. These profiles are then used to identify which enzymes are expressed in the growth medium and create a condition-specific model. This condition-specific model may be used to simulate a condition-specific global phenotype, such as ethanol production. To create a tissue-specific model, it is important to assemble a compendium of omics data collected in a wide range of diverse conditions. These data are used to identify which of the organism's genes may be expressed in the tissue and create a tissue-specific model. The tissue-specific model may be used to simulate phenotypes, or used with a new omics profile to create a condition specific model. (b) The approaches for using omics data to create condition- and tissue-specific models can be classified as a switch or a valve approach. In the switch approach, omics data are used to identify which gene products should be included in the constrained model; here, the reactions catalyzed by gene products B, D, and E are disabled because their expression levels did not exceed a threshold. In the valve approach, omics data are used to limit the activities for the associated enzymes. Therefore, enzymes associated with weakly expressed genes are still able to participate in a simulation albeit to a notably reduced extent. Due to errors and noise inherent in omics data, it is possible that the model will no longer function after disabling enzyme activities; thus, it may be necessary to disregard a limited number of expression measurements when employing a switch style approach. (c) In Becker et al.,43 we used the simulation results from the unconstrained initial model to aid in identifying which expression measurements should be ignored. If an omics constrained model was be unable to simulate a specified phenotype, here the production of L from A, then we re-enabled a set of enzymes that restored the model to a functional state. If there were multiple alternative sets then the one that results in the minimum penalty score was selected. In Becker et al., the penalty score for a reaction was the product of the reaction's flux in the unconstrained model and the distance of the expression value from the cutoff. Here, enzymes E, F, and I were reenabled (over D and G) because their fluxes were much smaller. (d) In Shlomi et al.,44 the goal was to construct the smallest model that was maximally consistent with the omics data and does not contain dead end metabolites. Enzyme A is disabled despite a high expression level because it would be necessary to enable enzymes B, C, D, and E all of which had low expression levels. In spite of low expression values, enzymes F, G, and G are enabled because their activities are required for a greater number of highly expressed enzymes to be connected. Regardless of the approach, it is important to use additional types of evidence, such as biochemical literature, when available. | ||
Switch approaches
In an early attempt to integrate omics data with genome-scale models of metabolism, Akesson et al.42 deactivated enzymes if the associated gene products were not detected in transcriptome profiles. This method's major deficiency is the assumption that items that weren't detected are not false negatives; i.e., it equates undetected with unexpressed. Because omics technologies often suffer from a lack of sensitivity,5 this assumption may lead to enzymes being incorrectly disabled and result in a model that cannot simulate expected phenotypes. Along this line Akesson et al. choose to re-enable specific genes that weren't detected because they believed the measurements were false negatives. While re-enabling genes in an ad hoc fashion may be appropriate, it can be difficult to determine which genes are false negatives in an omics data set. To reduce the burden of investigating all absent calls as false negatives, we43 and Shlomi and collaborators21,44 devised semi-automated methods to determine which absent calls might be false negatives.In Becker et al.43 we used expression data to determine which reactions were active, similar to Akesson et al., however, we also included a criterion for re-enabling reactions if the model fails to simulate the global phenotype (Fig. 3c). Our method preferentially re-enables lowly expressed genes associated with low flux enzyme activities. We've used this approach to aid in constructing a variety of models.24,49–52
Shlomi et al.44 developed a method that attempts to assemble a submodel that is maximally consistent with gene expression and that does not contain any dead-end metabolites (Fig. 3d). Consistent means that the constrained model will be able to produce all metabolites and attempts to include the maximum number of enzymatic activities associated with highly expressed gene products while minimizing the number of activities associated with weakly expressed gene products. Unfortunately, this method did not perform well in an independent study:20 when Gille et al.20 created a draft model with this method44 they couldn't simulate 41% of the hepatocytes metabolic functions and noted a need for human curation of the model. Opportunely, an improved version21 of the method that attempts to leverage human insight accompanied Gille et al. This approach was subsequently applied in a theoretical study designed to identify drug targets in cancers22 and an applied study described below.
Valve approaches
Colijn et al.45 developed a method that used expression levels for a gene product as linear adjustments to the allowable flux for associated activities. Using this method to analyze publicly available transcriptome profiles collected after exposing M. tuberculosis to various inhibitors of metabolism,53 they correctly identified 7 of 8 known inhibitors for production of the virulence factor mycolic acid and a number of candidate inhibitors that represent potential therapeutics. Sorokina et al.54 applied this approach to a small scale 43-gene model of starch metabolism for the alga Ostreoccus tauri, and simulated diurnal starch and maltose production. Their simulations indicated that β-amylase and AGPase affect the ‘light’ portion of the cycle, whereas GWD, ISA1, ISA3, and α-amylase influence the dark cycle. Future biochemical validation of these predictions would be a testimony to these approaches.More recently, Chandrasekaran and Price47 developed a method that attempts to integrate knowledge of transcriptional regulatory interactions with omics data and metabolic models. In this method, a large compendium of transcriptome data is used to calculate the probability of interaction (Pint) between a transcription factor (TF) and its target genes. Where, Pint is defined as the number of transcriptomes in which a target gene and the TF in question are both expressed divided by the number of transcriptomes in which the target gene is expressed. Then, based on knowledge about the activity of the TF in a given environment, the Pint is used to constrain the maximal flux for the target gene. However, this method has not been applied independently to the extent of our knowledge.
Testing model-derived mechanisms
To date, the overwhelming majority of research in this area has been theoretical and interpretive with predictions only being validated on preexisting data. Recent work by Frezza et al.23 may portend a shift from theory to practice in the coming years. Frezza et al. were interested in identifying the mechanism through which fumarate hydratase (FH) deficient cells are able to survive. FH mutations are associated with hereditary leiomyomatosis renal cell carcinoma (HLRCC).55 FH is an enzyme of the TCA cycle and inactivating mutations in FH result in a dysfunctional TCA cycle. To determine how Fh1-deficient cells could survive without a functional TCA cycle, Frezza et al. generated immortalized Fh1−/− murine kidney cells. After creating a tissue-specific model from transcriptome data and a generic model of cancer metabolism,22 they used the model to identify which reactions were synthetic lethal pairs for FH. Their simulations identified 24 reactions, 18 of which were in a linear pathway of haem biosynthesis and degradation. To determine if the model's predictions held water, they targeted haem oxygenase 1 (Hmox1) which is an essential component of the haem pathway. When Hmox1 was silenced by short-hairpin RNAs or its activity inhibited with zinc protoporphryin (ZnPP), Fh1−/− cells showed decreased growth whereas wild-type cells were unaffected. These results indicate that targeting Hmox1 may inhibit HLRCC survival, which is precisely what they observed when they treated the HLRCC cell line UOK26256 with ZnPP. This example shows how integration of omics data with network models provides mechanistic insight into the underlying biology.Perspective
Our understanding of the functions of a gene product may be severely limited without accounting for the context provided by the organism's genome in addition to the external environment.57 In other words, we may make progress in delineating certain prominent features of a gene product, however, we may miss key features when we solely employ a reduced scope. Network reconstructions contain a biochemical description of the internal environment of an organism, thus provide a biologically-grounded context for interpreting omics data. Complementarily, omics data may be used to refine network reconstructions and ask increasingly detailed questions about the systems biochemistry of disease. It may even be possible to use single-cell omics data58,59 derived from multiple cells in a tissue, or a microbial culture, to investigate disease progression and community interactions.Since models are still being expanded, do not account for probabilistic factors,39,40 and our knowledge of biology and biochemistry is incomplete, it is premature to expect 100% consistency between a network model and omics data. For the most detailed E. coli model,60 only about 30% of the gene products are included in the model and over 1/3 of E. coli's gene products are not functionally annotated. Regardless of our lack of comprehensive biochemical annotation for an organism, it is still possible to use omics data to aid in hypothesis generation. This was the approach taken by Frezza et al.23 when they uncovered the mechanism for HLRCC survival which could be targeted in future chemotherapy.
Given that mechanistic biological knowledge may be extracted from omics data sets with reconstructed networks and the large investment that has been made in omics data sets, it is likely that we are just seeing the beginning of this approach to omics data analysis. Because these network models contain points for integration with genomics, transcriptomics, proteomic, metabolomic, and phenomic data (Fig. 2a) we anticipate that these networks will soon be used to extract biological insight from sample-matched multi-omics data sets. This approach combines the wealth of omics data with biochemical knowledge that we have on molecular components and their function and puts it in the context of all the other components used by the cell at the same time. Thus moving us beyond molecular biology to systems biology. In a larger context, this process builds genotype–phenotype relationships61 and serves to link molecular and cellular physiology. As this relationship is foundational to biology, we anticipate vigorous activity and steady progress with this approach in the coming years.
Specifically, we expect that future research will leverage the added biological detail captured in models generated using our method for modeling metabolism and macromolecular expression27 or the whole-cell modeling method of Karr et al.41 to analyze omics data because of opportunities for direct integration of various omics data types. Additionally, as computational resources improve in coming years it is likely that we will see advances in modeling approaches, such as Karr et al., that integrate probabilistic and constraints-based approaches at the genome scale.
Acknowledgements
This work was supported by the US National Institute of Allergy and Infectious Diseases and the US Department of Health and Human Services through interagency agreement Y1-AI-8401-01. D.R.H. is supported in part by a Seed Award from the San Diego Center for Systems Biology funded by NIH/NIGMS (GM085764).References
- W. Zhang, F. Li and L. Nie, Microbiology, 2010, 156, 287–301 CrossRef CAS.
- B. Palsson and K. Zengler, Nat. Chem. Biol., 2010, 6, 787–789 Search PubMed.
- N. Christian, P. May, S. Kempa, T. Handorf and O. Ebenhoh, Mol. Biosyst., 2009, 5, 1889–1903 RSC.
- L. Shi, et al. , Nat. Biotechnol., 2006, 24, 1151–1161 CrossRef CAS.
- R. Clarke, et al. , Nat. Rev. Cancer, 2008, 8, 37–49 CrossRef CAS.
- R. Bonneau, Nat. Chem. Biol., 2008, 4, 658–664 CrossRef CAS.
- R. De Smet and K. Marchal, Nat. Rev. Microbiol., 2010, 8, 717–729 CAS.
- B. Palsson, Nat. Biotechnol., 2004, 22, 1218–1219 CrossRef CAS.
- J. L. Reed, I. Famili, I. Thiele and B. O. Palsson, Nat. Rev. Genet., 2006, 7, 130–141 CrossRef CAS.
- D. R. Hyduke and B. O. Palsson, Nat. Rev. Genet., 2010, 11, 297–307 CrossRef CAS.
- M. Kanehisa and S. Goto, Nucleic Acids Res., 2000, 28, 27–30 CrossRef CAS.
- I. M. Keseler, et al. , Nucleic Acids Res., 2011, 39, D583–D590 CrossRef.
- A. M. Feist and B. O. Palsson, Nat. Biotechnol., 2008, 26, 659–667 CrossRef CAS.
- M. W. Covert, E. M. Knight, J. L. Reed, M. J. Herrgard and B. O. Palsson, Nature, 2004, 429, 92–96 CrossRef CAS.
- N. C. Duarte, et al. , Proc. Natl. Acad. Sci. U. S. A., 2007, 104, 1777–1782 CrossRef CAS.
- A. L. Barabasi, N. Gulbahce and J. Loscalzo, Nat. Rev. Genet., 2011, 12, 56–68 CrossRef CAS.
- P. Kharchenko, G. M. Church and D. Vitkup, Mol. Syst. Biol., 2005, 1, 2005.0016 CrossRef.
- K. R. Patil and J. Nielsen, Proc. Natl. Acad. Sci. U. S. A., 2005, 102, 2685–2689 CrossRef CAS.
- A. Kummel, S. Panke and M. Heinemann, Mol. Syst. Biol., 2006, 2, 2006.0034 CrossRef.
- C. Gille, et al. , Mol. Syst. Biol., 2010, 6, 411 CrossRef.
- L. Jerby, T. Shlomi and E. Ruppin, Mol. Syst. Biol., 2010, 6, 401 CrossRef.
- O. Folger, et al. , Mol. Syst. Biol., 2011, 7, 501 Search PubMed.
- C. Frezza, et al. , Nature, 2011, 477, 225–228 CrossRef CAS.
- A. Bordbar, N. E. Lewis, J. Schellenberger, B. O. Palsson and N. Jamshidi, Mol. Syst. Biol., 2010, 6, 422 CrossRef.
- N. E. Lewis, et al. , Nat. Biotechnol., 2010, 28, 1279–1285 CrossRef CAS.
- C. Huthmacher, A. Hoppe, S. Bulik and H. G. Holzhutter, BMC Syst. Biol., 2010, 4, 120 CrossRef.
- J. A. Lerman, et al. , Nat. Commun., 2012, 3, 929 CrossRef.
- L. Lobel, N. Sigal, I. Borovok, E. Ruppin and A. A. Herskovits, PLoS Genet., 2012, 8, e1002887 CAS.
- J. L. Reed, et al. , Proc. Natl. Acad. Sci. U. S. A., 2006, 103, 17480–17484 CrossRef CAS.
- M. A. Oberhardt, B. O. Palsson and J. A. Papin, Mol. Syst. Biol., 2009, 5, 320 CrossRef.
- I. Thiele, et al. , BMC Syst. Biol., 2011, 5, 8 CrossRef.
- A. H. Tong, et al. , Science, 2001, 294, 2364–2368 CrossRef CAS.
- E. S. Snitkin, et al. , Genome Biol., 2008, 9, R140 CrossRef.
- R. Kelley and T. Ideker, Nat. Biotechnol., 2005, 23, 561–566 CrossRef CAS.
- B. Szappanos, et al. , Nat. Genet., 2011, 43, 656–662 CrossRef CAS.
- A. G. Smart, L. A. Amaral and J. M. Ottino, Proc. Natl. Acad. Sci. U. S. A., 2008, 105, 13223–13228 CrossRef CAS.
- S. J. Park and R. P. Gunsalus, J. Bacteriol., 1995, 177, 6255–6262 CAS.
- B. K. Cho, et al. , Nat. Biotechnol., 2009, 27, 1043–1049 CrossRef CAS.
- J. Paulsson, O. G. Berg and M. Ehrenberg, Proc. Natl. Acad. Sci. U. S. A., 2000, 97, 7148–7153 CrossRef CAS.
- J. Stewart-Ornstein, J. S. Weissman and H. El-Samad, Mol. Cell, 2012, 45, 483–493 CrossRef CAS.
- J. R. Karr, et al. , Cell, 2012, 150, 389–401 CrossRef CAS.
- M. Akesson, J. Forster and J. Nielsen, Metab. Eng., 2004, 6, 285–293 CrossRef CAS.
- S. A. Becker and B. O. Palsson, PLoS Comput. Biol., 2008, 4, e1000082 Search PubMed.
- T. Shlomi, M. N. Cabili, M. J. Herrgard, B. O. Palsson and E. Ruppin, Nat. Biotechnol., 2008, 26, 1003–1010 CrossRef CAS.
- C. Colijn, et al. , PLoS Comput. Biol., 2009, 5, e1000489 Search PubMed.
- P. A. Jensen and J. A. Papin, Bioinformatics, 2011, 27, 541–547 CrossRef CAS.
- S. Chandrasekaran and N. D. Price, Proc. Natl. Acad. Sci. U. S. A., 2010, 107, 17845–17850 CrossRef CAS.
- R. J. van Berlo, et al. , IEEE/ACM Trans. Comput. Biol. Bioinf., 2011, 8, 206–216 CrossRef.
- R. L. Chang, L. Xie, L. Xie, P. E. Bourne and B. O. Palsson, PLoS Comput. Biol., 2010, 6, e1000938 Search PubMed.
- A. Bordbar, et al. , BMC Syst. Biol., 2011, 5, 180 CrossRef.
- S. Y. Ahn, et al. , J. Biol. Chem., 2011, 286, 31522–31531 CrossRef CAS.
- A. Bordbar, et al. , Mol. Syst. Biol., 2012, 8, 558 CrossRef.
- H. I. Boshoff, et al. , J. Biol. Chem., 2004, 279, 40174–40184 CrossRef CAS.
- O. Sorokina, et al. , BMC Syst. Biol., 2011, 5, 36 CrossRef.
- I. P. Tomlinson, et al. , Nat. Genet., 2002, 30, 406–410 CrossRef CAS.
- Y. Yang, et al. , Cancer Genet. Cytogenet., 2010, 196, 45–55 CrossRef CAS.
- S. A. Kauffman, Reinventing the sacred: a new view of science, reason and religion, Basic Books, New York, 2008 Search PubMed.
- F. Tang, et al. , Nat. Methods, 2009, 6, 377–382 CrossRef CAS.
- Y. Kang, et al. , Genome Res., 2011, 21, 925–935 CrossRef CAS.
- J. D. Orth, et al. , Mol. Syst. Biol., 2011, 7, 535 CrossRef.
- B. Palsson, FEBS Lett., 2009, 583, 3900–3904 CrossRef CAS.
- J. M. Otero and J. Nielsen, Biotechnol. Bioeng., 2010, 105, 439–460 CrossRef CAS.
| This journal is © The Royal Society of Chemistry 2013 |