Research highlights
Hojae
Bae
a,
Šeila
Selimović
bc,
Mehmet R.
Dokmeci
bc and
Ali
Khademhosseini
*bcde
aCollege of Animal Bioscience and Technology, Department of Bioindustrial Technologies, Konkuk University, Hwayang-dong, Kwangjin-gu, Seoul 143-701, Republic of Korea
bCenter for Biomedical Engineering, Department of Medicine, Brigham and Women's Hospital, Harvard Medical School, Cambridge, Massachusetts 02139, USA. E-mail: alik@rics.bwh.harvard.edu
cHarvard-MIT Division of Health Sciences and Technology, Massachusetts Institute of Technology, Cambridge, Massachusetts 02139, USA
dWyss Institute for Biologically Inspired Engineering, Harvard University, Boston, Massachusetts 02115, USA
eWorld Premier International – Advanced Institute for Materials Research (WPI-AIMR), Tohoku University, Sendai 980-8577, Japan
First published on 24th July 2013
Paper-based sickle cell disease test
Sickle cell disease (SCD) is one of the most common hereditary disorders caused by a point mutation in hemoglobin (Hb) from the red blood cell. A person with the sickle-cell allele produces abnormal Hb proteins that link together, making the normal disk-shaped red blood cells deform to a sickle shape. Once formed, these abnormal cells are rapidly destroyed by the body. However, angular sickled cells can often accumulate and clog blood vessels, resulting in multiple symptoms such as anemia, periodic fever, pain, and potentially damaging various organs. In most cases, only individuals who are homozygous for the sickle-cell allele (genotype Hb SS) develop sickle cell anemia, while heterozygotes (genotype Hb AS) are considered healthy and are said to carry the sickle cell trait (SCT). Other, rarer forms of SCD exist through mutations or reduced/eliminated production of β globin (genotypes Hb SC, Hb SE, Hb Sβ+ or Hb Sβ0).In Africa, over 50% of children born with SCD die due to a lack of early diagnosis and treatment. In contrast, most children born with SCD in the United States survive, since universal SCD screening is available. However, these screenings require centralized laboratories equipped with specialized instruments, costly consumables, and specialists that are often unavailable in low-income developing countries where SCD is most prevalent. Moreover, the transfer of blood samples to a centralized laboratory makes a definitive diagnosis of SCD nearly impossible in emergency situations. Hence, patients with pain due to SCD vaso-occlusive crisis are not treated properly or receive delayed medical care, and are often stigmatized as drug-seekers. Therefore, a rapid test method is required for the point-of-care diagnosis of SCD.
Conventionally, the insolubility of deoxy-Hb S in concentrated phosphate buffers has been employed as a simple, low-cost qualitative method for visual confirmation of SCD. However, this method is not capable of distinguishing between SCT and SCD blood samples. Alternative analysis methods addressing this limitation employ multi-step sample preparation and processing procedures on costly specialized instruments, making the diagnosis significantly impractical in resource-limited environments and emergency settings.
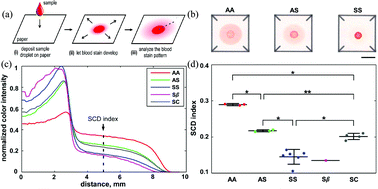
In a recent work, Yang et al.1 developed a simple, rapid and inexpensive diagnostic test for SCD capable of distinguishing between blood samples from normal individuals, SCT carriers, and SCD patients. This test is based on a characteristic blood stain formed on a paper-based assay. Specifically, when a drop of blood is deposited onto chromatography paper, the soluble Hb S can permeate through the paper relatively freely whereas the insoluble, polymerized Hb S becomes entangled in the meshed network (Fig. 1a).
 | ||
| Fig. 1 The basic concept of the paper-based assay as well as the normalized color intensity profiles and values. (a) A drop of blood and phosphate buffer mixture were deposited onto the paper substrate. (b) Drops of blood from Hb AA, Hb AS and Hb SS patients formed disease specific blood stains. (c) Normalized color intensity profiles of tested samples by the total area under the curve. (d) The normalized color intensity value at 5 mm for tested samples. Colored circles indicate individual blood samples from different donors: AA, AS, SS, Sβ, and SC. The quantification of the color intensity was used to determine the SCD index. Figure reprinted with permission from the Royal Society of Chemistry from Yang et al.1 | ||
The difference in pattern of the resulting blood stain is therefore seen as indication of the Hb content, enabling a simple, visual differentiation between the normal (Hb AA), SCT (Hb AS), and SCD (Hb SS) blood samples (Fig. 1b). Yang et al. showed that the color of the Hb AA stain was nearly uniform, with a slight dark contour outlining the center spot. The center spot of the Hb AS sample was significantly darker and the pink periphery ring was lighter. In the case of Hb SS, which has the highest content of insoluble Hb S and the lowest content of soluble Hb, the center spot was the darkest of the three blood samples and the pink periphery ring was barely visible.
These color differences were used to conclusively distinguish between the blood samples from normal, SCT, and SCD samples. The normalized color intensity profiles were calculated (Fig. 1c) and then averaged over all subjects (Hb AA, Hb AS, Hb SS, Hb Sβ+, Hb SC). The normalized color intensity at a distance of 5 mm from the center of the stain (SCD index) was highly consistent and showed the most obvious difference between the groups. This SCD index (the fraction of Hb in the sample that remains soluble when deoxygenated in phosphate buffer) was then used as a quantitative measure to compare samples among Hb genotypes (Fig. 1d). From this measure, it was possible to accurately distinguish between most samples, only Hb Sβ+ was indistinguishable from Hb SS due to high Hb S content in both of these blood samples.
This novel paper-based SCD test is capable of visually distinguishing between SCT and SCD samples in a simple, rapid, and cost-effective manner at the point of care. Importantly, this paper microfluidic screening tool could potentially be useful as a universal SCD screening platform in resource-limited environments, such as rural and developing areas and emergency situations.
Nanoscale magnetic traps for rapid isolation
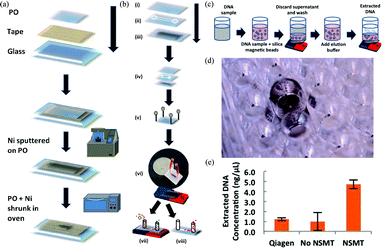
Fluorescence and magnetic activated cell sorting (FACS and MACS, respectively) are the most common separation methods employed in medical diagnostics, research, and cell-based therapeutics. However, FACS has a limitation in throughput speed (typically 104 to 105 events per second), and dilute samples are difficult to sort. Immunomagnetic-based MACS has the advantage of collecting the target cells all at once through parallel sorting, but the small magnetic moment results in long sorting times, and rare cell isolation in dilute sample is difficult to achieve. To address these limitations, microfluidic devices have been developed enabling reduced sample volumes and faster analysis. However, a disadvantage of these devices is the small field gradients, which result in low throughput. To improve the device performance, ferromagnetic materials have been integrated into the microfluidics at the nano- and microscale. Despite this improvement, studies have shown that only low throughput separations could be achieved, requiring relatively large sample volumes.Recently, Nawarathna et al.2 have developed a microfluidic device integrated with nanoscale magnetic traps (NSMTs) on a shape memory polyolefin (PO) polymer. First, the NSMTs were fabricated and characterized for optimum magnetic field generation (Fig. 2a). Briefly, a thin Ni film (either 30 nm or 1 nm) was deposited on the clean PO using an ion beam sputter coater and heated to 155 °C, which increased the stiffness of the Ni film. Then, the NSMT was characterized by scanning electron microscopy (SEM), energy-dispersive X-ray spectroscopy (EDX), superconducting quantum interference device (SQUID), and magnetic force microscopy (MFM) to analyze the surface property, element identification, and the magnetic properties. Through this characterization step, an external magnetic field of 0.1 T was found to give an optimal signal to noise ratio. Furthermore, atomic force microscopy (AFM) analysis confirmed the clear correlation between MFM signal and topography. Next, the magnetic field gradient and gradient variation were simulated to determine the optimal nanostructure dimensions (shapes, sizes, spacings, and width). Finally, the collected information was used to fabricate a highly efficient, tri-layer microfluidic device (Fig. 2b) with a top PO layer, a channel layer, and a bottom NSMT layer.
 | ||
| Fig. 2 Schematics showing fabrication of NSMTs, NSMT integrated microfluidic device, and DNA extraction using NSMTs for qPCR. (a) NSMT preparation. (b) Microfluidic device fabrication steps. (c) Application of NSMT in 96 well plate format for DNA extraction. (d) Actual image of NSMT at the bottom of 96 well plate. (e) Extracted DNA concentration versus the Qiagen control. Figure reprinted with permission from Nawarathna et al.2 | ||
The device can operate in two modes: extraction and collection. In the first mode, an external magnet positioned under the device magnetizes the NSMT, creating a strong, localized magnetophoretic force. It traps the magnetic beads as they flow across the NSMT in the channel. These beads are then extracted by first removing the external magnet and then flowing the collection buffer.
To validate device fidelity and purity performance, experiments were conducted using a mixture of fluorescently labeled magnetic and polystyrene beads. This initial experiment demonstrated that high purity, enrichment, and recovery were possible even for the most dilute (0.001%) samples at various flow rates. Further tests focused on the efficacy of DNA extraction with magnetic beads in a 96 well format under static conditions (Fig. 2c). The extraction performance of NSMT was compared with the commercially available gold standard (Qiagen QIAmp DNA Mini Kit), showing that the NSMT extracted ~44% of the pure DNA while the Qiagen kit only extracted ~10% as confirmed by the critical threshold (CT) values from qPCR. Although even 44% is low, considering the small volumes and high cost of the samples, this result is significant, as many biological preparation processes rely on well plates for the ease of use. Furthermore, this NSMT based platform could potentially be amended for other magnetic based applications such as immunomagnetic cell separation. Another advantage is that the NSMT can easily be integrated into other microfluidic components for various applications that enables configurable low cost and effective sorting.
Paper immunosensor for early diagnostics
Recent advances in biotechnology are quickly replacing traditional crop-raising programs in order to increase the productivity of agriculturally important plants and meet the requirements of a fast growing world population.3 Despite significant increases in overall productivity, plant pathogens are still a considerable threat in farming and can cause widespread crop damage, potentially affecting the related economy. Soybean, for example, is one of the most important plants in the food chain production for human and animal diet, and is affected by Asian soybean rust fungus, which in 2003/2004 in Brazil caused a loss of more than 1 billion US dollars. In such cases, early detection of a pathogen is crucial in order to isolate the infected crop and avoid further contamination.The conventional screening for Asian soybean rust involves a visual inspection of the plant leaves and then sending a sample for biochemical analysis at a centralized laboratory. This method is imprecise and time consuming, and requires specialized equipment and skilled operators. Moreover, since the extent of the damage depends on the locale (e.g. the warm climate of tropical and subtropical regions facilitates fungal growth), a simple, quick, and point-of-care (POC) screening test is required to avoid aggressive treatment steps.
To this end, Miranda et al.4 improved currently available paper-based analytical devices using antibody (Ab) conjugated gold nanoparticles for early detection. The current detection limit of commercially available devices is 3000 spores in a 1 square inch sample, which indicates the advanced stage of the disease. Therefore, a higher sensitivity device was developed that utilizes fluorescent nanoparticles. Those nanoparticles can be detected with a hand-held UV lamp directly at the POC site.
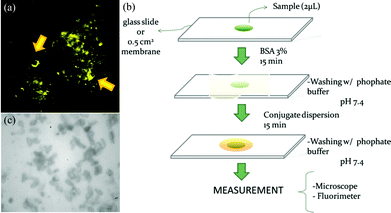
Two crucial components – the fluorescent nanoparticles and the microscope assay – were optimized prior to device development. Nanoparticles absorbing and emitting at 540/560 nm, were chosen for the anti-spore Ab to prevent interference with fluorescence from the spore itself. Moreover, nanoparticles that concentrate organic dye inside of a polystyrene matrix were used to ensure photostability and higher fluorescence signal for field applications. As shown in Fig. 3a, confocal microscope scanning with different wavelength filters indicated that the analyte labeled with antibody coated nanoparticles resulted in a high spore specific signal intensity.
 | ||
| Fig. 3 Confocal image of labelled spores, the paper-based immunoassay steps for soybean rust detection, and an image of spore attachment on nitrocellulose membrane. (a) Fluorescence image of spores labelled with antibody coated nanoparticles and excited with a 543 nm laser. (b) Schematic showing the vegetal extract sample deposition on a membrane, blocking step with albumin, and spore identification with fluorescent nanoparticles coated with anti-spore antibodies for Asian soybean rust. (c) An optical image of nitrocellulose membrane tested for spore attachment. Figure reprinted with permission from Miranda et al.4 | ||
The assay device was developed as shown in Fig. 3b. Briefly, 2 μL of vegetal extract from an infected sample was dispensed on a nitrocellulose membrane (Fig. 3c), as this material showed the highest and most stable spore retention among various substrate candidates (cellulose, cellulose acetate, nitrocellulose). After the spores that were contained in the vegetal extract attached to the surface, albumin solution was added to reduce the background signal. Then the fluorescent nanoparticles coated with anti-spore Ab against the Asian soybean rust were applied.
Using this device, the linear range and the detection limit were determined. The analytical results showed that the fluorescence signal varied linearly with the log of spore concentration. The detection limit was found to be 2.2 ng mL−1, which corresponds to 8–12 spores per mL – the lowest detection limit reported to date. Moreover, this limit is comparable to ELISA and PCR tests and more than one thousand times lower than any commercial kits.
Finally, the device was tested in the field. The spores were visible to the naked eye under UV light, at a concentration of 60 ng mL−1 in 95% of the tested samples. This is still ten times lower than the limit of detection of commercial kits. Thus, this simple diagnostic device provides farmers with a true/false test within minutes, is affordable, and can be easily handled by non-experts.
References
- X. Yang, J. Kanter, N. Z. Piety, M. S. Benton, S. M. Vignes and S. S. Shevkoplyas, Lab Chip, 2013, 13, 1464–1467 RSC.
- D. Nawarathna, N. Norouzi, J. McLane, H. Sharma, N. Sharac, T. Grant, A. Chen, S. Strayer, R. Ragan and M. Khine, Appl. Phys. Lett., 2013, 102, 063504–063505 CrossRef.
- F. Baysal-Gurel, M. L. L. Ivey, A. Dorrance, D. Luster, R. Frederick, J. Czarnecki, M. Boehm and S. A. Miller, Plant Dis., 2008, 92, 1387–1393 CrossRef.
- B. S. Miranda, E. M. Linares, S. Thalhammer and L. T. Kubota, Biosens. Bioelectron., 2013, 45, 123–128 CrossRef CAS.
| This journal is © The Royal Society of Chemistry 2013 |
