 Open Access Article
Creative Commons Attribution 3.0 Unported Licence
Microreactors with integrated UV/Vis spectroscopic detection for online process analysis under segmented flow
Jun
Yue
a,
Floris H.
Falke
b,
Jaap C.
Schouten
a and
T. Alexander
Nijhuis
*a
aLaboratory of Chemical Reactor Engineering, Department of Chemical Engineering and Chemistry, Eindhoven University of Technology, P.O. Box 513, 5600 MB Eindhoven, The Netherlands. E-mail: T.A.Nijhuis@tue.nl; Tel: +31 40 247 3671
bLioniX B.V., Enschede 7522, The Netherlands
First published on 11th October 2013
Abstract
Combining reaction and detection in multiphase microfluidic flow is becoming increasingly important for accelerating process development in microreactors. We report the coupling of UV/Vis spectroscopy with microreactors for online process analysis under segmented flow conditions. Two integration schemes are presented: one uses a cross-type flow-through cell subsequent to a capillary microreactor for detection in the transmission mode; the other uses embedded waveguides on a microfluidic chip for detection in the evanescent wave field. Model experiments reveal the capabilities of the integrated systems in real-time concentration measurements and segmented flow characterization. The application of such integration for process analysis during gold nanoparticle synthesis is demonstrated, showing its great potential in process monitoring in microreactors operated under segmented flow.
Introduction
During the past decade, microreactors have been increasingly utilized on the laboratory scale for developing novel chemical transformations that are more sustainable than the existing routes and for producing materials with desirable structures/properties hardly accessible using conventional techniques.1–6 The use of microreactors offers many advantages for chemical production including advanced process control (e.g., well-defined flow pattern, uniform temperature distribution, fast response, and increased safety) and substantial process intensification (e.g. enhanced mass transport and improved chemistry).7,8 In this field, there is a continuous requirement for the integration of process analytical tools with microreactors, which will allow for real-time analysis and subsequently lead to a faster and often more reliable process optimization as compared to the cases with only off-line analysis.9,10We have recently reviewed the current research status on the integration of spectroscopic detection for online reaction monitoring in microreactors.11 The majority of the integrated systems are for homogeneous liquid-phase reactions and only a few are for analyzing multiphase reactions. In the latter case, one option for online spectroscopic analysis is detection in a flow-through cell after continuous phase separation, as was done by Steinfeldt et al. for monitoring the ozonolysis of 1-decene in a falling film microreactor12 and by Keybl and Jensen for investigating the rhodium-catalyzed gas–liquid hydroformylation of 1-octene in a microreactor operated under segmented flow conditons,13 both using infrared spectroscopy. In the above two reaction cases, only the liquid samples obtained after phase separation were continuously monitored. A more advanced option is to perform a direct spectroscopic analysis of the immiscible reaction mixture.14–19 This has been typically realized by free-space microscopic inspection of fluorescence or infrared signals inside droplets moving along the microreactor,15,16 and by the out-of-plane or in-plane integration of optical fibers to enable ultraviolet/visible (UV/Vis) or Raman inspection of a segmented flow therein.17–19 This advanced option eliminates the need for continuous phase separation before detection and makes it further possible to follow the reaction progress along the microreactor. The development of such an integration scheme is not trivial, requiring an understanding of the interplay between hydrodynamics in microreactors and the spectroscopic measurement principles. As many reactions of commercial interest involve the presence of two immiscible phases (gas–liquid or liquid–liquid) and can benefit substantially from segmented flow processing in microreactors,20–23 research addressing online spectroscopic analysis in such microreactor processes is of great importance.
Herein, we report the coupling of UV/Vis spectroscopy with microreactors (chips and capillary-based) for online process analysis under gas–liquid and liquid–liquid segmented flow conditions. Two integration schemes are presented. One features the use of a cross-type flow-through cell subsequent to a capillary microreactor to enable detection in the transmission mode, and the other utilizes monolithically integrated waveguides within a microfluidic chip for absorbance detection in the evanescent wave field. Model experiments reveal the capabilities of these integrated systems in concentration measurements and/or segmented flow characterization. It is further shown that the development of an effective scheme of integration between UV/Vis spectroscopy and microreactors for monitoring reactions/operations under segmented flow cannot be solely based on the current knowledge well established for real-time spectroscopic detection in microfluidic devices under single-phase flow.24–26 In particular, to fully resolve a droplet or a liquid slug within a segmented flow on the UV/Vis spectrum, as required by concentration measurements, spectroscopic cell designs different from those developed in the case of microfluidic single-phase flow scenarios usually have to be considered, and spectral acquisition has to be made at high time resolution.
In this work, the utilization of the developed integration schemes is also demonstrated for assisting process analysis during the synthesis of gold nanoparticles (AuNPs) which hold great promise for applications in biology, nanotechnology and catalysis.27–29 The wet-chemical synthesis of AuNPs in the aqueous phase has been successfully demonstrated by many authors in microreactors in which an inert gas or an immiscible liquid was introduced to create a segmented flow to achieve narrow size distribution and to prevent fouling on the reactor wall.30–33 In this upcoming research field, the integration of online UV/Vis inspection would be the priority in the coming years, which allows for a fast indication of the average particle size and concentration leading to a better optimization and analysis of the synthetic process in microreactors.5 The present work is among the first to address real-time detection in a microfluidic segmented flow-based process for AuNP synthesis.
Experimental
Integration of UV/Vis spectroscopic detection with the capillary microreactor
Fig. 1a depicts briefly the experimental design for the coupling of a capillary microreactor with a cross-type flow-through cell. An immiscible gas–liquid or liquid–liquid segmented flow was generated in a polytetrafluoroethylene (PTFE) capillary microreactor using a polyetheretherketone (PEEK) mixer with a cross-type junction having a through hole of 1.25 mm. The capillary microreactor is 20 cm long and has an inner diameter (dC) of 0.75 mm. The liquids were delivered using two types of syringe pumps (100 DM, Teledyne Isco; NE-1000, New Era Pump Systems). The gas was delivered from a cylinder, and its flow rate was regulated by a mass flow controller (EL-Flow, Bronkhorst). The capillary microreactor was then connected to the inlet of a PEEK flow-through cell which has a cross-type junction with an inner diameter of 0.75 mm as well. The outlet of the cell on the opposite side was used to discharge the immiscible mixture to the downstream separation step. The two ports of the cell in a configuration perpendicular to the incoming flow direction interfaced with two multimode optical fibers (cf.Fig. 1b as well), where one fiber introduced the light from a tungsten halogen lamp (LS-1-LL, Ocean Optics) into the cell and the other fiber guided the transmitted light through the mixture to a UV/Vis spectrometer (AvaSpec-Dual, Avantes). The flow image in the capillary microreactor was captured with a digital camera. All the experiments were carried out under ambient conditions.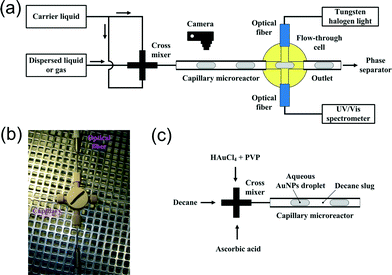 | ||
| Fig. 1 (a) Schematic illustration of the integration of a cross-type flow-through cell for UV/Vis spectroscopic analysis within a gas–liquid or liquid–liquid segmented flow through a capillary microreactor. (b) Photo of the cell with fluidic and optical connections. (c) Schematic illustration of segmented flow generation for AuNP synthesis in the capillary microreactor. | ||
Decane–water and nitrogen–water flows were first investigated to show the capability of the integrated system in segmented flow characterization, with the flow rate of each phase varying from 0.1 to 0.8 ml min−1. Decane–aqueous solution and nitrogen–aqueous solution flows were then carried out to calibrate the flow-through cell for concentration measurements, the flow rate of each phase being fixed at 0.2 ml min−1. The aqueous solution contained 0.02–1 M Co(NO3)2.
Online UV/Vis analysis of AuNPs produced in the capillary microreactor
The wet-chemical synthesis of AuNPs was carried out in the described capillary microreactor (Fig. 1c). AuNPs were produced in the aqueous droplet within a segmented flow via a reaction between HAuCl4 and ascorbic acid in the presence of polyvinylpyrrolidone (PVP) as a stabilizing agent. Decane was used as the carrier phase to promote mixing in the aqueous phase and to prevent fouling on the microreactor wall.The setup is the same as that shown in Fig. 1a, except for the arrangement of fluids with the cross mixer. As schematically illustrated in Fig. 1c, decane flowed into the central inlet of the mixer. Two aqueous solutions were fed into the two side inlets, containing the gold precursor (1 mM HAuCl4 + 0.025 wt% PVP) and the reducing agent (20 mM ascorbic acid), respectively. The segmented flow was then created in the 20 cm long PTFE capillary microreactor (dC = 0.75 mm) under a decane/gold precursor/reducing agent flow ratio of 2![[thin space (1/6-em)]](https://www.rsc.org/images/entities/char_2009.gif) :
:![[thin space (1/6-em)]](https://www.rsc.org/images/entities/char_2009.gif) 1
1![[thin space (1/6-em)]](https://www.rsc.org/images/entities/char_2009.gif) :
:![[thin space (1/6-em)]](https://www.rsc.org/images/entities/char_2009.gif) 1. The total flow rate of the two phases ranged from 0.4 to 0.8 ml min−1. The UV/Vis absorption spectrum of the AuNP solution in the subsequent cross-type flow-through cell was obtained through a comparison with the reference spectrum of decane–water flow.
1. The total flow rate of the two phases ranged from 0.4 to 0.8 ml min−1. The UV/Vis absorption spectrum of the AuNP solution in the subsequent cross-type flow-through cell was obtained through a comparison with the reference spectrum of decane–water flow.
UV/Vis detection in the microfluidic chip
A microfluidic chip with monolithically integrated waveguides is also investigated with regard to online UV/Vis detection under segmented flow conditions (Fig. 2a). Within the chip, the fluid is transported through a U-type microchannel etched in fused silica. The cross-sectional shape of the fluidic microchannel is nearly rectangular with round side walls (340 μm wide, 20 μm deep and 4.3 cm long). Three sensing areas with different path lengths (l = 1–5 mm) are arranged axially along the microchannel (Fig. 2b), providing local contact between the fluid and a silicon nitride (Si3N4) waveguide (Fig. 2c). In this area (i.e., the sensing window), the top SiO2 cladding above the waveguide is removed, allowing the evanescent field of the light that propagates through the waveguide to interact with the fluid (Fig. 2d). This chip is designed for handling wavelengths from 488 to 635 nm.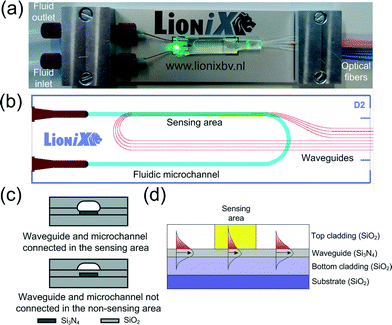 | ||
| Fig. 2 Microfluidic chip with monolithically integrated waveguides for absorbance detection in the evanescent wave field. (a) Photo of the chip assembly with laser turned on. The rightmost blue and orange optical fibers are of single mode and interfaced with on-chip waveguides for introducing and receiving laser light to and from the chip, respectively. (b) Chip design. One waveguide is not in contact with the fluid defining the reference sensing area. The other three waveguides define the sensing areas with path lengths at 1 mm, 2.5 mm and 5 mm. (c) Cut view of waveguide and microchannel. (d) Cross section of a waveguide with evanescent field interaction. | ||
The chip design was realized using the TriPleX waveguide technology (developed and supplied by LioniX B.V.) which is based on a balanced stack of alternating SiO2 and Si3N4 layers fabricated using low pressure chemical vapour deposition (LPCVD) equipment.33 The entire fabrication process of the chip is schematically depicted in Fig. 3. As shown in Fig. 3a, the fabrication of the waveguide starts with a 500 μm thick fused silica wafer, on top of which a Si3N4 layer was deposited. The photoresist was then patterned with the waveguide structures using an EVG 620 mask aligner. The patterns were transferred into the Si3N4 layer (in this case depicted as a single layer for simplicity) using a reactive ion etching (RIE) process. After the removal of the photoresist, a top cladding of a 6 μm silicon dioxide (LPCVD SiO2) layer was deposited and polished. It is worth mentioning that the fused silica wafer serves as the substrate as well as the bottom cladding. Fig. 3b shows the fabrication sequences for opening the sensing window above the waveguide. The top oxide cladding in the exposed areas of the photoresist was carefully removed from the waveguide using a buffered HF etching solution. The fabrication of the fluidic microchannel is shown in Fig. 3c. In this case, 50% HF was used to wet etch the microchannel structures in the opposite oxide wafer. Fig. 3d shows the cross section of the fluidic microchannel with the waveguide in the sensing and non-sensing areas after the thermal bonding of both wafers. The thickness of the Si3N4 layer is about 65 nm in the sensing area but was varied over the SiO2 substrate in the non-sensing area in order to achieve the optimal propagation conditions.
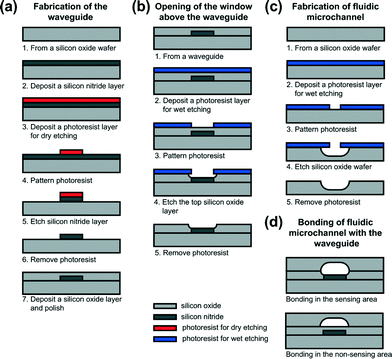 | ||
| Fig. 3 Schematic illustration of the fabrication process for the microfluidic chip. Component sizes are not to scale. | ||
The fabricated chip was packaged to provide external optical and fluidic connections (see a photo of the chip assembly in Fig. 2a). Using a powder blasting step, two cavities fed with both ends of the fluidic microchannel were produced in the SiO2 substrate before the bonding process. After bonding and dicing, glass tubes (inner diameter: 200 μm; outer diameter: 350 μm) were inserted into the two cavities on the chip and fixed by epoxy glue. An optical fiber array was aligned to the waveguides on the chip and fixed using a UV-curable glue. The chip was then attached onto an aluminium backplate. Both the fibers and glass tubes were fixed onto the same backplate using aluminium blocks, where one block functions as the fluidic adapter to standardized connectors.
We have performed spectroscopic analysis of nitrogen–water segmented flow in this microfluidic chip. As fluid mixing structure has not been considered in the current chip design yet, a segmented flow of nitrogen–water was first generated in an external PTFE capillary of 0.75 mm inner diameter using a Tee mixer and then introduced into the chip for analysis (details not shown here for brevity). The flow rate of each phase was in a range from 10 to 20 μl min−1. A 532 nm visible light from a multi-colour laser source (Hyperion-B, XiO Photonics B.V.) was coupled into the chip via one of a set of two fibers that interfaced with the waveguide defining a path length of 1 mm, and the output light signal from the chip was guided through the other fiber to a UV/Vis spectrometer (AvaSpec-Dual, Avantes) for detection.
Results and discussion
The capillary microreactor: segmented flow characterization and concentration measurements
We tested decane–water and nitrogen–water segmented flows through the PTFE capillary microreactor. Representative flow images in the microreactor are shown in Fig. 4. As PTFE is less wetted by water than by decane (a contact angle of around 110° was found for water on the PTFE surface in contrast to a contact angle of around 40° in the case of decane34), decane was seen as the carrier phase with encapsulated water droplets, the length of which is normally several times the capillary diameter (Fig. 4a). For nitrogen–water segmented flow, the front and rear ends of a nitrogen bubble were concave in shape due to the hydrophobic nature of PTFE with water, implying the absence of a liquid film surrounding the bubble body (Fig. 4b). This is in contrast to the decane–water segmented flow in which the water droplet ends were convex in shape and thus a liquid film was present between the droplet and the capillary microreactor wall due to the good wetting of PTFE by decane.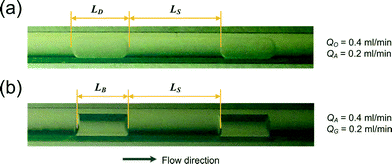 | ||
| Fig. 4 Images of segmented flow in the capillary microreactor. (a) Decane–water flow. (b) Nitrogen–water flow. QO, QA and QG are the flow rates of the organic, aqueous, and gas phases, respectively. LD, LS and LB are the lengths of a droplet, a liquid slug and a bubble, respectively. | ||
Fig. 5a and b reveal that the segmented flow in the cross-type flow-through cell is visible on the UV/Vis spectrum which shows a periodic light intensity pattern over time at a given wavelength (λ) characterized by two distinct plateaus with spikes in between. In one cycle, the high plateau signal corresponds to the body of the carrier liquid. The low plateau signal corresponds to the body of bubbles or droplets, which is due to the reflectance of the incident light on the two-phase interface causing a drop in the transmitted light intensity. Such drop is more significant during nitrogen–water segmented flow as the difference in the refractive indices between the two phases is much larger than that during decane–water segmented flow (the refractive indices being about 1, 1.33 and 1.41 for nitrogen, water and decane, respectively), allowing more chances for total internal reflection on the gas–liquid interface. Note that in the current cell design, a nitrogen bubble was surrounded by the aqueous phase when it passed the detection point due to the filling of the sensing path by liquid, which will be discussed later. The spikes in between the two plateaus indicate the arrival of the front or back position of a bubble or a droplet, the shape of which could be due to the complicated beam path on the curved interface (refraction and reflection).35,36
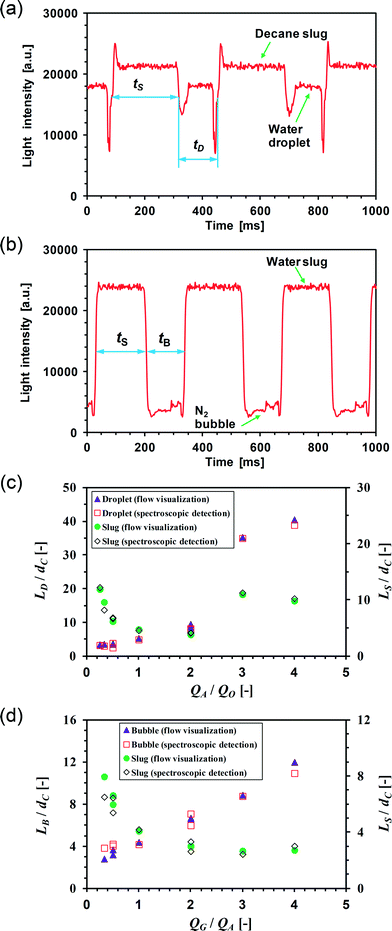 | ||
| Fig. 5 Spectroscopic detection for segmented flow characterization in the capillary microreactor. Spectra were obtained at a light wavelength of 500 nm and an integration time of 2 ms. (a) Spectrum obtained in the cross-type flow-through cell for decane–water segmented flow. QO = 0.4 ml min−1, QA = 0.2 ml min−1. (b) Spectrum obtained in the cell for nitrogen–water segmented flow, QA = 0.4 ml min−1, QG = 0.2 ml min−1. (c) Comparison between segmented flow details measured from flow visualization and spectroscopic detection for decane–water flow. QA and QO are in the range of 0.1–0.8 ml min−1. (d) Comparison of segmented flow details for nitrogen–water flow. QG and QA are in the range of 0.1–0.8 ml min−1. | ||
The segmented flow remains essentially unchanged during flow from the capillary microreactor to the subsequent flow-through cell since there is no variation in the internal channel size and the influence of the wall material change from PTFE to PEEK is negligible given the very short fluid path in the cell (about 7 mm) (cf.Fig. 1a). This allowed us to use UV/Vis measurements to infer segmented flow details in the capillary microreactor. We measured the lengths of bubbles, droplets and slugs within the gas–liquid or liquid–liquid segmented flow in the capillary microreactor from the captured flow images (cf.Fig. 4) and compared them with the results of UV/Vis measurements in the flow-through cell from which the lengths can be also estimated by
| Li = 4tiQM/πdC2 | (1) |
Here QM is the mixture flow rate (QM = QO + QA for decane–water flow; QM = QG + QA for nitrogen–water flow). The subscript i = D (droplet), S (slug) or B (bubble). tD, tS and tB are the times needed to pass the detection point for a droplet, a liquid slug, and a bubble, respectively. These time parameters were estimated from the spectrum by measuring the time interval in a periodic cycle for each phase at an average intensity level between the maximum and minimum ones (cf.Fig. 5a and b). The estimation of length parameters here is based on the assumption that the bubble or droplet velocity is equal to the mixture flow velocity given the small capillary numbers involved (<0.001) at which the liquid film surrounding the bubble/droplet body (if present) is negligibly thin.37 A good agreement was found between these lengths inferred by UV/Vis measurements and those measured from the flow images in the capillary microreactor (Fig. 5c and d).
We calibrated the cross-type flow-through cell for concentration measurements under segmented flows of nitrogen–aqueous phase and decane–aqueous phase. Co(NO3)2 solution was used as the aqueous phase exhibiting an absorption maximum at λ ≈ 500 nm. The intensity of the light after it passed through the aqueous Co(NO3)2 solution (I) and the pure water phase (I0) could be inferred from the respective spectra obtained under each segmented flow condition (i.e., I refers to the light intensity level associated with the aqueous Co(NO3)2 droplet or slug within a segmented flow; I0 refers to the light intensity level associated with the water droplet or slug in the reference case of nitrogen–water or decane–water segmented flow, as exemplified in Fig. 5a and b). Then the absorbance (A) could be calculated from
| A = −log(I/I0) | (2) |
Fig. 6a plots the absorbance as a function of the Co(NO3)2 molar concentration (c). The linear dependence between A and c is well fitted by the Lambert–Beer law described by
| A = εlc = αc | (3) |
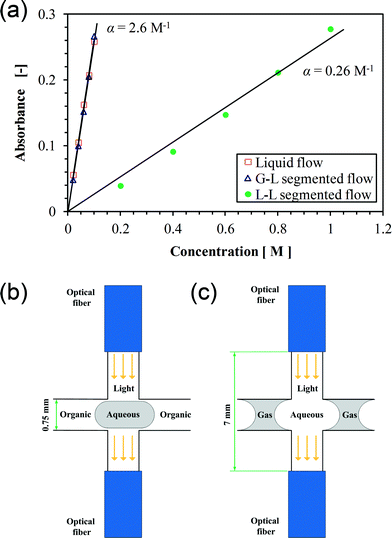 | ||
| Fig. 6 Calibration of the cross-type flow-through cell for concentration measurements. (a) Absorbance as a function of the Co(NO3)2 concentration. Symbols represent spectroscopic measurements at 500 nm light wavelength and an integration time of 2 ms. Solid lines represent the fitting. (b) Illustration of decane–water segmented flow in the cell. (c) Illustration of nitrogen–water segmented flow in the cell. | ||
Here ε is the wavelength-dependent molar absorptivity and l is the sensing path length; α is the absorption coefficient. The slopes of the fitting lines (i.e., α) are about 2.6 M−1 and 0.26 M−1 for measurements under gas–liquid and liquid–liquid segmented flow conditions, respectively. This could be explained by the difference in the path length in the two flow scenarios since ε is constant. As schematically depicted in Fig. 6b and c, the optical fiber tip was not mounted flush with the surface plane of the capillary microreactor wall due to its relatively large diameter (1.6 mm). This leaves a free space along the light transmission path in the cell which was filled by the carrier phase under segmented flow operation (i.e., the aqueous phase or decane during gas–liquid or liquid–liquid flow, respectively). As significant light absorption occurred in the aqueous phase in both flow situations, the effective path length (l) is the distance that the light passed through this phase. It appears from Fig. 6b and c that l was much larger in the case of gas–liquid flow (measured to be about 7 mm) than that in the case of liquid–liquid flow (about 0.75 mm). This explains a ten-fold difference in α between the two fitting lines shown in Fig. 6a. The reliability of spectroscopic analysis under segmented flow was confirmed by a comparison with experiments under single-phase flow of an aqueous Co(NO3)2 solution. The same dependence between A and c was found for both gas–liquid and single-phase flow conditions (Fig. 6a).
The above results indicate that the current cross-type flow-through cell allows a sensing path length much larger than the capillary microreactor diameter for the spectroscopic analysis of the carrier liquid if the fiber tip is arranged further away from the surface plane of the microreactor wall, enabling one to achieve a lower limit of detection. However, an adverse effect is the slowdown in response time, making this arrangement not well suitable for fast transient studies. The sensing path length for spectroscopic analysis of the dispersed phase is not affected by this arrangement and is relatively short (approximately equal to the microreactor diameter). If the dispersed phase contains the target analytes that can be obscured on the spectrum by the carrier phase, it is preferable to bring the fiber tip flush with the surface plane of the microreactor wall. The latter arrangement can be easily achieved by choosing the right type of optical fibers or by customizing the channel size in the cell. Therefore the proposed cell design provides an effective means for probing two-phase reactions/operations under segmented flow in microreactors. It is noteworthy that the spectroscopic cell designs developed for UV/Vis detection under single-phase flow in microreactors are usually not appropriate for such purposes. For example, a practical way to enhance UV/Vis absorbance detection in microfluidic single-phase flow scenarios is to increase the optical path length by introducing the light along the flow direction,26 which is also the measuring principle used in the commercial Z-type UV/Vis cells. When it comes to segmented flow in microreactors, such arrangement is usually not feasible as multiple bubbles or droplets would be present in the relatively long optical path through which the light has to travel. Instead, the light has to be guided perpendicularly to the direction of flow, which thereby imposes a limit on the increase of the optical path length. Moreover, the limit of spectroscopic detection can be usually improved by measurements at increased integration times (the length of time for averaging the spectrometer signal) in the case of single-phase flow. For segmented flow, there is a limit on the increase of the integration time which has to be much smaller than the elapsed time for a bubble, a droplet or a liquid slug at the detection point to allow precise concentration measurements. In the present work, a sufficiently small integration time of 2 ms was employed in order to fully resolve the droplet or the liquid slug on the spectrum (cf.Fig. 5a and b), based on which the liquid-phase concentration therein could be obtained using eqn (2) and (3).
Microfluidic chip: spectroscopic analysis of segmented flow
Although the external integration of a cross-type flow-through cell works in principle with chip-based microreactors (e.g., by using a capillary tubing to connect in between), a more advanced option is to incorporate on-chip embedded waveguides allowing for not only the development of a fully functionalized compact microchemical system but also spectroscopic analysis in multiple microchannels.11,38 We investigated the feasibility of a microfluidic chip with monolithically integrated waveguides in performing UV/Vis detection under segmented flow conditions (Fig. 2). Fig. 7 shows our preliminary results on the spectroscopic analysis of nitrogen–water segmented flow in this chip. The alternate passage of gas bubbles and liquid slugs through the sensing area is visible on the spectrum at a sufficiently small integration time of 2 ms, making it possible for concentration measurements in the liquid slug as well. Using eqn (1), the bubble length (LB) and the liquid slug length (LS) were calculated as: LB = 13.1 mm, LS = 13.7 mm under the conditions in Fig. 7a (gas–liquid flow ratio at 1![[thin space (1/6-em)]](https://www.rsc.org/images/entities/char_2009.gif) :
:![[thin space (1/6-em)]](https://www.rsc.org/images/entities/char_2009.gif) 1); LB = 15.5 mm, LS = 6.9 mm under the conditions in Fig. 7b (gas–liquid flow ratio at 2
1); LB = 15.5 mm, LS = 6.9 mm under the conditions in Fig. 7b (gas–liquid flow ratio at 2![[thin space (1/6-em)]](https://www.rsc.org/images/entities/char_2009.gif) :
:![[thin space (1/6-em)]](https://www.rsc.org/images/entities/char_2009.gif) 1). This finding corroborates the capability of the current microfluidic chip in revealing segmented flow details. Fig. 7 further suggests that under these conditions, the bubble body expanded into the sensing area, and the liquid film thickness adjacent to the waveguide was much smaller than the penetration depth of the evanescent wave (usually ranging from a few hundred nanometers to a few micrometers) as the bubble passed the sensing area. Then, the waveguide modes were at cutoff due to the asymmetric design (i.e., the waveguide was surrounded by a bottom SiO2 cladding and a top gas–liquid mixture creating a large difference in refractive indices between both sides, cf.Fig. 2d). This cutoff, plus possible light scattering at the curved gas–liquid interface, resulted in almost no light propagation in the waveguide. The cutoff was also verified in the current chip by another experiment dealing with a switch from a continuous water flow to a continuous nitrogen flow. The output light intensity of the chip dropped from a significantly high level to a substantially low level upon switching the flow from water to nitrogen. Finally, when the microchannel in the chip was completely dried by nitrogen, the output light intensity remained unchanged or only increased a little depending on the working wavelength. Note that the sensing path length has to be shorter than the length of bubbles or liquid slugs for them to be fully resolved on the spectrum, which is fulfilled under the conditions shown in Fig. 7. This is in contrast to the UV/Vis absorbance detection in the evanescent wave field during single-phase flow through microfluidic chips in which the sensing path length along the microchannel can be in principle chosen as long as possible in order to improve the detection limit.39
1). This finding corroborates the capability of the current microfluidic chip in revealing segmented flow details. Fig. 7 further suggests that under these conditions, the bubble body expanded into the sensing area, and the liquid film thickness adjacent to the waveguide was much smaller than the penetration depth of the evanescent wave (usually ranging from a few hundred nanometers to a few micrometers) as the bubble passed the sensing area. Then, the waveguide modes were at cutoff due to the asymmetric design (i.e., the waveguide was surrounded by a bottom SiO2 cladding and a top gas–liquid mixture creating a large difference in refractive indices between both sides, cf.Fig. 2d). This cutoff, plus possible light scattering at the curved gas–liquid interface, resulted in almost no light propagation in the waveguide. The cutoff was also verified in the current chip by another experiment dealing with a switch from a continuous water flow to a continuous nitrogen flow. The output light intensity of the chip dropped from a significantly high level to a substantially low level upon switching the flow from water to nitrogen. Finally, when the microchannel in the chip was completely dried by nitrogen, the output light intensity remained unchanged or only increased a little depending on the working wavelength. Note that the sensing path length has to be shorter than the length of bubbles or liquid slugs for them to be fully resolved on the spectrum, which is fulfilled under the conditions shown in Fig. 7. This is in contrast to the UV/Vis absorbance detection in the evanescent wave field during single-phase flow through microfluidic chips in which the sensing path length along the microchannel can be in principle chosen as long as possible in order to improve the detection limit.39
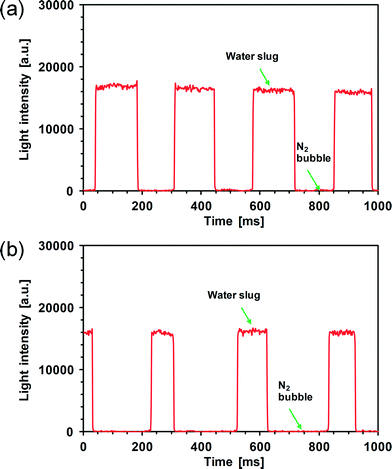 | ||
| Fig. 7 Spectra obtained in the microfluidic chip under nitrogen–water segmented flow at a laser wavelength of 532 nm and an integration time of 2 ms using a 1 mm long sensing area. (a) QA = 20 μl min−1, QG = 20 μl min−1. (b) QA = 10 μl min−1, QG = 20 μl min−1. | ||
Example of application: monitoring AuNPs synthesis in microreactors
The two integration schemes described are applied to illustrate process analysis in the synthesis of gold nanoparticles. Fig. 8 shows our first results on the integration of the cross-type flow-through cell. As AuNPs were produced in the aqueous droplet within a segmented flow through the PTFE capillary microreactor, the obtained spectrum in the subsequent cross-type flow-through cell at a given λ was able to reveal segmented flow details (Fig. 8a). This also allowed the derivation of UV/Vis absorption spectra of the AuNPs solution under different flow conditions (Fig. 8b) which arise from the surface plasmon resonance (SPR) of the colloidal gold nanoparticles. The absorbance (A) is calculated using eqn (2) in which I refers to the light intensity level associated with the aqueous AuNPs droplet (cf.Fig. 8a) and I0 refers to the light intensity level associated with the water droplet as can be inferred from the reference spectrum obtained for decane–water segmented flow in the cross-type flow-through cell under identical flow rate conditions. The maximum absorbance at the SPR peak (ASPR) decreased with increasing total flow rate of both phases (or with decreasing reaction time), and the wavelengths at the SPR peak (λSPR) were found to be 559 nm, 557 nm, and 544 nm for reaction times at 13.3 s, 8.8 s, and 6.6 s, respectively. This suggests a decrease in the mean particle diameter at shorter reaction times, which is consistent with literature results.30,40,41 More quantitatively, a rough estimation of the average nanoparticle size can be made using the method presented by Haiss et al.42 which is based on the fitting of the UV/Vis spectra using the prediction of the Mie theory for monodisperse and spherical AuNPs. With this method, the gold nanoparticle diameter (dP; unit in nanometer) ranging from 35 to 100 nm can be calculated from | (4) |
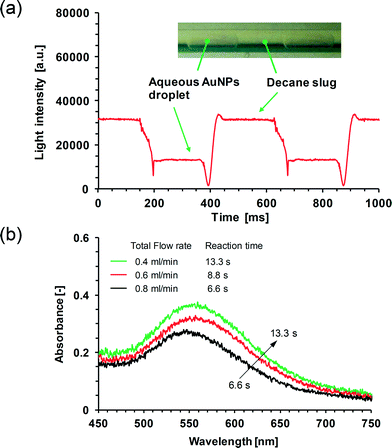 | ||
| Fig. 8 Online UV/Vis monitoring of AuNPs produced in the capillary microreactor. (a) UV/Vis spectrum obtained in the cross-type flow-through cell at a light wavelength of 559 nm and an integration time of 2 ms. The total flow rate of the two phases is 0.4 ml min−1. The inset shows an image of liquid–liquid segmented flow in the capillary microreactor. (b) UV/Vis absorption spectra of the AuNPs solution in the cell. | ||
For the particle diameters down to 5 nm, Haiss et al.42 developed another equation:
 | (5) |
Here, A450 is the absorbance at 450 nm wavelength. B1 and B2 are the fitting parameters which were experimentally determined to be 3 and 2.2, respectively. Then, from the obtained spectra (Fig. 8b), the mean particle diameter in this work was calculated to be 91 nm, 89 nm, and 73 nm according to eqn (4) for reaction times at 13.3 s, 8.8 s, and 6.6 s, respectively. In contrast, the mean particle diameter calculated with eqn (5) was 36 nm, 26 nm, and 24 nm for reaction times at 13.3 s, 8.8 s, and 6.6 s, respectively. The much higher prediction in dP by eqn (4) is possibly a result of the deviation of the particle shape from the ideal sphere. This non-sphericity would cause the shift of the peak position of SPR to a larger wavelength.42–44 In this respect, the prediction by eqn (5) is expected to be more reliable in describing the mean particle diameter in this work, which is justified especially when there is not a broad distribution of particle sizes.43 Thus, the obtained dP can be further utilized for calculating the average particle concentration (e.g., the number density by using eqn (14) in the work of Haiss et al.,42 which is not shown here for brevity). It is worth mentioning that the detection limit of the integrated system in terms of nanoparticle concentration is dependent not only on the precision of the optical setup but also on the segmented flow details. As we discussed before, the detection limit under a given segmented flow condition can be improved by spectral acquisition at longer integration times. However, the integration time has to be sufficiently smaller than the time interval needed for the aqueous AuNPs droplet to pass the detection point in the flow-through cell (i.e., tD), which enables the intensity level associated with the AuNPs droplet to be visible on the spectrum (e.g., see Fig. 8a). This compromise would hinder the achievement of a relatively low detection limit at high droplet velocities (translating into a high total flow rate of the immiscible liquids). Furthermore, detection of gold nanoparticles with size smaller than about 2 nm is not possible with the current UV/Vis spectroscopy as the corresponding SPR peak is greatly damped.44
The application of the microfluidic chip for monitoring AuNPs synthesis is under way. It is expected that this chip would function well at least under gas–liquid segmented flow conditions (i.e., an inert gas phase is added to promote mixing in the aqueous reactive phase). The evanescent wave penetrating into the aqueous slug will then give an online monitoring of gold nanoparticle formation in microreactors. Therefore, the proof-of-principle experiment here highlights the potential of real-time UV/Vis inspection in characterizing segmented flow and indicating the nanoparticle size and concentration under reaction conditions. Along with selected off-line particle analysis, this will allow for a fast process screening and optimization.
Conclusions
We have described the use of a cross-type flow-through cell coupled with capillary microreactors as a convenient means to enable online UV/Vis analysis under segmented flow conditions. Model experiments have shown that liquid-phase concentration and segmented flow details could be determined from the UV/Vis spectra acquired at high time resolution (2 ms). A microfluidic chip with monolithically integrated waveguides for UV/Vis absorbance detection in the evanescent wave field was also reported with regard to segmented flow operation. The two integration schemes are expected to find their promising use in fast analysis of gold nanoparticle synthesis in microreactors (e.g., in fast indication of mean particle size), as well as other two-phase reactions/operations in microreactors that utilize segmented flow processing.Acknowledgements
We thank NanoNextNL for financial support on this work through the project “Design of Micro-Reactors for Catalysis with Integrated Optical Characterization on the nano-scale” (project no. 10C.01).References
- K. Jähnisch, V. Hessel, H. Löwe and M. Baerns, Angew. Chem., Int. Ed., 2004, 43, 406–446 CrossRef PubMed.
- L. Kiwi-Minsker and A. Renken, Catal. Today, 2005, 110, 2–14 CrossRef CAS PubMed.
- B. P. Mason, K. E. Price, J. L. Steinbacher, A. R. Bogdan and D. T. McQuade, Chem. Rev., 2007, 107, 2300–2318 CrossRef CAS PubMed.
- S. Marre and K. F. Jensen, Chem. Soc. Rev., 2010, 39, 1183–1202 RSC.
- A. Abou-Hassan, O. Sandre and V. Cabuil, Angew. Chem., Int. Ed., 2010, 49, 6268–6286 CrossRef CAS PubMed.
- C. Wiles and P. Watts, Chem. Commun., 2011, 47, 6512–6535 RSC.
- R. L. Hartman, J. P. McMullen and K. F. Jensen, Angew. Chem., Int. Ed., 2011, 50, 7502–7519 CrossRef CAS PubMed.
- V. Hessel, Chem. Eng. Technol., 2009, 32, 1655–1681 CrossRef CAS.
- S. Löbbecke, in Micro Process Engineering: Fundamentals, Devices, Fabrication, and Applications, ed. N. Kockmann, WILEY-VCH, Weinheim, 2006, pp. 249–266 Search PubMed.
- J. P. McMullen and K. F. Jensen, Annu. Rev. Anal. Chem., 2010, 3, 19–42 CrossRef CAS PubMed.
- J. Yue, J. C. Schouten and T. A. Nijhuis, Ind. Eng. Chem. Res., 2012, 51, 14583–14609 CrossRef CAS.
- N. Steinfeldt, U. Bentrup and K. Jähnisch, Ind. Eng. Chem. Res., 2010, 49, 72–80 CrossRef CAS.
- J. Keybl and K. F. Jensen, Ind. Eng. Chem. Res., 2011, 50, 11013–11022 CrossRef CAS.
- A. Urakawa, F. Trachsel, P. R. Von Rohr and A. Baiker, Analyst, 2008, 133, 1352–1354 RSC.
- H. Song and R. F. Ismagilov, J. Am. Chem. Soc., 2003, 125, 14613–14619 CrossRef CAS PubMed.
- K. L. A. Chan and S. G. Kazarian, Anal. Chem., 2012, 84, 4052–4056 CrossRef CAS PubMed.
- W. Ferstl, T. Klahn, W. Schweikert, G. Billeb, M. Schwarzer and S. Loebbecke, Chem. Eng. Technol., 2007, 30, 370–378 CrossRef CAS.
- P. M. Günther, F. Möller, T. Henkel, J. M. Köhler and G. A. Groß, Chem. Eng. Technol., 2005, 28, 520–527 CrossRef.
- P. C. Ashok, G. P. Singh, H. A. Rendall, T. F. Krauss and K. Dholakia, Lab Chip, 2011, 11, 1262–1270 RSC.
- V. Hessel, P. Angeli, A. Gavriilidis and H. Löwe, Ind. Eng. Chem. Res., 2005, 44, 9750–9769 CrossRef CAS.
- M. N. Kashid and L. Kiwi-Minsker, Ind. Eng. Chem. Res., 2009, 48, 6465–6485 CrossRef CAS.
- J. Yue, L. Luo, Y. Gonthier, G. Chen and Q. Yuan, Chem. Eng. Sci., 2009, 64, 3697–3708 CrossRef CAS PubMed.
- J. Jovanović, E. V. Rebrov, T. A. Nijhuis, V. Hessel and J. C. Schouten, Ind. Eng. Chem. Res., 2010, 49, 2681–2687 CrossRef.
- B. Kuswandi, Nuriman, J. Huskens and W. Verboom, Anal. Chim. Acta, 2007, 601, 141–155 CrossRef CAS PubMed.
- F. B. Myers and L. P. Lee, Lab Chip, 2008, 8, 2015–2031 RSC.
- H. Gai, Y. Li and E. S. Yeung, Top. Curr. Chem., 2011, 304, 171–201 CrossRef CAS.
- M.-C. Daniel and D. Astruc, Chem. Rev., 2004, 104, 293–346 CrossRef CAS PubMed.
- K. Saha, S. S. Agasti, C. Kim, X. Li and V. M. Rotello, Chem. Rev., 2012, 112, 2739–2779 CrossRef CAS PubMed.
- M. Stratakis and H. Garcia, Chem. Rev., 2012, 112, 4469–4506 CrossRef CAS PubMed.
- V. S. Cabeza, S. Kuhn, A. A. Kulkarni and K. F. Jensen, Langmuir, 2012, 28, 7007–7013 CrossRef PubMed.
- S. A. Khan and S. Duraiswamy, Lab Chip, 2012, 12, 1807–1812 RSC.
- L. L. Lazarus, C. T. Riche, B. C. Marin, M. Gupta, N. Malmstadt and R. L. Brutchey, ACS Appl. Mater. Interfaces, 2012, 4, 3077–3083 CAS.
- R. Heideman, M. Hoekman and E. Schreuder, IEEE J. Sel. Top. Quantum Electron., 2012, 18, 1583–1596 CrossRef CAS.
- H.-J. Butt, K. Graf and M. Kappl, Physics and Chemistry of Interfaces, Wiley-VCH, Weinheim, 2003 Search PubMed.
- B. M. A. Wolffenbuttel, T. A. Nijhuis, A. Stankiewicz and J. A. Moulijn, Meas. Sci. Technol., 2002, 13, 1540–1544 CrossRef CAS.
- T. Kraus, A. Günther, N. Mas, M. A. Schmidt and K. F. Jensen, Exp. Fluids, 2004, 36, 819–832 CrossRef CAS.
- P. Aussillous and D. Quéré, Phys. Fluids, 2000, 12, 2367–2371 CrossRef CAS.
- P. I. Okagbare, J. M. Emory, P. Datta, J. Goettert and S. A. Soper, Lab Chip, 2010, 10, 66–73 RSC.
- A. Prabhakar and S. Mukherji, Lab Chip, 2010, 10, 748–754 RSC.
- J. Wagner and J. M. Köhler, Nano Lett., 2005, 5, 685–691 CrossRef CAS PubMed.
- J. Wagner, T. R. Tshikhudo and J. M. Köhler, Chem. Eng. J., 2008, 135, S104–S109 CrossRef CAS PubMed.
- W. Haiss, N. T. K. Thanh, J. Aveyard and D. G. Fernig, Anal. Chem., 2007, 79, 4215–4221 CrossRef CAS PubMed.
- N. G. Khlebtsov, Anal. Chem., 2008, 80, 6620–6625 CrossRef CAS PubMed.
- V. Amendola and M. Meneghetti, J. Phys. Chem. C, 2009, 113, 4277–4285 CAS.
| This journal is © The Royal Society of Chemistry 2013 |
