 Open Access Article
 This Open Access Article is licensed under a Creative Commons Attribution-Non Commercial 3.0 Unported Licence
Thermal loading in flow-through electroporation microfluidic devices
Blanca
del Rosal
*a,
Chen
Sun
b,
Despina Nelie
Loufakis
c,
Chang
Lu
c and
Daniel
Jaque
a
aFluorescence Imaging Group, Departamento de Física de Materiales, Facultad de Ciencias, Instituto Nicolás Cabrera Universidad Autónoma de Madrid, Campus de Cantoblanco, Madrid 28049, Spain. E-mail: daniel.jaque@uam.es
bSchool of Biomedical Engineering and Sciences, Virginia Tech-Wake Forest University, Blacksburg, Virginia 24061, USA
cDepartment of Chemical Engineering, Virginia Tech, Blacksburg, Virginia 24061, USA
First published on 15th May 2013
Abstract
Thermal loading effects in flow-through electroporation microfluidic devices have been systematically investigated by using dye-based ratiometric luminescence thermometry. Fluorescence measurements have revealed the crucial role played by both the applied electric field and flow rate on the induced temperature increments at the electroporation sections of the devices. It has been found that Joule heating could raise the intra-channel temperature up to cytotoxic levels (>45 °C) only when conditions of low flow rates and high applied voltages are applied. Nevertheless, when flow rates and electric fields are set to those used in real electroporation experiments we have found that local heating is not larger than a few degrees, i.e. temperature is kept within the safe range (<32 °C). We also provide thermal images of electroporation devices from which the heat affected area can be elucidated. Experimental data have been found to be in excellent agreement with numerical simulations that have also revealed the presence of a non-homogeneous temperature distribution along the electroporation channel whose magnitude is critically dependent on both applied electric field and flow rate. Results included in this work will allow for full control over the electroporation conditions in flow-through microfluidic devices.
1. Introduction
Electroporation (based on the electric field induced increase in the electrical conductivity and permeability of the cell membrane) is a fundamental technique with numerous applications in both basic biological research and applied biotechnology. It is, indeed, the most widely used method nowadays for delivering impermeant molecules, such as genes and drugs, into living cells.1–4 It occurs when the living cell is exposed to an external electric field, making the transmembrane potential exceed a critical threshold value. This leads to the creation of nanoscale pores in the cell membrane, thus making it transiently and reversibly permeable.5,6 While electroporation presents a number of advantages compared to other transfection methods such as viral or chemical transfection (high efficiency for primary cells, reduced safety concerns, simple operation, and little cell-type dependency),7–9 it has limitations due to the high cost of the equipment required and the small delivery area through the surface of the cell that could result in an overall low transfection efficiency.Traditional cuvette-based electroporators work in batch mode, thus allowing the processing of samples up to a few millilitres.10 However, electroporation is nowadays attracting much attention thanks to its implementation in microfluidic devices, which require significantly lower applied voltages than those used in conventional electropulsation.11–14 Microfluidic devices allow for controlled transfection processes in small cell populations and even at the single cell level,12,15 as well as for the processing of larger samples in a continuous manner.16 The design of new electroporation microfluidic devices allowing for full control over the process is, indeed, challenging.
In conventional electroporation techniques and most of the microfluidic devices developed up to this date, short electrical pulses are applied in order to reduce the cellular damage produced by the electric current and consequent excessive heating caused by the Joule effect.15,17 The use of time-modulated voltages (and currents) implies a significant increase in both the manufacturing cost and complexity of the electroporation device. Also, the fact that the cells remain static during the process (i.e. with a constant relative orientation of the cell with respect to the electric field) results in the permeabilization of the membrane mostly at the cell poles.18,19 However, these limitations can be overcome with flow-through electroporation devices constituted by a microfluidic channel with alternating narrow and wide sections.20 In these kinds of devices, when a DC voltage is applied along the micro-channel the electric field intensity is spatially modulated, increasing at the narrow sections. Then, when a cell is pushed along the channel crossing the narrow sections the situation is equivalent to the application of a time modulated voltage (time modulated electric field). This makes it possible to subject the cells to a sequence of pulses using a conventional DC power supply. Apart from cost reduction (the pulse generators can be replaced by conventional DC sources), this method makes it possible to achieve a more homogeneous permeabilization of the cell membrane, as the cells are not static during electroporation and their relative orientation with respect to the applied electric field is continuously (and randomly) changing.21
When an electrically conductive medium, such as the buffer required for electroporation, is subject to an electric field, Joule heating occurs due to the non-vanishing resistivity. The magnitude of this heating depends on different parameters such as the electric field strength, the flow rate, channel dimensions and the electric conductivity of the medium. Due to Joule heating, during the electroporation process the local temperature inside the micro-channels could significantly differ from the “environment” temperature.22 Temperature changes during electroporation procedures could strongly affect both the transfection efficiency (properties of the cell membrane are strongly temperature dependent) and the final viability of transfected cells due to the possible thermal activation of cell death processes (such as necrosis or apoptosis). As a consequence, temperature increments occurring during electroporation should be controlled. To do so, it is necessary to get a complete knowledge and understanding about how the intra-channel temperature depends on externally controllable parameters such as applied voltage and flow rate. Such a full knowledge requires performing a systematic study of the dependence of the temperature increase on both parameters during electroporation.
Performing thermal measurements in microfluidic devices is far from being an easy task. Due to their reduced dimensions, it is not possible to accurately determine the temperature inside the micro-channels by conventional techniques, because the properties of the setup would be disturbed. A good way to overcome this problem is to use the so-called Luminescence Thermometry (LTh), which is based on the incorporation inside the intra-channel of fluid luminescent probes, whose emission properties are strongly temperature dependent.23 The adequate analysis of the intra-channel luminescence would provide remote thermal sensing. There are several examples in the literature on the use of LTh for thermal sensing and imaging of micro-fluidic devices.24–28 They involve the use of different luminescent probes such as Quantum Dots and luminescent polymers. Among the different approaches, the use of laser-induced fluorescence of a solution of two dyes as a temperature indicator has been demonstrated to be especially adequate for thermal characterization of micro-fluidic devices. Some organic dyes, such as Rhodamine B, show a luminescence emission with a strong quenching of temperature allowing for thermal reading from simple intensity analysis. The use of these luminescent dyes is not good enough to provide correct temperature data, as any local fluctuations in dye concentration and light intensity will cause changes in the fluorescence signal. Incorporating a reference dye such as Rhodamine 110 (with a temperature-independent fluorescence, i.e. free from thermal quenching) into the Rhodamine B solution makes it possible to measure the temperature as a function of the ratio of both emission peaks (the so-called ratiometric approach), which is independent of the possible local variations.29 In addition, this method makes it possible to obtain high-resolution temperature distribution maps in microfluidics systems when used in combination fluorescence microscopes capable of a spatial analysis of the intra-channel luminescence. Although this approach has already been successfully used for thermal imaging of microfluidic devices,30 it has not been yet applied for the characterisation of flow-through electroporation microfluidic devices.
In this work we have performed a systematic investigation of the thermal loading of flow-through electroporation microfluidic devices by ratiometric Luminescence Thermometry by combining confocal and fluorescence microscopy with a calibrated mixed solution of two dyes. The magnitude of the thermal loading taking place during electroporation has been investigated as a function of both the electric field and flow rate. We have also investigated the spatial extension of the electric field induced thermal loading and we report thermal images of the devices under real operating conditions. Our experimental data and thermal images have been compared to results obtained by mathematical modeling of our system.
2. Experimental
2.1 Device fabrication
The electroporation microfluidic devices were fabricated on PDMS using a standard soft lithography method, as described in previous works.10 Briefly, photomasks were fabricated on 3 in. silicon wafers based on microscale patterns designed with computer-aided software (FreeHand MX). A 5 mm thick layer of prepolymer mixture was poured onto the master and then cured in an oven for 1 h at 80 °C. The baked PDMS replicas were then peeled from the master, punched for inlet and outlet holes, oxidized by plasma treatment and bonded to a pre-cleaned and oxidized glass slide. Finally, the whole device was baked for 40 min at 80 °C so as to increase the bonding strength between the PDMS and glass. Two different kinds of devices were fabricated which are schematically shown in Fig. 1(a) and 1(b).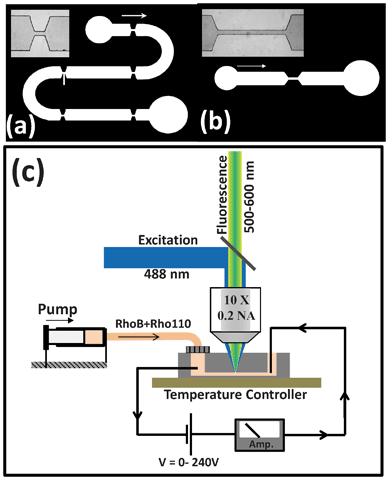 | ||
| Fig. 1 Schematic diagrams of the two types of electroporation micro-devices investigated in this work ((a) and (b)). In each case the inset shows an optical transmission image of the narrow section in which electroporation takes place. (c) Schematic diagram of the experimental set-up used for thermal imaging of the electroporation devices. | ||
The present work is focused on the study of the thermal loading in the S-shaped devices (Fig. 1(a)) as it has been previously demonstrated that devices with multiple narrow sections yield significantly better results in electroporation experiments.31
The exact geometry of the device (dimensions of the wide and narrow sections) determines the electric field achieved in its narrow sections (Enw). This is related to the applied voltage (V) through the following expression:
| Enw = V/(L1W2/W1 + L2) | (1) |
Our S-shaped devices consist of 5 narrow sections (200 μm long and 53 μm wide each) alternating with wide sections (587 μm in width, with a total length L1 of 21 mm) and are 67 μm deep. The simpler devices (36 μm in depth) have one single narrow section (1 mm long and 50 μm wide) and two wide sections (5 mm in length and 500 μm in width each).
2.2 Temperature measurement
In order to achieve intra-channel thermal sensing, the devices were filled with a solution containing two different fluorescent dyes: Rhodamine B (RhoB) and Rhodamine 110 (Rho110). Both dyes were provided by SigmaTech Inc. and the concentrations in the solution were set to 0.25 mM and 0.05 mM for RhoB and Rho110, respectively. In our experiments we used RhoB as the temperature dependent dye and the Rho110 as the reference dye. These two different roles are evidenced in Fig. 2(a) that shows the emission spectra of the solution under 488 nm optical excitation, as obtained at two different temperatures. It is clear that temperature increment causes a remarkable luminescence quenching in the RhoB whereas the emitted intensity of Rho110 remains unchanged. Fig. 2(b) shows the ratio between the emission intensities of RhoB and Rho110 as a function of solution temperature. This was calculated by fitting each spectrum to a double Gaussian band and using the height of each Gaussian to determine the ratio. Thermal quenching causes a monotonous decrease in the intensity ratio that can be used to determine the solution temperature with an accuracy of 1 °C (in our experimental conditions). Finally, it is important to note that the aqueous solution containing both dyes also contained KCl (at a concentration of 0.01 M) so that its conductivity was set to 0.14 S m−1 at room temperature, which is the conductivity of the buffer required for electroporation.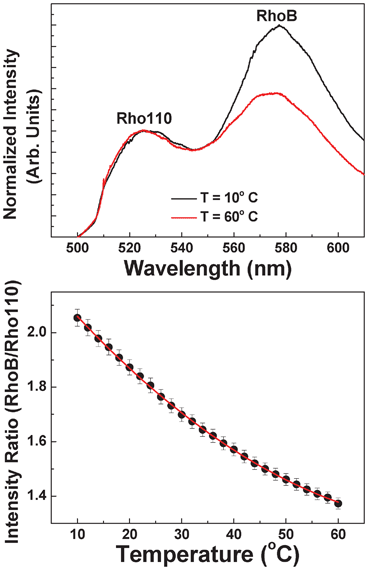 | ||
| Fig. 2 (a) Emission spectra of the solution containing both Rhodamine B and Rhodamine 110 as obtained at two different temperatures (10 and 60 °C). (b) Temperature evolution of the ratio between the emitted intensities generated from Rhodamine B and Rhodamine 110. Dots are experimental data and the solid line is the polynomial fit that is used for temperature sensing. | ||
A continuous flow of the fluorescent dye solution was established through the devices by connecting their inlet end to a syringe pump (NE-1002X Programmable Microfluidics Syringe Pump) via 1/16-inch plastic tubing. To create the electroporation field, platinum wires were placed into the inlet and outlet reservoirs of the devices; and connected to a DC power supply. A micro-ampere meter was used to ensure that adequate electroporation conditions were maintained throughout all our measurements.
A home-made confocal microscope, which is schematically depicted in Fig. 1(c), was used to obtain the intra-channel luminescence from which the intra-channel temperature is calculated. In order to minimize the influence of environmental temperature in our experiments as well as to improve their thermal stability, the microfluidic device was placed on a Peltier-controlled stage (Linkam PE120) that keeps the temperature of the device constant at 20 °C. A continuous wave diode laser at 488 nm was used as the excitation source. 488 nm radiation was focused into the micro-channel by using a 10× microscope objective with a Numerical Aperture of 0.2, leading to a beam spot close to 7 μm in radius. The intra-channel luminescence generated by the two dyes was collected by using the same microscope objective and, after passing through appropriate filters, was spectrally analysed by a CCD camera attached to a iHR320 Horiba Jobin Yvon spectrometer. The spatial and thermal resolution of this system were estimated to be below 10 μm and 2 °C, respectively.
Finally, a commercial epi-fluorescence microscope was used to obtain two-dimensional thermal images. In this case, a high-voltage mercury lamp was used as an excitation source and an adequate combination of fluorescence filters was used to obtain the spatial variation of the fluorescence intensity generated from both Rho11 and RhoB. In particular, these two images were obtained by using two sets of filters. For 530 nm fluorescence image acquisition we used a set composed of a 450–500 excitation bandpass filter, a 500 nm longpass filter and a 510–550 emission bandpass filter. For 580 nm fluorescence image acquisition we used a set composed of a 525–560 nm excitation bandpass filter, a 575 nm longpass filter and a 580–650 emission bandpass filter. These two fluorescence images were used to determine the spatial variation of the intensity ratio and from it the thermal image was re-constructed by using the calibration curve of Fig. 2(b). This experimental set-up provided us the possibility of obtaining thermal images with reduced acquisition times although the thermal accuracy was estimated to be 2 °C, i.e. larger than that obtained by using the fluorescence confocal microscope described above. Therefore, the epi-fluorescence microscope was used for the measurement of thermal images and accurate thermal loading was measured by using the confocal fluorescence microscope.
2.3 Mathematical modelling
COMSOL Multiphysics 4.2 was used to mathematically study the temperature increase within the microfluidic channels. Two physics modules: Electric Currents (ec) and Conjugated Heat Transfer (nitf) in COMSOL Multiphysics 4.2 were used to mathematically study the temperature increase within the microfluidic channels. A 3D steady-state analysis model was built, and the Navier–Stokes and the continuity equations were coupled with heat transfer equations to solve the problem computationally. The following boundary conditions were applied: (1) specific inlet velocities and no pressure at the outlet; (2) specific terminal current at one electrode and another electrode is set to be ground; (3) room temperature (293.15 K) for initial temperature, inlet fluid and channel bottom; (4) no-slip condition at the walls and (5) incompressible fluid.3. Results and discussion
3.1 Experimental results
Once the thermal response of our fluorescent dye solution is known (see Fig. 2(b)) it is now possible to elucidate the intra-channel thermal loading by just recording the luminescence of the solution during electroporation. In a first step, the thermal loading produced at the different narrow sections of the device depicted in Fig. 1(a) was analysed by placing the 488 nm excitation spot in the middle of each narrow section. A continuous flow of the fluorescent solution was established through the device, and for each flow rate the intra-channel fluorescence spectrum was measured for different values of the applied voltage. These measurements allowed us to determine the intra-channel temperature as a function of the applied electric field. Results obtained for three different flow rates are shown in Fig. 3. As will be discussed later on, no significant differences were observed between the different narrow sections. As can be observed, Joule heating is not negligible in our devices. Indeed, for the lowest flow rate analysed in this work (2.13 μL min−1) the current-induced temperature increment neared 23 °C at the largest electroporation field (800 V cm−1). This means that, if the device is operated at 20 °C (as in our case), then intra-channel temperature, for these low flow rates, could be as large as 43 °C, thus driving the electroporated cells up to the cytotoxic level.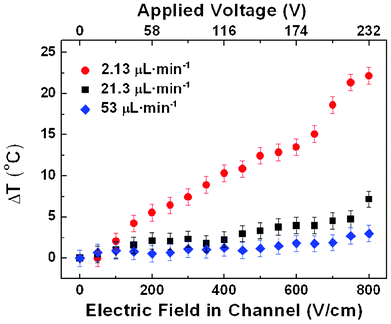 | ||
| Fig. 3 Temperature change (with respect to 20 °C) produced at the narrow sections of the device depicted in Fig. 1(a) as a function of the electric field. The corresponding voltage applied to the device is also indicated. The results obtained for three different flow rates are included. Results obtained with the confocal setup described in the text. | ||
Despite the large thermal loads found when low flow rates are applied, it should be noted that the magnitude of Joule heating decreases significantly as the flow rate increases. As an example, from Fig. 3 it is clear that when the flow rate is increased up to 53 μL min−1, the intra-channel thermal loading is reduced down to a few degrees even for the maximum applied voltage. Data included in Fig. 3 correspond to the thermal loading arising in the short constriction of the S-shaped device depicted in Fig. 1(a). Temperature measurements were done with the confocal setup described in Section 2.2. The strong dependence of the intra-channel thermal loading on the flow rate established in our device is further evidenced in Fig. 4. It shows both the measured temperature increment for an applied voltage of 145 V (corresponding to an intra-channel electric field of 500 V cm−1) and the increment predicted by the mathematical modelling as a function of the flow rate. That electric field value was chosen as it lies in the optimal range for electroporation in these devices10 and has been demonstrated to yield the best results in terms of transfection efficiency and cell viability.20
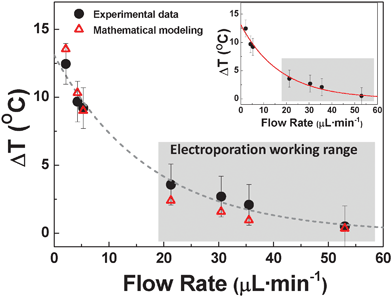 | ||
| Fig. 4 Temperature change (with respect to 20 °C) produced at the narrow section of the devices depicted in Fig. 1(a) for an applied electric field of 500 V cm−1 as a function of flow rate. Inset shows the temperature change (with respect to 20 °C) produced at the narrow section of the device depicted in Fig. 1(b) also for an applied electric field of 500 V cm−1. Circles are experimental data, triangles are simulation data and the dashed line is a guide for the eye. Results obtained with the confocal setup described in the text. | ||
It should be noted at this point that flow-induced heat dissipation has been previously reported in microfluidic devices specially designed for fast temperature control as well as in microfluidic chips designed for electrophysiology.32,33 Those works indicated what it is also concluded from data shown in Fig. 4: flow rate is one of the primary parameters that governs intra-channel thermal loading in microfluidic devices. It can be explained by taking into account the fact that larger flow rates reduce the time in which the fluid is in contact with the heating source (narrow sections in our devices) therefore reducing the heat transfer.
It has been previously determined that, for an optimal transfection efficiency, cells should spend a total time of 1–10 ms in the narrow sections of the channel.10 The total time in the narrow sections (T2) and the applied flow rate (Φ) are related through the following expression:
| Φ = W2L2H/T2 |
where L is the most relevant length scale, μ is the fluid viscosity, ρ is the fluid density, and Vavg is the average velocity of the flow. In our conditions, we have estimated that the Reynolds number is not larger than 3 even for the highest flow rates used in our work. Turbulent flow is expected for Reynolds numbers above 2000. Therefore, in our experimental conditions, the flow is completely laminar and no turbulences are expected. In addition, the Dean number, De, is given by:21,35,36

where again Re is the Reynolds number, r is the radius of curvature and Dh is the hydraulic diameter defined as Dh = 2wh/w + h, where w and h are the width and height of the channel. In our conditions, and for the maximum flow rate used, the Dean number at the curved sections of the S-shaped devices has been calculated to be close to 1.2. According to previous studies,37 this can be considered as a “low value” so that the presence of transverse currents in S-shaped devices (even at the curved sections) is expected to be negligible. Therefore, transverse-currents-induced heat dissipation at the electroporation sections is expected to be a second order effect. This is, indeed, in agreement with the similar thermal loading observed in S-shaped and straight devices. Results included in Fig. 4 also point out that other differences between both devices (such as the channel height) have a second order effect on the final thermal loading.
The total thermal loading experienced by a cell during electroporation does not only depend on the magnitude of the temperature rise at the center of the channel, but also on how homogeneous this temperature rise is along the channel and on how it extends out of it. Indeed, due to heat diffusion through the fluid, it is expected that Joule heating will not only lead to a temperature change inside the narrow sections, but will also affect their surroundings. It is expected that a Heat Affected Zone (HAZ), in which temperature differs from the working temperature of the device, will appear at both sides of each narrow section. In order to determine the extension of the HAZ and the magnitude of the heating along it, thermal images of the narrow sections were obtained with a calibrated fluorescence microscope as explained in Section 2. Fig. 5 shows the thermal images of one of the narrow sections as obtained for an electric field of 500 V cm−1 and for four different flow rates. On a first inspection, it is clear that the thermal contrast decreases with the flow rate, in agreement with the results obtained by using the confocal microscope (see Fig. 3 and 4). Note that for a flow rate of 21 μL min−1 (which lies within the working range of these devices) there is virtually no thermal contrast, revealing a negligible thermal loading in these conditions.
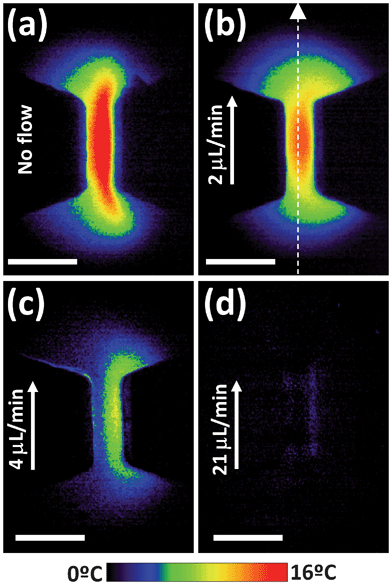 | ||
| Fig. 5 Thermal images of one of the narrow sections of the structure depicted in Fig. 1(a) in the presence of an applied electric field of 500 V cm−1 as obtained for different flow rates. Arrow indicates the direction of the flow. Scale bar is 200 μm in all the cases. Results obtained with the epi-fluorescence microscope described in the text. | ||
Further inspection of the thermal images included in Fig. 5 reveals that the temperature rise within the channel is far from being homogeneous. This is evidenced in Fig. 6, which includes the thermal profile along the middle of the channel and parallel to flow direction (as indicated in the thermal image of Fig. 5(b)) for a flow rate of 2 μL min−1. In Fig. 6 the extension of the narrow section is schematically indicated. As can be observed, the temperature rise is highest at the middle of the channel and extends over tens of microns out of it. Indeed, if we define the extension of the HAZ as the distance required for the temperature rise to decrease down to 1/2 of its value at each end of the narrow section, the HAZ extension can be estimated to be close to 75 microns. In microfluidic devices and in the presence of well-localized heating sources, heat dissipation occurs in a distance comparable to the minimum channel dimension, which determines the distance between the heat source and the heat sinks). In our case, the minimum dimension corresponds to the channel height, close to 40 μm, which is of the same order of magnitude as the length of the experimentally determined HAZ.
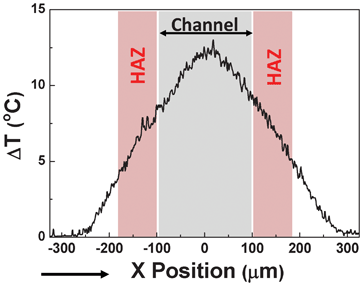 | ||
| Fig. 6 Thermal profile obtained along the scan line indicated in Fig. 5(b) that corresponds to the intra-channel temperature rise induced for an electrical field of 500 V cm−1 and a flow rate of 2 μL min−1. The extension of the electroporation channel (200 μm in length) is indicated together with the Heat Affected Zones created at both sides (HAZ). | ||
The extension of the HAZ has been found to be much smaller than the actual distance between two consecutive narrow sections (i.e. between two consecutive heat sources). This fact suggests that there is no heat accumulation between consecutive narrow sections. In order to confirm it, the temperature rise was measured in sections 1, 3 and 5 of the device as labelled in Fig. 7(a). For that purpose we established a flow rate of 21 μL min−1 and applied a voltage of 145 V, thus creating a 500 V cm−1 electric field in the narrow sections of the channel. Fig. 7(b) shows the fluorescence spectra obtained for sections 1 and 5.
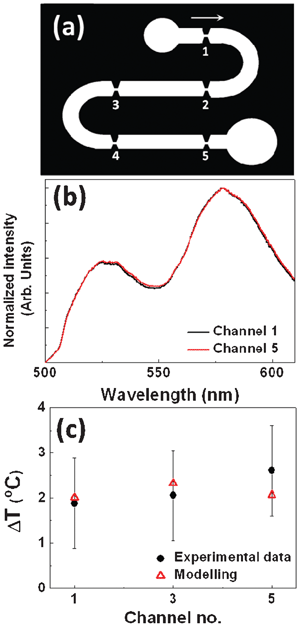 | ||
| Fig. 7 (a) Schematic drawing of an electroporation device constituted by several narrow channels where the electric field is locally enhanced. The flow direction is indicated by the arrow. (b) Emission spectra generated by the fluorescent dye solution as obtained from the first and last electroporation channel for an applied voltage of 145 V (corresponding to a local electric field at the channels of 500 V cm−1). Flow rate was set to 21 μL min−1. (c) Temperature increment induced by an applied electric field as measured at the first, middle and last channel. Circles correspond to experimental data and triangles to the values obtained from COMSOL modeling. Experimental results were obtained with the confocal microscope, as described in the text. | ||
As can be observed, the ratio between the emitted intensities generated from both dyes is, within the experimental error, equal in both cases. This indicates that the temperature rise is almost identical for both channels, revealing the absence of any heat accumulation effect. This is further supported by the data included in Fig. 7(c) that shows the temperature rise produced in sections 1, 3 and 5 (first, middle and last sections). As can be observed the temperature rise is the same for all three of them (within the experimental error). As already stated, these results indicate that the temperature rise induced at narrow sections completely vanishes between consecutive sections, in accordance with the thermal images of Fig. 5 and the thermal profile of Fig. 6 revealing complete thermal relaxation within a few tens of microns.
3.2 Mathematical modelling results
The experimental results included in Section 3.1 have been compared with theoretical predictions obtained from the COMSOL modelling. Results included in Fig. 8 show the temperature increment distributions in a narrow section of the device depicted in Fig. 1(a) for different flow rates. These images have been obtained assuming the same experimental conditions as those used to obtain the thermal images included in Fig. 5. As can be observed, when comparing Fig. 5 and 8, it is clearly seen that our simulations and the experimentally obtained thermal images are in good agreement in terms of both the magnitude and spatial extension of the current induced thermal loading. Furthermore, simulations also reproduced the experimentally observed reduction in the thermal loading associated with the increase in the flow rate. Both simulated and experimentally obtained thermal images obtained for the largest flow rate (21 μL min−1) reveal a negligible thermal loading. Despite the good agreement observed between experimental data included in Fig. 5 and simulations of Fig. 8, experiments and simulations differ for intermediate flow rates (4 μL min−1). At this point the origin of the discrepancies between the experimentally observed thermal images and those simulated for the largest flow rates is unclear, although it can be due to different causes including electrokinetic phenomena.38 As discussed in Section 3.1, other effects such as the presence of turbulences or Dean-flow-induced mixing effects can be discarded due to both the low Dean and Reynolds numbers.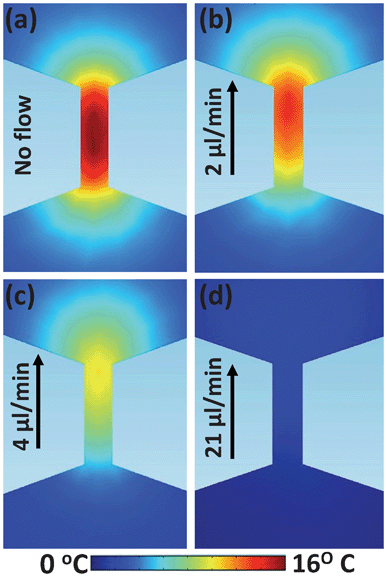 | ||
| Fig. 8 Thermal images obtained from COMSOL modelling of one of the narrow sections of the structure depicted in Fig. 1(a) under an applied electric field of 500 V cm−1 as obtained for different flow rates. Arrow indicates the direction of the flow. | ||
From the thermal images obtained from the mathematical modelling under different conditions, we predicted the maximum temperature increment at the narrow sections of the electroporation channel for an electrical field of 500 V cm−1 as a function of the flow rate. Results obtained from our simulations are included in Fig. 4 together with the experimental data. A remarkable agreement between simulations and experimental measurements has been obtained, revealing the critical role of flow rate in heat dissipation, as discussed in Section 3.1.
Finally, we have also simulated the temperature increment induced in the different electroporation channels of the electroporation device depicted in Fig. 7(a) under an applied electric field of 500 V cm−1 for a flow rate of 21 μl min−1. It can be observed that the modelling reveals only slight differences in the thermal loading of the different channels as we did observe in our experimental measurements. Again this reveals that complete thermal dissipation occurs between two consecutive electroporation channels, thus discarding the presence of inter-channel heat accumulation effects. In summary, an excellent agreement between experimental data and numerical simulations has been found, revealing the accuracy and correctness of our measurements.
4. Conclusions
In summary, dye based ratiometric luminescence thermometry has been applied to determine the magnitude and spatial extension of Joule induced thermal effects in flow-through electroporation microfluidic devices. We have found that the temperature rise induced in the electroporation sections is strongly dependent on both the flow rate established to control electroporation time as well as on the electroporation electric field. For low flow rates and large electric fields the Joule induced temperature rise could drive cells up to cytotoxic temperatures (43 °C). Nevertheless, for flow rates and electric fields typically required for flow-through electroporation experiments, the induced temperature rises are low enough to keep cells well below the cytotoxic thermal range. In order to determine the total thermal loading of cells during flow-through electroporation we have also determined the extension of the heat affected zone, being of the order of a few tens of microns. Experimental results have been found to be in excellent agreement with COMSOL based numerical simulations that well reproduced the critical effect that both flow rate and applied electrical field have on the final thermal loading on the electroporation channel.This work provides essential information for future estimation of the magnitude and extension of the thermal effects in electroporation microfluidic devices. The exact knowledge of the Joule induced thermal loading will also be essential for the complete understanding of the origin of the possible cellular toxicity effects observed after electroporation since it would make it possible to determine the relative contribution of hyperthermic effects.
Acknowledgements
This work has been supported by NSF (CBET 1016547, 1041834, 0967069), the Universidad Autónoma de Madrid and Comunidad Autónoma de Madrid (Project S2009/MAT-1756), and the Spanish Ministerio de Educacion y Ciencia (MAT2010-16161). Blanca del Rosal thanks Universidad Autónoma de Madrid for financial support (FPI-UAM grant).Notes and references
- E. Neumann, M. Schaeferridder, Y. Wang and P. H. Hofschneider, Embo J., 1982, 1, 841–845 CAS.
- M. P. Rols, C. Delteil, M. Golzio, P. Dumond, S. Cros and J. Teissie, Nat. Biotechnol., 1998, 16, 168–171 CrossRef CAS.
- H. Aihara and J. Miyazaki, Nat. Biotechnol., 1998, 16, 867–870 CrossRef CAS.
- Z. Z. Fei, S. N. Wang, Y. B. Xie, B. E. Henslee, C. G. Koh and L. J. Lee, Anal. Chem., 2007, 79, 5719–5722 CrossRef CAS.
- J. C. Weaver and Y. A. Chizmadzhev, Bioelectrochem. Bioenerg., 1996, 41, 135–160 CrossRef CAS.
- J. Teissie, M. Golzio and M. P. Rols, Biochim. Biophys. Acta, Gen. Subj., 2005, 1724, 270–280 CrossRef CAS.
- A. Hamm, N. Krott, I. Breibach, R. Blindt and A. K. Bosserhoff, Tissue Eng., 2002, 8, 235–245 CrossRef CAS.
- P. Lenz, S. M. Bacot, M. R. Frazier-Jessen and G. M. Feldman, FEBS Lett., 2003, 538, 149–154 CrossRef CAS.
- F. Andre and L. M. Mir, Gene Ther., 2004, 11, S33–S42 CrossRef CAS.
- T. Geng, Y. H. Zhan, J. Wang and C. Lu, Nat. Protoc., 2011, 6, 1192–1208 CrossRef CAS.
- Y. C. Lin and M. Y. Huang, J. Micromech. Microeng., 2001, 11, 542–547 CrossRef CAS.
- M. Khine, A. Lau, C. Ionescu-Zanetti, J. Seo and L. P. Lee, Lab Chip, 2005, 5, 38–43 RSC.
- H. Lu, M. A. Schmidt and K. F. Jensen, Lab Chip, 2005, 5, 23–29 RSC.
- S. Homhuan, B. Zhang, F. S. Sheu, A. A. Bettiol and F. Watt, Biomed. Microdevices, 2012, 14, 533–540 CrossRef CAS.
- Y. Huang and B. Rubinsky, Sens. Actuators, A, 2003, 104, 205–212 CrossRef CAS.
- T. Geng, Y. H. Zhan, H. Y. Wang, S. R. Witting, K. G. Cornetta and C. Lu, J. Controlled Release, 2010, 144, 91–100 CrossRef CAS.
- M. P. Rols, D. Coulet and J. Teissie, Eur. J. Biochem., 1992, 206, 115–121 CrossRef CAS.
- E. Tekle, R. D. Astumian and P. B. Chock, Proc. Natl. Acad. Sci. U. S. A., 1994, 91, 11512–11516 CrossRef CAS.
- M. Golzio, J. Teissie and M. P. Rols, Proc. Natl. Acad. Sci. U. S. A., 2002, 99, 1292–1297 CrossRef CAS.
- H. Y. Wang and C. Lu, Anal. Chem., 2006, 78, 5158–5164 CrossRef CAS.
- J. Wang, Y. H. Zhan, V. M. Ugaz and C. Lu, Lab Chip, 2010, 10, 2057–2061 RSC.
- D. Erickson, D. Sinton and D. Q. Li, Lab Chip, 2003, 3, 141–149 RSC.
- D. Jaque and F. Vetrone, Nanoscale, 2012, 4, 4301–4326 RSC.
- M. S. Jaeger, T. Mueller and T. Schnelle, J. Phys. D: Appl. Phys., 2007, 40, 95–105 CrossRef CAS.
- D. Ross, M. Gaitan and L. E. Locascio, Anal. Chem., 2001, 73, 4117–4123 CrossRef CAS.
- R. Samy, T. Glawdel and C. L. Ren, Anal. Chem., 2008, 80, 369–375 CrossRef CAS.
- D. Choudhury, D. Jaque, A. Rodenas, W. T. Ramsay, L. Paterson and A. K. Kar, Lab Chip, 2012, 12, 2414–2420 RSC.
- C. D. S. Brites, P. P. Lima, N. J. O. Silva, A. Millan, V. S. Amaral, F. Palacio and L. D. Carlos, Nanoscale, 2012, 4, 4799–4829 RSC.
- J. Sakakibara and R. J. Adrian, Exp. Fluids, 1999, 26, 7–15 CrossRef CAS.
- S. Ebert, K. Travis, B. Lincoln and J. Guck, Opt. Express, 2007, 15, 15493–15499 CrossRef CAS.
- H. Y. Wang and C. Lu, Biotechnol. Bioeng., 2008, 100, 579–586 CrossRef CAS.
- G. V. Casquillas, C. H. Fu, M. Le Berre, J. Cramer, S. Meance, A. Plecis, D. Baigl, J. J. Greffet, Y. Chen, M. Piel and P. T. Tran, Lab Chip, 2011, 11, 484–489 RSC.
- T. Pennell, T. Suchyna, J. B. Wang, J. S. Heo, J. D. Felske, F. Sachs and S. Z. Hua, Anal. Chem., 2008, 80, 2447–2451 CrossRef CAS.
- E. S. Asmolov, J. Fluid Mech., 1999, 381, 63–87 CrossRef CAS.
- A. P. Sudarsan and V. M. Ugaz, Proc. Natl. Acad. Sci. U. S. A., 2006, 103, 7228–7233 CrossRef CAS.
- S. A. Berger, L. Talbot and L. S. Yao, Annu. Rev. Fluid Mech., 1983, 15, 461–512 CrossRef.
- D. Di Carlo, Lab Chip, 2009, 9, 3038–3046 RSC.
- T. M. Squires, Lab Chip, 2009, 9, 2477–2483 RSC.
| This journal is © The Royal Society of Chemistry 2013 |