DOI:
10.1039/C3LC50190F
(Paper)
Lab Chip, 2013,
13, 2055-2065
Microfluidic LC device with orthogonal sample extraction for on-chip MALDI-MS detection†
Received
10th February 2013
, Accepted 20th March 2013
First published on 20th March 2013
Abstract
A microfluidic device that enables on-chip matrix assisted laser desorption ionization-mass spectrometry (MALDI-MS) detection for liquid chromatography (LC) separations is described. The device comprises an array of functional elements to carry out LC separations, integrates a novel microchip-MS interface to facilitate the orthogonal transposition of the microfluidic LC channel into an array of reservoirs, and enables sensitive MALDI-MS detection directly from the chip. Essentially, the device provides a snapshot MALDI-MS map of the content of the separation channel present on the chip. The detection of proteins with biomarker potential from MCF10A breast epithelial cell extracts, and detection limits in the low fmol range, are demonstrated. In addition, the design of the novel LC-MALDI-MS chip entices the promotion of a new concept for performing sample separations within the limited time-frame that accompanies the dead-volume of a separation channel.
Introduction
Mass spectrometry has evolved into a powerful technology that is broadly used as a detection tool in proteomic applications. The combined benefits of specificity, sensitivity and resolving power facilitate the identification of thousands of proteins at the low or sub-fmol level. The most commonly used ionization techniques for biological molecules, electrospray ionization (ESI) and MALDI, have been used with a broad range of mass analyzers for peptide mass fingerprinting and tandem MS applications. MALDI, which typically operates in a high-vacuum ionization source, has been recently implemented in atmospheric pressure (AP) or sub-atmospheric ionization sources, as well.1–3 The strategy combines the simplicity, robustness and throughput of MALDI-MS with the convenience of external ion sources that enable easy interfacing with separation techniques.
Simultaneous to the ascent of mass spectrometry, the development of miniaturized platforms of analysis with MS detection has flourished, as well. Recent reviews describe the progress in detail.4–13 As informative peptide tandem mass spectra are more readily produced from double/triple charged ions generated by ESI, than from preponderantly single charged ions generated by MALDI, the development of various ESI sources from the chip has prevailed (i.e., liquid sheath, liquid junction and nano-ESI). For off-chip MALDI-MS detection, technologies that rely on the use of piezo-actuated flow-through dispensers, of rotating-ball interfaces or of simple infusion/deposition techniques on a target plate, were demonstrated.14–19 Alternatively, for on-chip detection, direct MALDI-MS analysis from open or pseudo-closed microfluidic channels, microreactors, or from centrifugal CDs, was investigated.20–26 Some of the most prominent accomplishments include the use of microfabricated piezo-actuated flow-through dispensers for interfacing capillary liquid chromatography to MALDI/TOF-MS by depositing the sample on a nanovial target plate,14 and the use of the centrifugal CD for sample loading, centrifugal transport through reaction chambers (preconcentration, desalting, affinity selection, proteolytic digestion), and collection into spots for MALDI-MS detection.24 A recent and promising development includes the use of droplet-based digital microfluidic technologies that enable sample preparation on a platform with controlled positioning of the droplets in selected spots.27–29 MALDI-MS detection from low pmol peptide samples was demonstrated.
The small, compact and low-cost design render microfluidic technologies into an ideal analytical platform for MALDI-MS sample pre-processing. However, despite the quality of the data acquired with most of the MALDI-chip MS platforms, the full benefits of microfluidic-MS technologies have not been demonstrated yet, for a number of reasons. The fabrication of piezo-actuated micro-dispensers is not simple, their integration within a chip that performs sample processing is not feasible, and the dispensing process deposits the sample onto a different chip than the one used for analysis, increasing therefore labor and costs. The centrifugal CD or droplet-based digital microfluidic platforms do not enable the integration of a separation step prior to MS analysis, as sample collection occurs into a single spot. On a broader scale, array-based technologies, which are powerful, high-throughput approaches that have fully demonstrated their usefulness for the scrutiny of protein samples, have been developed by using techniques that are prone for static, but not dynamic processing of samples (e.g., by making use of functionalized MALDI target plates, spotting, imprinting, photolithography/self-assembly, antibody-antigen, avidin-biotin and aptamer affinity interactions technologies).30–35 To address some of these issues, in this work, we describe the development of a novel microfluidic device that facilitates dynamic sample processing and MALDI-MS detection on the very same microfabricated platform. Sample consumption is in the μL-volume range. We also advance an innovative concept for performing chromatographic separations within a time-frame that is less than the separation dead-time.
Experimental methods
Microfluidic device fabrication
Microfluidic devices were fabricated from 1.6 mm glass substrates sputtered with chrome and photoresist (Nanofilm, Shelton, CA). Photomask drawings were fabricated in-house with AutoCAD software, and the photomasks were prepared by HTA Photomask (San Jose, CA). Chip exposure to UV light was performed with an OAI (San Jose, CA) instrument, and the channel depths were measured with a Dektak profilometer (Veeco, Plainview, NY). Microfluidic flows were visualized with a Nikon epi-fluorescence microscope (Melville, NY). For chip fabrication, photolithography and wet chemical etching protocols were used.36–39 The glass substrates were etched with buffered oxide etch (Transene Co., Danvers, MA) to ∼50 μm depth × 110 μm width for the LC channels (in the substrate), and to ∼1.5 μm depth × 10 μm width for the pumping/valving and MALDI interface transfer channels (in the cover plate). The photoresist and chrome were removed with methanol/acetone and chrome etchant (Transene Co.), respectively, the chip access holes (1 mm diameter) were drilled with a Dremel tool, and the chips (2” × 2” or 2” × 1”) were cleaned in aqueous/organic solvents and bonded by gradual heating from room temperature to 550 °C. Eluent reservoirs were prepared from glass tubing (4 mm i.d.) cut into 5 mm long pieces. Porous glass discs (5 mm diameter, 0.8–1 mm width, 40–50 Å pore size) for the microfluidic pump outlet reservoirs were purchased from Advanced Glass and Ceramics (Holden, MA). During operation, the chip was mounted on a polymeric PEEK stand and the porous disc was secured against the chip surface between two small O-rings with an Upchurch P203X male nut fitting (1/16”) that was screwed in the stand. This nut also served the purpose of the pump outlet reservoir. Electrical contact to the reservoirs was provided with a series of Pt electrodes connected to an in-house built power supply (6 × 10![[thin space (1/6-em)]](https://www.rsc.org/images/entities/char_2009.gif) 000 V power modules, UltraVolt, Inc., Ronkonkoma, NY). The LC separation channel was packed with a slurry of reversed phase particles (C18/dp = 5 μm) delivered by a syringe pump through an LC side channel and reservoir. The pump was connected to this reservoir through an Upchurch P203X nut fitting secured to the chip through the PEEK polymeric stand. Smaller particles could be used, but tight packing was difficult to accomplish. After packing, the reservoir was plugged with epoxy glue. The particles were retained at one end of the LC channel with short multichannel structures (1.5 μm depth × 100 μm length), while at the other end, with a fused silica capillary inserted in the chip that also facilitated the measurement of flow through the separation channel (10 mm long, 20 μm i.d. × 90 μm o.d.). An outlet frit was not necessary as the particles could be retained by the 20 μm i.d capillary through a Keystone effect.40 Alternatively, in some chips, a 300 μm long × 2 μm deep channel was etched in the cover plate to make the connection between the packed LC channel and a terminus channel that accommodated the capillary for flow measurements.
000 V power modules, UltraVolt, Inc., Ronkonkoma, NY). The LC separation channel was packed with a slurry of reversed phase particles (C18/dp = 5 μm) delivered by a syringe pump through an LC side channel and reservoir. The pump was connected to this reservoir through an Upchurch P203X nut fitting secured to the chip through the PEEK polymeric stand. Smaller particles could be used, but tight packing was difficult to accomplish. After packing, the reservoir was plugged with epoxy glue. The particles were retained at one end of the LC channel with short multichannel structures (1.5 μm depth × 100 μm length), while at the other end, with a fused silica capillary inserted in the chip that also facilitated the measurement of flow through the separation channel (10 mm long, 20 μm i.d. × 90 μm o.d.). An outlet frit was not necessary as the particles could be retained by the 20 μm i.d capillary through a Keystone effect.40 Alternatively, in some chips, a 300 μm long × 2 μm deep channel was etched in the cover plate to make the connection between the packed LC channel and a terminus channel that accommodated the capillary for flow measurements.
Mass spectrometry
Mass spectrometric analysis was performed with an LTQ ion trap instrument (Thermo Electron Corp., San Jose, CA), as previously described.41 The AP-MALDI source was from MassTech (Columbia, MD), and was equipped with a high repetition rate all-solid-state Nd:YAG laser (355 nm, 3–5 ns pulse width, 200 μJ pulse energy). The laser repetition rate was set to 20–100 Hz and the PDF (pulsed dynamic focusing) delay to 20 μs. The UV/VIS optical fiber (400 μm fiber core diameter, 2 m length) was from OceanOptics (Dunedin, FL). For sampling AP-MALDI generated ions, the voltage on the stainless steel plate that was used to support the chip was set to 1.5 kV. Nano-LC-ESI-MS, for confirming peptide I.D.s in the microchip reservoirs, was performed with an Agilent Technologies HPLC1100 system (Palo Alto, CA). The separation was performed on 10 cm × 100 μm capillaries packed with 5μm particles (Zorbax C18) by using a 10 min long gradient (10–100% B). Data dependent ESI-MS acquisition was performed on the top 3 most intense peaks, and database searching was performed on a Homo sapiens or bovine protein database from SwissProt [false discovery rates (FDR) < 2% at the peptide level].
Sample preparation
Standard protein digests (0.05–5 μM) were prepared in CH3CN/H2O/TFA (5:95:0.01). A nuclear extract from MCF-10A non-tumorigenic epithelial cells, harvested at the S-stage of the cell cycle, was used as a source of a complex mixture of proteins [∼2 μg μL−1 in CH3CN/H2O/TFA (5:95:0.01)]. Cells were cultured in an incubator (5% CO2, 37 °C), arrested by serum deprivation for 48 h, released in the cell cycle with DMEM:F12 (1:1) enriched medium (5% horse serum, 20 ng mL−1 hEGF, 0.5 μg mL−1hydrocortisone, 0.1 μg mL−1 cholera toxin and 10 μg mL−1 bovine insulin), and harvested after 24 h. The cytoplasmic and nuclear fractions were separated with the Cell Lytic™ NuCLEAR™ extraction kit. The protein extract was cleaned with SPEC-PTC18/SPEC-PTSCX solid-phase extraction pipette tips (Agilent Technologies).41
Reagents
HPLC-grade methanol and acetonitrile were obtained from Fisher Scientific (Fair Lawn, NJ) and deionized water (18 MΩ-cm) was generated in-house using a MilliQ ultrapure water system (Millipore, Bedford, MA). Sequencing grade modified trypsin was purchased from Promega Corp. (Madison, WI), ammonium bicarbonate from Aldrich (Milwaukee, WI), and Rhodamine 610 chloride from Exciton (Dayton, OH). Protein standards (bovine hemoglobin, fetuin, albumin, alpha casein 1, carbonic anhydrase 2, beta casein, alpha lactalbumin, cytochrome C, ribonuclease A, and horse cytochrome C and myoglobin) and α-cyano-4-hydroxy-cinnamic acid were purchased from Sigma (St. Louis, MO). MCF-10A cells were obtained from ATCC (Manassas, VA), phenol-red free Dulbecco's modified Eagle's medium (DMEM), F-12 medium and horse serum from Invitrogen (Carlsbad, CA), and charcoal/dextran treated FBS from Hyclone (Logan, UT). The cell Lytic™ NuCLEAR™ extraction kit was from Sigma, and the SPEC-PTC18 and SPEC-PTSCX solid-phase extraction pipette tips were from Agilent.
Results and discussions
Description of the microfluidic LC-MALDI-MS device
The microfabricated LC-MALDI platform facilitates the transposition of a microfluidic separation system into a microarrayed configuration amenable to MALDI-MS investigations (Fig. 1 and 2). The chip comprises a fully integrated LC system that consists of two multichannel electroosmotic flow (EOF) pumps (1A and B), a serpentine mixer (14), two EOF valves (8 and 9), a separation channel (5) with a preconcentrator (4), an orthogonal extraction MALDI interface (11), and a microarray of reservoirs for sample collection (12). The key component of the microfluidic device is the interface that allows for the transposition of the separated sample components into a microarray format, prone for direct MALDI-MS investigations. Shallow multichannel structures, i.e., hundreds of microchannels that intersect the separation channel along its entire length, are used to transfer the sample in a transverse fashion from short sections of the separation channel into distinct arrayed spots, under the influence of an electrical field. Essential microfluidic manipulations such as flow generation, sample loading and injection, as well as transfer into an array for MALDI-MS detection, are all accomplished with the aid of an EOF-based multichannel pumping/valving mechanism. This mechanism relies on the use of a series of shallow channels (∼1.5 μm) for the generation of EOF that open for electrokinetically driven, but close for pressure driven fluidic flows, due to their very large hydraulic-resistance. This mechanism was developed and described extensively in previous work.38,39 On the MALDI chip, the EOF pumps (1A/1B) used for generating flow for the operation of the LC system consisted each of 200 microchannels (20 mm long), while the two inlet/outlet EOF valves (8 and 9) of the double-T injector consisted of 100 microchannels of similar dimensions. EOF was generated by applying a ΔV to reservoirs (2) and (3), and the leakage of EOF in the pump outlet reservoir (3) was prevented by a porous glass disc (40–50 Å pore size) secured to the bottom of the reservoir. The disk enabled the exchange of ions for maintaining electrical continuity, but not of bulk flow. In some chip designs, the two pumps were positioned head-to-head, and the outlet reservoir (3) was common to both pumps. The LC channel (10–20 mm long) was intersected by a series of microchannels for sample transfer to the MALDI reservoirs (10–20 mm long). The intersecting microchannels were placed 50 μm apart, each 2 mm section of the LC channel being connected through 40 microchannels to a 0.8–1 mm diameter sample collection reservoir (12). For in-house fabricated chips, 5 reservoirs could be accommodated per 10 mm length of separation channel. A rinse channel (13) was used to deliver the eluent for electroosmotic sample transfer from the separation channel to the microarrayed reservoirs (12). Pictures of a 2” × 1” microfluidic device mounted on a stand, and of the main LC components are provided in Fig. 3.
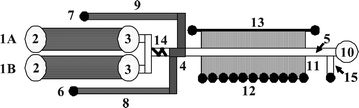 |
| | Fig. 1 Microfluidic LC system interfaced to MALDI-MS detection. (1A & 1B) EOF pumps; (2) pump inlet reservoir; (3) pump outlet reservoir; (4) double-T injector/preconcentrator that contains the sample plug; (5) separation channel; (6) sample reservoir; (7) sample waste reservoir; (8 & 9) EOF valve sample inlet/outlet channels; (10) LC waste reservoir (the reservoir was replaced on most chips by a capillary column inserted in the chip, to facilitate the measurement of the flow through the LC channel); (11) MALDI interface; (12) microreservoir array for MALDI detection; (13) rinse channel; (14) mixer; (15) side channel for packing. | |
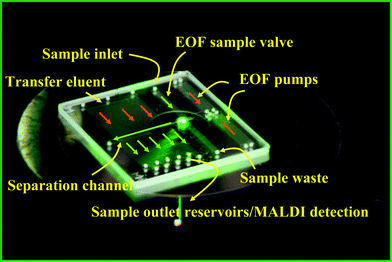 |
| | Fig. 2 Picture of a 2” × 2” microfluidic LC device interfaced to MALDI-MS detection. | |
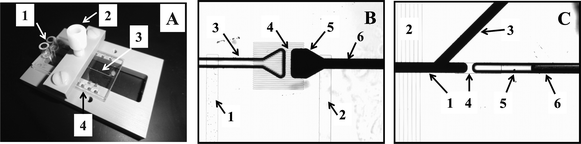 |
| | Fig. 3 Pictures of a 2” × 1” microfluidic LC-MALDI device. (A) Chip mounted on a PEEK polymeric stand during operation: 1-pump inlet reservoirs; 2-pump outlet reservoir; 3-LC channel; 4-microreservoir array. (B) LC separation channel inlet: 1-sample inlet channel; 2-sample outlet channel; 3-channel for eluent delivery from the pumps; 4-multichannel structure for retaining the particles at the LC channel inlet; 5-preconcentrator; 6-LC channel. (C) LC separation channel outlet: 1-LC channel; 2-MALDI interface transfer channels; 3-side channel for LC packing; 4-connection channel (300 μm long × 2 μm deep); 5-chip terminus channel; 6-capillary for flow measurements (inserted completely in the chip during operation). | |
Protocol for sample manipulation on the chip
At start, the EOF pumps were filled through capillary action with low organic content LCeluent (i.e., CH3CN or CH3OH, H2O/organic solvent 95:5 v/v, NH4HCO3 10 mM), and activated at 2000 V cm−1 to pump and fill the entire chip with eluent. The sample was placed in reservoir (6) and loaded through the EOF valve sample inlet/outlet channels (8) and (9) onto the double-T injector, by applying an electrical field of ∼500 V cm−1 between (6) and (7). For a set number of inlet/outlet channels, the amount of sample loaded on the chip was controlled by the time allotted for loading, typically 1–5 min. After loading, the ΔV between reservoirs (6) and (7) was removed, and pumps (1) were activated by applying a ΔV between reservoirs (2) and (3). The field strength on the pumps was ∼1000–2000 V cm−1, and was adjusted to provide flow through the separation channel in the range of 30–100 nL min−1. After rinsing the chip with low organic content solvent (2 min), an eluent step gradient was created by replacing the content of the pump inlet reservoirs with high organic content solvent (H2O/organic solvent 60/40 v/v, NH4HCO3 10 mM). Important to note is that these separations end at T0, when the first eluting components reach the end of the separation channel, and that the goal of the separation was to enable a distribution of the sample components along the channel length such that at the time when the first eluting components reach the end of the channel, the last eluting components enter the beginning. The distribution of the peptide components on the separation channel is determined by the gradient composition and volume. Hydrophilic tryptic peptides move with the eluent front (5% organic solvent), while hydrophobic ones are all eluted from a reversed phase C18 column at 40% organic solvent in the eluent. Therefore, to enable the distribution of sample components along the channel length, the total volume of the gradient must be equal to the dead-volume of the separation channel (V0). For an optimum gradient profile, the sample distribution will be uniform (see theoretical assessment at the end of the manuscript). For optimizing the separation of other types of sample, fluorescently labeled standards could be used to visualize the position of the sample on the separation channel.
After the completion of the separation the electrical field to the pumps was turned off, and the content of each 2 mm section of the LC channel was transferred electroosmotically through the interface microchannels (11) to its corresponding MALDI microreservoir, by applying a ΔV (100–200 V cm−1) between the rinse channel (13) and the reservoirs (12). The total dead-volume of the separation channel was estimated to be only 63 nL, and rinsing with ∼5 μL eluent for 5 min ensured ample sample recovery from the channel. The sample transfer solution contained 40% CH3OH or CH3CN to warrant complete sample elution from the C18 particles and to prevent sample losses by adsorption on the interface microchannel walls. Once the peptides were collected in the microreservoirs, the solvent was evaporated under a gentle stream of N2 to allow for sample deposition on the bottom of the reservoirs, and 0.5 μL of MALDImatrix (α-cyano-4-hydroxycinnamic acid) was added to each reservoir by manual pipetting. The volume of the microreservoirs (∼1 μL) corresponded to the typical sample volumes that are applied to commercial MALDI plates.
Evaluation of the microfluidic LC-MALDI chips
Two designs were developed. In chip design I (2” × 2”), the EOF pumps, valves, LC separation channel and MALDI transfer interface were all 20 mm long (Fig. 2). In the more compact chip design II (2” × 1”), the EOF pumps were 20 mm long, while the EOF valves, LC channel and interface were only 10 mm long (Fig. 3A). The fluidic components also had a slightly different arrangement on the platform.
To evaluate the reproducibility of channel fabrication and flow rates, the sample transfer efficacy to the MALDI reservoirs, the detection limits and the dynamic range, as well as the reproducibility of protein identifications, the microfluidic chips were tested with fluorescent dyes, standard protein digests, and ESI and MALDI-MS detection. Channel depth measurements for over 50 microfluidic chips demonstrated that channel dimensions could be controlled with an accuracy of 2–3% RSD for the LC channels (∼50 μm deep) and 8–9% RSD for the pumping channels (∼1.5 μm deep). The EOF pumps, with no restriction connected to their exit, were capable of generating flow rates in excess of ∼1 μL min−1 (Table 1). When the pumps were incorporated within an LC system, the flows dropped by ∼20% due to the pressure induced leaks that developed through the sample inlet/outlet valves (chip design I). The presence of an increased concentration of organic solvent in the eluent, such as CH3CN, contributed to further lowering the EOFs and the flow through the system (∼650 nL min−1). Interestingly, however, in the presence of a 20 mm long packed LC channel, while the flows dropped to about ∼25% of the value recorded in the absence of the packing (∼150 nL min−1), a larger % of CH3CN in the eluent system was beneficial to preserving the flow rates due to lowering the viscosity of the aqueous/organic eluent (∼180 nL min−1). This was not the case when CH3OH was used as an organic modifier, as CH3OH/H2O mixtures reach a maximum viscosity at ∼50% CH3OH. Earlier studies of water–alcohol mixtures show some anomalies in the physical properties of these mixtures due to the fact that alcohol molecules disrupt hydrogen bonding in water. As a result, the viscosity of the mixture reaches a maximum at ∼50% methanol content.42,43 In the presence of the MALDI interface, due to additional leaks, the flows dropped to ∼65–75% of the value without the interface. Flow rates were roughly double with the 10 mm long separation channels (chip design II). To generate the data in Table 1, over 50 individual chips with various eluents were tested for several hours of operation. The measurements were performed at field strengths of 1000–2000 V cm−1 applied to the pumps, and the RSD of flow rate measurements was in the range of 2–10%.
Table 1
Eluent flows generated with the EOF pumps incorporated within a microfluidic LC system, in the absence and presence of the MALDI interface
|
Eluent: NH4HCO3 (10 mM) |
Flow nL min−1 |
SD |
RSD (%) |
|
This chip generated higher flow rates than typical (100–120 nL min−1), therefore, direct flow comparisons with the other chips should not be made.
|
CH
3
CN/H
2
O, 10![[thin space (1/6-em)]](https://www.rsc.org/images/entities/b_char_2009.gif) :90 v/v (EOF pump alone) :90 v/v (EOF pump alone) |
1000–1100 |
80–110 |
8–10 |
|
CH
3
CN/H
2
O, 10:90 v/v (LC, 20 mm, no packing) |
816 |
12.8 |
1.7 |
|
CH
3
CN/H
2
O, 40:60 v/v (LC, 20 mm, no packing) |
652 |
20.3 |
3.1 |
|
CH
3
CN/H
2
O, 10:90 v/v (LC, 20 mm packed) |
149 |
9.1 |
6.1 |
|
CH
3
CN/H
2
O, 40:60 v/v (LC, 20 mm packed) |
177 |
15 |
8.5 |
|
CH
3
CN/H
2
O, 10:90 v/v (LC/MALDI, no packing) |
548 |
35 |
6.4 |
|
CH
3
CN/H
2
O, 40:60 v/v (LC/MALDI, no packing) |
485 |
20 |
4.1 |
|
CH
3
CN/H
2
O, 10:90 v/v (LC/MALDI, 20 mm packed) |
109 |
4.7 |
4.3 |
|
CH
3
CN/H
2
O, 40:60 v/v (LC/MALDI, 20 mm packed)a |
180 |
7.1 |
3.9 |
To visualize sample loading, elution and transfer through the interface, the chips were further tested with a solution of fluorescent dye (Rhodamine 610). Fig. 4 provides an enlarged view of various sections of the LC-MALDI chip during this process. An empty chip, with no packing, was filled with low organic content buffer (Fig. 4A), and then with a 25 μM dye solution (Fig. 4B). An un-packed chip was chosen for this purpose because it allowed complete filling with fluorescent dye (in a packed LC channel, Rhodmine 610 adsorbs at the channel entrance without filling its whole length). Next, the rinse channel was filled with blank eluent containing CH3CN (40%), and EOF was generated from left to right. The elution of the LC channel content through the intersecting microchannels into the MALDI reservoirs, through an EOF mechanism, is shown in Fig. 4C. As a result of the blank eluent flowing into the separation channel, the left side microchannels are dark and not visible in the figure. The right side microchannels contain fluorescent dye coming from the separation channel and are bright and visible. The terminal site of the transfer microchannels, as they enter the MALDI reservoirs, is provided in Fig. 4D. To visualize the behavior of a sample plug on the microfluidic LC-MALDI device, the capability to handle the sample in a packed channel, to elute it from the packing material, and to collect it in a MALDI reservoir, a fluorescent Rhodamine 610 solution was loaded on the inlet of a packed LC chip (Fig. 4E). The fluorescent plug was eluted with organic buffer solution and positioned in the middle of the packed LC separation channel (Fig. 4F, bright spot, ∼100 μm wide). The same section, after Rhodamine 610 elution and transfer into the MALDI reservoir (the channel does not contain any more fluorescent dye and is dark), and a MALDI reservoir with sample and the laser beam impacting on the reservoir, are shown in Fig. 4G and 4H, respectively. The experiments demonstrate that the fluid flows can be effectively controlled in the proposed microfluidic design, and that the sample can be efficiently collected for detection in the MALDI reservoirs.
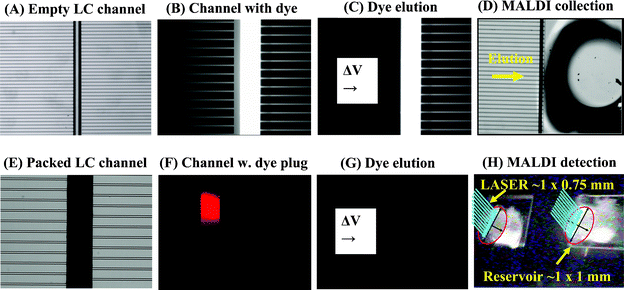 |
| | Fig. 4 Visualization of sample elution from an LC separation channel interfaced through a series of microchannels to the MALDI collection reservoirs. (A) Empty LC channel; (B) LC channel filled with a fluorescent dye; (C) Dyeelution from the LC channel (EOF is generated from left to right); (D) Sample collection in the MALDI reservoir; (E) Packed LC channel; (F) Packed LC channel loaded with a plug of fluorescent Rhodamine dye (plug width ∼100 μm); (G) Channel after elution of the Rhodamine plug into the MALDI reservoir (no fluorescence); (H) MALDI-MS detection in the chip microreservoir. | |
MALDI-MS detection limits and dynamic range were assessed directly from the chip reservoirs by loading separately 1 μL volumes of 9 test proteins with concentrations in the 0.01–10 μM range. The corresponding sample amounts were 10 fmol, 100 fmol, 1 pmol and 10 pmol, the detection of some proteins at the 10 fmol level indicating an achievable dynamic range in excess of 103. Consistent detection of all tested proteins was, however, possible only at the 100 fmol level. A comparison of the spectral quality for bovine cytochrome C and hemoglobin at the 10 fmol and 1 pmol levels, respectively, obtained from the glass microfluidic reservoirs and a regular stainless steel MALDI target plate, is provided in Fig. 5. While some variability in ion intensities generated from the two platforms was observable, the main matching peptides were the same. When an LC separation of the same proteins was performed prior to MALDI-MS analysis, the detection limits were in the 50–300 fmol range. To investigate the ability to detect multiple peptides from the same microfluidic reservoir, the mixture of tryptic peptides generated from 9 standard proteins was deposited in one single collection reservoir. Up to 50 unique peptides could be identified in the reservoir, but only at >1 pmol levels. The benefit of using the microfluidic chip for the analysis of complex mixtures, instead of a conventional target plate, rests, evidently, in the capability to perform dynamic sample processing before detection to improve both detection limits and dynamic range.
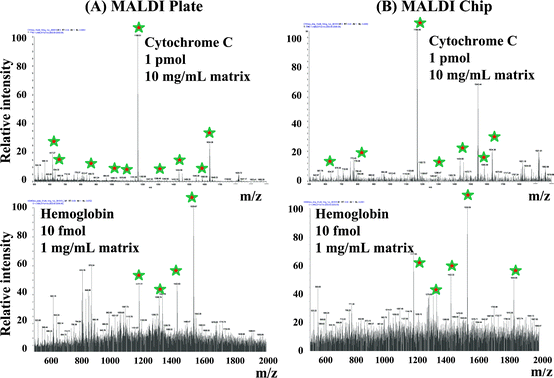 |
| | Fig. 5 Comparison of AP-MALDI mass spectra of tryptic peptides. (A) Peptides deposited on a stainless steel MALDI plate; (B) Peptides collected in the glass microfluidic array of reservoirs. AP-MALDI-MS data acquisition conditions are provided in the experimental section. | |
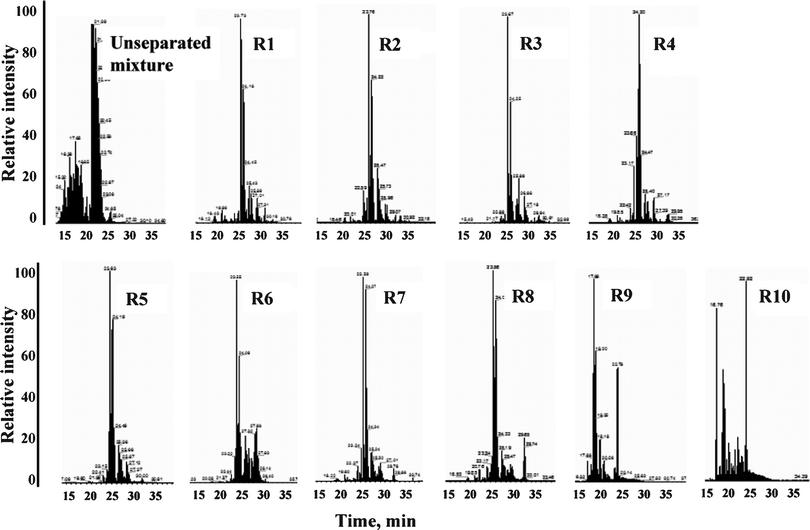
For I.D. confirmation by tandem MS, the peptides were extracted from the reservoirs and analyzed by bench-top LC-ESI-MS/MS. Confirmation of the I.D. by ESI-MS/MS was necessary, as data-dependent tandem MS could not be implemented routinely on the MALDI chip due to sample depletion in the reservoirs prior to completion of the analysis. Up to 5–10 mass spectra could be generated per reservoir, prior to sample depletion, but the quality of the spectra was not always optimal. Moreover, as already described, MALDI generates mainly singly charged ions that do not produce informative tandem mass spectra, and MS detection based on m/z alone on a low mass accuracy ion trap instrument is not sufficient for peptide I.D. confirmation due to high-rates of false identifications. In the mixture of 9 test proteins, for example, there are 26 sets of undistinguishable peptides (m/z < 2000 and Δm/z < 0.15 amu per set) that match 56 unique theoretical peptide sequences from these proteins (Table S1, ESI†). To accurately identify the sequence of amino acids in these peptides, tandem MS is necessary. This is not a limitation of the chip, but rather of the type of mass spectrometer that is used for analysis. The use of such chips with high mass accuracy MALDI-TOF detection systems could improve the mass accuracy for peptide identifications and forfeit the need for tandem MS. For the proteolytic tryptic digest of 9 standard proteins (4–5 μM concentration, ∼1 μL loaded on the chip), all protein components were identified in the collection reservoirs by 45 unique peptides (Bioworks p-scores < 0.001). The LC-ESI-MS separations that confirmed the peptide I.D.s are provided in Fig. 6. The chip comprised a 20 mm separation channel and 10 collection reservoirs. Most peptides were spread through 1–3 reservoirs, most likely due to the operation of the LC-MALDI chip at very low flow rates, below the optimal values that ensured maximum separation efficiency. However, most peptides peaked only in one reservoir. In terms of throughput, complete sample analysis on the chip (loading, rinsing, elution, transfer into the detection array) could be accomplished in <20 min.
 |
| | Fig. 6 Bench-top LC-ESI-MS/MS analysis of peptides extracted from the MALDI chip reservoirs. A proteolytic digest of a mixture of 9 standard proteins was loaded on a chip (design I), separated, collected in the MALDI reservoirs, and extracted for ID confirmation by ESI-MS/MS (see conditions in the experimental section of the manuscript). | |
The reproducibility of protein identifications was assessed with a proteolytic digest of a mixture of 13 proteins. The sample (∼1 μL) was loaded on the chip, separated, and transferred into the MALDI reservoirs (chip design II). As most peptides were spread through 2–3 collection reservoirs, it was estimated that each reservoir collected ∼1 pmol of protein. Ten replicate analyses were performed. For peptide ID confirmation, the samples were extracted from the reservoirs and analyzed by data-dependent ESI-MS/MS. A total of 160 matching peptides were identified for the set of 13 parent proteins, some peptides being identified consistently in each of the ten replicates, some only randomly. For the top scoring 100 peptides, a tiered evaluation of reproducibility included: the 1st tier peptide set resulted in 100% identification in all 10 runs (25 peptides), the 2nd tier in 80–90% (21 peptides), the 3rd tier in 60–70% (28 peptides), the 4th tier in 50% (10 peptides), and the 5th tier (16 peptides) in 30–40% identification rates, respectively (Table S2, ESI†). Such results are in line with the outcome of data-dependent analysis which results in progressively more peptide IDs with the completion of more replicates (saturation after 5–6 replicate runs). As all proteins were identified in each experimental replicate by several high-confidence peptides (1st tier), the results demonstrate the applicability of the microfluidic platform for proteomic applications that involve the analysis of complex samples.
Analysis of complex sample extracts
High-throughput proteomic investigations and biomarker discovery and screening are the most relevant application areas that are envisioned for this device. To establish this capability, a cytoplasmic cell extract generated from MCF-10A breast epithelial cells was loaded on the chip, separated, extracted in the reservoirs, and analyzed. The number of identified proteins/μg sample and the detection reproducibility in 3 replicate runs were evaluated (Table S2, ESI†). The analysis of ∼1 μL sample (∼2 μg μL−1) enabled the identification of 205 proteins (75 proteins were identified in all 3 runs, 25 proteins in 2 runs, and the rest in only one run). While the LC separation was less than optimal, the chip functioned as a prefractionation device that enabled the detection of 4–5 times more proteins than a bench-top LC-MS setup analyzing the unfractionated sample. As a result, the data were mined for a set of proteins with known biomarker utility. The identified markers represented proteins involved in essential cellular processes that have been demonstrated in earlier work to lead to cancer on-set and development, i.e., cell proliferation, cell cycle regulation, DNA repair, apoptosis and invasion/metastasis. These proteins included putative biomarkers of breast, hepatocellular, head and neck, non-small cell lung and endometrial cancers, such as: X-ray repair cross-complementing protein 6, Coronin-1B, Nucleolin, Isoform 1 of Clathrin heavy chain 1 and Elongation factor 1-alpha 1 were identified in all 3 runs; Coronin-1C, Ezrin, Cofilin and Proliferation-associated protein 2G4 were identified in 2 out of 3 runs; and Translationally-controlled tumor protein was identified in only 1 out of 3 runs.44
Theoretical implications for separations that occur within the column dead-volume
Peptide samples are typically separated by a shallow eluent gradient containing 10–40% acetonitrile, and in the case of the MALDI chip, the ideal eluent gradient must distribute the sample components uniformly along the separation channel length. In addition, essential for the success of the MALDI-chip, is that the interface does not alter the performance of the LC separation. The implications of these requirements are discussed below.
(a) Separation efficiency.
The key issue of the sample transfer process is related to the preservation of separation integrity (i.e., resolution, efficiency and peak capacity). Provided that the presence of the interface itself does not interfere with the separation, the larger the number of microreservoirs, the better the separation integrity will be preserved. Ideally, the number of reservoirs should equal the peak capacity of the separation (Fig. 7A). Practically, however, the resolution and peak capacity will be limited by the number of collection reservoirs on the chip. Commercial nano-LC columns used in proteomics (5 μm particle diameter, 10 cm long, 10–20 min long separations) achieve typically a peak capacity of 50–75.45–47 Complete separation of all peptide components is not needed, however, with MS detection, but rather an effective peptidefractionation that enables the MS identification of 5–25 peptides/proteins per reservoir. As discussed earlier, as many as ∼50 peptides could be detected in one single reservoir with the present AP-MALDI-MS ion source. This is also in line with the capability of MS platforms that perform data dependent analysis of 5–25 co-eluting peptides. The length of the separation channel, under such circumstances, should be devised to match the sample complexity. The use of advanced ultrasonic or laser drilling techniques would enable the fabrication of orifices with diameters 100–500 μm, a size that would suffice for matching the average peak width on the separation channel. We note that the sample plug at start is defined by the dimensions of the preconcentrator and the amount of sample loaded on the chip, and, as we have shown earlier, this plug width is 100–500 μm.39 As a conservative example, based on results obtained from LC chips with similar design interfaced to on-line ESI-MS,48 for a separation time window of ∼5 min, the peak width of a peptide eluting at Tr ∼ 2 min was W1/2 ∼ 3 s, the separation efficiency ∼9000 [N = 5.54 × (T/w1/2)2], and the peak capacity ∼50. This is equivalent to ∼50 reservoirs (∼400 μm diameter) to be accommodated along a 20 mm long separation channel. Theoretically, such a chip could enable the detection of up to ∼2500 peptides, a milestone that satisfies the needs of a complex proteomic sample. An accurate evaluation of separation efficiency cannot be accomplished, however, because this would require an accurate definition of the peak shape, i.e., the acquisition of 10–20 datapoints per peak. This would involve the fabrication of 10–20 reservoirs per 100–500 μm channel length, a performance that would be extremely difficult to accomplish even with advanced laser drilling techniques. Nevertheless, a sample collection strategy in streaks, instead of reservoirs, could forfeit such challenges.
 |
| | Fig. 7 Schematics representing the: (A) Preservation of separation integrity; and (B) The progression of the separation in a microfluidic channel. | |
(b)
Eluent gradient.
For the MALDI-chip that was described in this work, the eluent gradient is limited to a time-window corresponding to the elution of the first peptides (≤T0), i.e., the elution volume should be equivalent to, or less than the void/dead-volume (V0) of the separation channel. To warrant a complete analysis of the sample, all components must line up on the channel prior to beginning the sample transfer to the MALDI reservoirs. For an effective separation time Teff = T0, the gradient steepness will be determined by V0 and the eluent flow rate (F), while the gradient shape (linear, convex, concave) by the composition of the mixture to be separated. The progress of the separation according to eqn (1), in terms of time (T) required to fill the LC channel with a volume V0 of eluent is described by eqn (1) (Fig. 7B).| |  | (1) |
Where, V0/F = T0 represents the time corresponding to filling the channel void volume V0 at flow rate F, and, x represents the fraction of the column void volume that remains to be filled at some time point during the analysis. Provided that the composition of the eluent gradient will enable the first eluting peptides to be carried without retention on the column, and the last eluting peptides to just enter the column at the end of the separation, the following scenarios will be encountered (eqn (2)–(5)):
| | | Ts = T0 − V0/F = T0 − T0 = 0 (x = 1) | (2) |
Ts-start time, 1st component enters the separation channel
| | | T0.5 = T0 − 0.5V0/F= T0 − 0.5T0 = 0.5T0 (x = 0.5) | (3) |
T0.5-mid time, some components are distributed on the channel
Tf-end time, 1st component reaches the end of the separation channel while the last component enters the beginning
| | | Teff = T0 − (T0 − V0/F) = V0/F = T0 | (5) |
Teff-effective separation time.
For simplicity, we will assume that our packed microfluidic LC channel (20 mm long, 50 μm deep, 110 μm width) is a capillary column of same length and radius r = 50 μm. Based on an average interparticle porosity of 0.4, the void-volume of the packed column will be V0 = 0.4 × 157 nL = 63 nL. As a result, the gradient will have to be accomplished within a total volume of 63 nL, and for an optimum flow rate of F = 100 nL min−1, the separation time will be T0 = 38 s (0.63 min). At the gradient extremes, one of the microfluidic pumps should be able to deliver flow at 5 nL min−1, i.e., an eluent with only 5% content in one of its constituents. If the acceptable accuracy in flow control is ±1%, at such extremes, the pumps should deliver eluent flow with a variability of <50 pL min−1, a milestone difficult to accomplish even with microfluidic chips.49 For longer separation times, i.e., lower flow rates at the same optimal gradient, the demands on the pumping system would be even more challenging, and the separation column would operate in a regime with poor efficiency. Alternatively, for optimal flow rates, but an un-adequate gradient, the quality of the analysis will be impaired: (a) if the gradient is executed within a volume Vgradient > V0, either the first eluting components will leave the column, or the last eluting components will not enter the column and will be lost for analysis; (b) if the gradient is executed within Vgradient < V0, the sample components will be distributed only on a fraction of the separation column, and, some components will be analyzed in batch, without separation at all.
(c) Sample losses through the LC-MALDI interface.
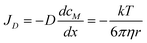
At last, let's consider the impact of the LC-MALDI interface on preserving the separation integrity and detection limits. The processes that contribute to the mass transfer of an analyte in the LC channel, in terms of flux, are: chromatographic elution and retention, as a result of a pressure gradient between the inlet and the outlet of the LC channel, and of partition in the stationary phase (eqn (6)); loss by convection through the microchannel interface, as a result of pressure gradients between the separation channel and the MALDI reservoirs (eqn (7)); and, loss by diffusion in the microchannel interface, as a result of concentration gradients between the separation channel and the MALDI reservoirs (eqn (8)) (Fig. S1, ESI†).| | 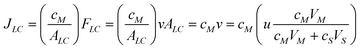 | (6) |
| | 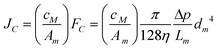 | (7) |
| |  | (8) |
Where, JLC – analyte flux through the LC channel [mol/(m2s)], JC – convection flux [mol/(m2s)] through one microchannel, JD – diffusion flux [mol/(m2s)], FLC-eluent flow through the LC channel [m3 s−1], FC – eluent flow lost by convection through one interface microchannel [m3 s−1], ALC – cross section of the LC channel [m2], Am – cross-sectional area of an interface microchannel [m2], v – analyte velocity in the LC separation channel [m s−1], u – eluent velocity in the LC separation channel [m s−1], cM – analyte concentration in the mobile phase (eluent), cS – analyte concentration in the stationary phase, VM – volume of the mobile phase, VS – volume of the stationary phase, η – dynamic viscosity [Ns/m2], Δp – pressure gradient between the microchannel ends [N m−2], Lm – microchannel length [m], dm – microchannel diameter [m], D – diffusion coefficient [m2 s−1], x – distance [m], T – absolute temperature [°K], k – Boltzmann constant [J K−1], r – particle radius [m].
If diffusion is ignored, as it is small and occurs as a natural process in the system, the main losses of sample will occur as a result of pressure gradients through the microchannel interface. As the plug of each sample component is carried down the separation channel, a fraction of each component will leak out in every interface microchannel. During sample transfer for detection, these losses will be transferred back to the LC channel and further to the MALDI reservoirs, to result ultimately in the contamination of the main components collected in these reservoirs. Overall, the outcome will be loss of separation efficiency and peak capacity, and worse detection limits. Assuming that the microchannels have a circular cross section and that the loss is uniform through all microchannels, for a preset % sample loss, the diameter of the interface microchannels can be calculated from the following flow considerations (eqn (9)):
| | 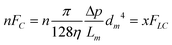 | (9) |
Where n = 400 (the number of interface microchannels that intersect a 20 mm long separation channel), FC = convection flow through one microchannel, η = 0.001 Ns/m2, Lm = 0.01 m, Δp ∼ 6.8 × 10⁵ N m−2 (∼100 psi), and FLC = 100 × 10−12/60 m3 s−1 (100 nL min−1), x = fraction loss of sample through flow leakage. Δp values were estimated from previous work that involved the evaluation of the EOF pumping system.38,39 The calculated microchannel diameter should be dm < 0.4 μm for <1% sample loss, and dm < 1 μm for <40% sample losses.
(d) Practical implementation.
Given the constraints outlined in the above-section, the ideal microfluidic LC-MALDI chip should deliver eluent flows that enable the operation of the LC separation at optimal efficiencies, should generate eluent gradients that can distribute the sample components uniformly along the separation channel within T0, and should prevent eluent and sample leakage through the LC-MALDI interface to avoid the loss of separation efficiency, peak capacity, detection limits and dynamic range. While optimal flow rates could be generated with the EOF pumping system incorporated in the chip, as observed from Table 1, an adequate control of flow reproducibility and consequently the generation of a solvent gradient within a volume equivalent to V0, was not achievable with the home-made microfluidic device. As a result, a step gradient was applied by changing the organic eluent content in the chip reservoirs from 0% to 40%, which, for practical purposes, resulted in the generation of a solvent gradient internal to the EOF pumping channels. As the precise composition, length and position of the gradient was not known, sample elution was typically performed within a time-window of at least 5 min, at flow rates of ∼30 nL min−1. Low eluent flow rates resulted in lower pressure gradients along the interface microchannels and smaller sample losses governed by hydrodynamic effects, but also in larger losses governed by diffusion and potential loss of separation efficiency. For ease of fabrication and improved reproducibility, the MALDI interface channels had a larger-than-ideal depth of ∼1.5 μm, but the actual flow losses were ∼35% (see Table 1), i.e., less than predicated by the model. This outcome was expectable, as the pressure gradients along the interface microchannels were not uniform, being high at the head (large losses), and low (small losses) at the end of the LC separation channel. Nevertheless, the sample leakage contributed to sample spreading and contamination across multiple reservoirs. Overall, it is anticipated that the fabrication of a chip with improved design under carefully controlled clean-room conditions, operation at controlled room temperatures, and the use of stable power supplies, could enhance the performance of the device to ultimately enable efficient separations on the T0 time-scales. The ultimate challenge will continue to rest with the generation of controllable flow rates in the very low pL-nL min−1 range.
Conclusions
The microfluidic device that was developed in this research describes an innovative strategy for performing fluidic manipulations on a chip and interfacing to MALDImass spectrometry. The array of functional elements that enable complex sample processing prior to MALDI-MS detection on the same chip, and the use of LC separations with large sample loading capacity and ability to separate complex peptide mixtures, will result in improved dynamic range and detection limits, and will provide a clearly superior alternative to the static, low dynamic range MALDI target plates that are typically used for proteomic applications. The proposed device will also enable off-line sample collection, processing and storage into an array to facilitate convenient sample analysis at remotely-located MS labs, with no need for MS expertise at the collection site. Decoupling the separation from MS detection will facilitate the operation of both techniques independently, at their own optimal speed dictated by the chromatographic or MS performance. The ability to generate peptide arrays using the same technologies that are used for preparing proteomic samples for MS detection, and to perform multiplexing and simultaneous microarraying from integrated LC separation systems, will greatly enhance our capacity to perform high-throughput MALDI-MS from a chip. Future developments will include the fabrication of microfluidic platforms that deliver the MALDI matrix through microfluidic infusion on the chip, the implementation of conventional vacuum MALDI and tandem MS capabilities, and the implementation of 2D separations prior to MS detection. The stand-alone format will result in the fabrication of inexpensive, disposable platforms that prevent sample contamination, carryover and false positive identifications, qualities that are much required in clinical applications that seek screening for biomarkers.
Acknowledgements
This project was supported by Award Number R21CA126669-01A1 from the National Cancer Institute. The content is solely the responsibility of the authors and does not necessarily represent the official views of the National Cancer Institute or the National Institutes of Health. The authors thank Debby Reed and the Chemistry glass shop for help with the fabrication of the chips.
References
- V. L. Laiko, S. C. Moyer and R. J. Cotter, Anal. Chem., 2000, 72, 5239–5243 CrossRef CAS.
- M. C. Galicia, A. Vertes and J. H. Callahan, Anal. Chem., 2002, 74, 1891–1895 CrossRef CAS.
- C. A. Miller, D. Yi and P. D. Perkins, Rapid Commun. Mass Spectrom., 2003, 17, 860–868 CrossRef CAS.
- I. M. Lazar, J. Grym and F. Foret, Mass Spectrom. Rev., 2006, 25, 573–594 CrossRef CAS.
- A. D. Zamfir, J. Chromatogr., A, 2007, 1159, 2–13 CrossRef CAS.
-
I. M. Lazar, Handbook of Capillary and Microchip Electrophoresis and Associated Microtechniques, ed. J. P. Landers, CRC Press, 2007, pp. 1459–1506 Search PubMed.
- S. Koster and E. Verpoorte, Lab Chip, 2007, 7, 1394–412 RSC.
- F. Foret and P. Kusý, Eur. J. Mass Spectrom., 2007, 13, 41–44 CrossRef CAS.
- J. Lee, S. A. Soper and K. K. Murray, Anal. Chim. Acta, 2009, 649, 180–190 CrossRef CAS.
- C. A. Baker, C. T. Duong, A. Grimley and M. G. Roper, Bioanalysis, 2009, 1, 967–975 CrossRef CAS.
- T. Sikanen, S. Franssila, T. J. Kauppila, R. Kostiainen, T. Kotiaho and R. A. Ketola, Mass Spectrom. Rev., 2010, 29, 351–391 Search PubMed.
-
X. Mao and I. M. Lazar, Applications of Microfluidic Devices with Mass Spectrometry Detection in Proteomics, in Sample Preparation in Biological Mass Spectrometry, ed. A. Ivanov and A. Lazarev, Springer, 2011, pp. 1051–1074 Search PubMed.
- L. Y. Yeo, H.-C. Chang, P. P. Y. Chan and J. R. Friend, Small, 2011, 7, 12–48 CrossRef CAS.
- T. Miliotis, S. Kjellström, J. Nilsson, T. Laurell, L. E. Edholm and G. Marko-Varga, J. Mass Spectrom., 2000, 35, 369–377 CrossRef CAS.
- T. Laurell, L. Wallman and J. Nilsson, J. Micromech. Microeng., 1999, 9, 369–376 CrossRef.
- H. K. Musiyimi, J. Guy, D. A. Narcisse, S. A. Soper and K. K. Murray, Electrophoresis, 2005, 26, 4703–4710 CrossRef.
- J. Lee, H. K. Musyimi, S. A. Soper and K. K. Murray, J. Am. Soc. Mass Spectrom., 2008, 19, 964–972 CrossRef CAS.
- C.-W. Tsao, S. Tao, C.-F. Chen, J. Liu and D. L. De Voe, Microfluid. Nanofluid., 2010, 8, 777–778 CrossRef CAS.
- J. Lee, S. A. Soper and K. K. Murray, Rapid Commun. Mass Spectrom., 2011, 25, 693–699 CrossRef CAS.
- J. Liu, K. Tseng, B. Garcia, C. B. Lebrilla, E. Mukerjee, S. Collins and R. Smith, Anal. Chem., 2001, 73, 2147–2151 CrossRef CAS.
- M. L.-S. Mok, L. Hua, J. B.-C. Phua, M. K.-T. Wee and N. S.-K. Sze, Analyst, 2004, 129, 109–110 RSC.
- X. Guo, M. B. Chan-Park, S. F. Yoon, J.-H. Chun, L. Hua and N. S.-K. Sze, Anal. Chem., 2006, 78, 3249–3256 CrossRef CAS.
- M. Brivio, N. R. Tas, M. H. Goedbloed, H. J. G. E. Gardeniers, W. Verboom, D. N. Reinhoudt and A. van den Berg, Lab Chip, 2005, 5, 378–381 RSC.
- M. Gustafsson, D. Hirschberg, C. Palmberg, H. Jornvall and T. Bergman, Anal. Chem., 2004, 76, 345–350 CrossRef CAS.
- D. Hirschberg, T. Jagerbrink, J. Samskog, M. Gustafsson, M. Stahlberg, G. Alvelius, B. Husman, M. Carlquist, H. Jornvall and T. Bergman, Anal. Chem., 2004, 76, 5864–5871 CrossRef CAS.
- M. Yang, T.-C. Chao, R. Nelson and A. Ros, Anal. Bioanal. Chem., 2012, 404, 1681–1689 CrossRef CAS.
- D. Chatterjee, A. J. Ytterberg, S. U. Son, J. A. Loo and R. L. Garrell, Anal. Chem., 2010, 82, 2095–2101 CrossRef CAS.
- S. C. C. Shih, H. Yang, M. J. Jebrail, R. Fobel, N. McIntosh, O. Y. Al-Dirbashi, P. Chakraborty and A. R. Wheeler, Anal. Chem., 2012, 84, 3731–3738 CrossRef CAS.
- A. E. Kirby and A. R. Wheeler, Lab Chip, 2013 10.1039/C3LC41431K.
- J. Y. M. N. Engwegen, M.-C. W. Gast, J. H. M. Schellens and J. H. Beijnen, Trends Pharmacol. Sci., 2006, 27, 251–259 CrossRef CAS.
- T. Köcher and G. Superti-Furga, Nat. Methods, 2007, 4, 807–815 CrossRef.
- P. Cutler, Proteomics, 2003, 3, 3–18 CrossRef CAS.
- R. E. Jenkins and S. R. Pennington, Proteomics, 2001, 1, 13–29 CrossRef CAS.
- A. Lueking, M. Horn, H. Eickhoff, K. Büssow, H. Lehrach and G. Walter, Anal. Biochem., 1999, 270, 103–111 CrossRef CAS.
- D. Figeys, Proteomics, 2002, 2, 373–382 CrossRef CAS.
- D. J. Harrison, A. Manz, Z. H. Fan, H. Ludi and H. M. Widmer, Anal. Chem., 1992, 64, 1926–1932 CrossRef CAS.
- S. C. Jacobson, R. Hergenroder, L. B. Koutny, R. J. Warmack and J. M. Ramsey, Anal. Chem., 1994, 66, 1107–1113 CrossRef CAS.
- I. M. Lazar and B. L. Karger, Anal. Chem., 2002, 74(24), 6259–6268 CrossRef CAS.
- I. M. Lazar, P. Trisiripisal and H. A. Sarvaiya, Anal. Chem., 2006, 78(15), 5513–5524 CrossRef CAS.
- G. A. Lord, D. B. Gordon, P. Myers and B. W. King, J. Chromatogr., A, 1997, 768, 9–16 CrossRef CAS.
- H. A. Sarvaiya, J. H. Yoon and I. M. Lazar, Rapid Commun. Mass Spectrom., 2006, 20, 3039–3055 CrossRef CAS.
- J. W. Thompson, T. J. Kaiser and J. W. Jorgenson, J. Chromatogr., A, 2006, 1134, 201–209 CrossRef CAS.
- H. Kubota, S. Tsuda, M. Murata, T. Yamamoto, Y. Tanaka and T. Makita, Rev. Phys. Chem. Japan, 1979, 49, 59–69 CAS.
- J. M. Armenta, M. J. Perez, X. Yang, D. Shapiro, D. Reed, L. Tuli, C. V. Finkielstein and I. M. Lazar, J. Chromatogr., A, 2010, 1217, 2862–2870 CrossRef CAS.
- K. Horie, Y. Satob, T. Kimurab, T. Nakamurab, Y. Ishihamac, Y. Odab, T. Ikegamid and N. Tanakad, J. Chromatogr., A, 2012, 1228, 283–291 CrossRef CAS.
- X. Wang, W. E. Barber and W. J. Long, J. Chromatogr., A, 2012, 1228, 72–88 CrossRef CAS.
- K. Broeckhoven, D. Cabooter, S. Eeltink and G. Desmet, J. Chromatogr., A, 2012, 1228, 20–30 CrossRef CAS.
- I. M. Lazar, Electrophoresis, 2009, 30, 262–275 CrossRef CAS.
- D. Amarie, J. A. Glazier and S. C. Jacobson, Anal. Chem., 2007, 79, 9471–9477 CrossRef CAS.
Footnote |
| † Electronic supplementary information (ESI) available: See DOI: 10.1039/c3lc50190f |
|
| This journal is © The Royal Society of Chemistry 2013 |
Click here to see how this site uses Cookies. View our privacy policy here.  Open Access Article
 This Open Access Article is licensed under a Creative Commons Attribution-Non Commercial 3.0 Unported Licence