 Open Access Article
 This Open Access Article is licensed under a Creative Commons Attribution-Non Commercial 3.0 Unported Licence
Study of endothelial cell apoptosis using fluorescence resonance energy transfer (FRET) biosensor cell line with hemodynamic microfluidic chip system†
J. Q.
Yu
a,
X. F.
Liu
b,
L. K.
Chin
a,
A. Q.
Liu
a and
K. Q.
Luo
*b
aSchool of Electrical and Electronic Engineering, Nanyang Technological University, 50 Nanyang Avenue, Singapore 639798. E-mail: kluo@ntu.edu.sg
bSchool of Chemical and Biomedical Engineering, Division of Bioengineering, Nanyang Technological University, 70 Nanyang Drive, Singapore 637457
First published on 21st March 2013
Abstract
To better understand how hyperglycemia induces endothelial cell dysfunction under the diabetic conditions, a hemodynamic microfluidic chip system was developed. The system combines a caspase-3-based fluorescence resonance energy transfer (FRET) biosensor cell line which can detect endothelial cell apoptosis in real-time, post-treatment effect and with a limited cell sample, by using a microfluidic chip which can mimic the physiological pulsatile flow profile in the blood vessel. The caspase-3-based FRET biosensor endothelial cell line (HUVEC-C3) can produce a FRET-based sensor protein capable of probing caspase-3 activation. When the endothelial cells undergo apoptosis, the color of the sensor cells changes from green to blue, thus sensing apoptosis. A double-labeling fluorescent technique (yo pro-1 and propidium iodide) was used to validate the findings revealed by the FRET-based caspase sensor. The results show high rates of apoptosis and necrosis of endothelial cells when high glucose concentration was applied in our hemodynamic microfluidic chip combined with an exhaustive pulsatile flow profile. The two apoptosis detection techniques (fluorescent method and FRET biosensor) are comparable; but FRET biosensor offers more advantages such as real-time observation and a convenient operating process to generate more accurate and reliable data. Furthermore, the activation of the FRET biosensor also confirms the endothelial cell apoptosis induced by the abnormal pulsatile shear stress and high glucose concentration is through caspase-3 pathway. A 12% apoptotic rate (nearly a 4-fold increase compared to the static condition) was observed when the endothelial cells were exposed to a high glucose concentration of 20 mM under 2 h exhaustive pulsatile shear stress of 30 dyne cm−2 and followed with another 10 h normal pulsatile shear stress of 15 dyne cm−2. Therefore, the most important finding of this study is to develop a novel endothelial cell apoptosis detection method, which combines the microfluidic chip system and FRET biosensor. This finding may provide new insight into how glucose causes endothelial cell dysfunction, which is the major cause of diabetes-derived complications.
Introduction
Diabetes mellitus is a disease with worldwide high morbidity and mortality, which is a serious threat to human health. Deficiency of blood glucose control in patients of Type 2 diabetes increases the risk of microvascular end-points associated with peripheral neuropathy, nephropathy and retinopathy as well as macrovascular diseases such as atherosclerosis.1–3 A wide variety of studies suggest that hyperglycemia is the primary cause of the development and progression of abnormal vascular growth and the complications of diabetes, whose major risk factor is the endothelial cells dysfunction under high glucose concentration.4–9 Previously, others have demonstrated the underlying molecular mechanisms of how hyperglycemia causes endothelial cell apoptosis and necrosis, such as polyol pathway flux,5 oxidative stress,6 non-enzymatic glycation and diacylglycerol-protein kinase C (DAG-PKC) activation.7 Among them, the main reason is the overproduction of reactive oxygen species (ROS) caused by oxidative stress, which is related to PKC-dependent NAD(P)H oxidase activation and the down-regulation of activity, and the expression of eNOS.8,9However, another important factor, i.e. shear stress, which is imposed tangentially to the cell surface caused by the pulsatile hemodynamic forces in the blood vessels, has often been ignored. Appropriate pulsatile shear stress is a well-known critical factor in the development of blood vessel structure either during early growth or adulthood.10,11 On the other hand, some researchers have found that exposure to high level shear stress caused oxidative stress on the endothelial cells and further induced cell apoptosis or necrosis.12–14 But those studies were performed under laminar shear stress with either constant or variable flow rates that are different from the real physiological conditions in the blood vessels, which experience pulsatile shear stress. Thus, it is necessary to introduce pulsatile shear stress into the model to reflect the fluctuating flow rate of the blood stream in the human body. Moreover, the combinational effect of the two factors: hyperglycemia and shear stress, which compose the microenvironment of endothelial cell growth on endothelial cells, is still not clear.
In our previous work, a hemodynamic lab-on-a-chip system was developed in which the flow rate of the culture medium in the microchannel was controlled by a pulsation free pump to mimic the flow profile in the blood vessel under different physiological conditions.15,16 The effects of various pulsatile shear stress profiles either alone or in combination with different glucose concentrations on endothelial cells were examined. However, it is focused only on ROS production and mitochondrial dysfunction of endothelial cells, with no further revealing of the consequence of these changes on inducing cell apoptosis.
Apoptosis can be detected by a number of standard assays including agarose gel analysis for detecting DNA fragmentation, TUNEL assay for detecting DNA damage, caspase activity assay, Western blot analysis for detecting the cleaved form of PARP and DNA staining for revealing chromatin condensation, etc.17–19 Most of these methods require a large number of cells for analysis and complicated experimental procedures. More importantly, they cannot be used to detect apoptosis in live cells.
Fluorescence-based DNA staining has been used to detect DNA fragmentation and chromatin condensation for indicating apoptosis in live cells. However, this method is usually used as an end point assay as prolonged incubation of the dye molecules with cells may cause DNA damage, which itself may cause cell death. In order to detect apoptosis in single living cells, we have developed a fluorescence resonance energy transfer (FRET)-based biosensor that could detect caspase activation in single HeLa cells during UV-irradiation induced apoptosis.20 We also generated a stable cell line of endothelial cells expressing this caspase sensor. With this FRET-based biosensor cell line, no post- or pre-fluorescence dye staining is needed, meanwhile, a real-time observation of cell apoptosis can be achieved.
In order to study hyperglycemia-induced endothelial cell dysfunction, this study proposes a highly controllable microfluidic chip system for detecting the cellular responses under different combinations of physiological pulsatile shear stresses and high glucose concentrations. Shear stress was directly imposed onto the endothelial cells' surface and a high concentration of glucose was added into culture medium to mimic the physical and chemical stresses applied to the cells, as shown in Fig. 1. The combination of these abnormal microenvironments may promote intracellular ROS generation, which can in turn overload the antioxidant defense system of the cells, leading to endothelial cell dysfunction through the caspase-3 activation pathway.21 A novel biosensing assay based on caspase-3 activity, which can detect apoptosis-activating compounds in a high throughput manner with a genetically engineered cell line, was integrated into the platform. The platform can achieve a real-time in vitro and convenient method for cell dysfunction detection.19
 | ||
| Fig. 1 Schematic illustration of bio-model of endothelial cells interacting with their physical and biochemical microenvironments. | ||
Materials and methods
Hemodynamic Lab-on-a-chip system
The hemodynamic microfluidic chip system is shown in Fig. 2(a). The microfluidic chip system consisted of four rows of microchannels; and each microchannel has three microchambers, which serve as the cell culture sites. Each microchamber has a width of 600 μm, a length of 3 cm and a height of 150 μm. The separated microchannels were connected by flexible connectors. The connection condition and sequence of the channels can be easily adjusted, which facilitates the conducting series operation of fluorescent dye staining and washing, and also allows experiments to be performed in parallel under different flow conditions. The microfluidic chip was fabricated with polydimethylsiloxane (PDMS) material by the standard soft lithography process.22,23 The PDMS slab was bonded to a glass slide by exposing to air plasma for 15 s using a handheld corona treater (BD-25, Electro-Technic Products). | ||
| Fig. 2 Design of microfluidic chip. Schematic illustration of (a) hemodynamic microfluidic chip system, and (b) experimental process to study endothelial cell death under different pulsatile shear stress conditions. | ||
A simple illustration of the experimental process by using a three-row microfluidic chip is shown in Fig. 2(b). First, endothelial cells were loaded into the microchip with all the three microchannels being connected in series. After the cells reached confluency, the culture rows were placed under different pulsatile flow conditions and the flow conditions of each row can be changed without affecting other rows. The flow condition was controlled by a pulsation free precision pump (Nemesys, Cetoni), with a flow profile mimicking the blood flow in the blood vessel. The pulsatile flow profiles have been characterized and verified by tracking the displacement of suspended 5-μm microbeads in the culture medium with a high-speed camera (Photron, FASTCAM SA3).17 Three flow profiles can be experimented on the endothelial cells simultaneously with three rows of microchannels, e.g., (1) a 12 h pulsatile shear stress condition of 15 dyne cm−2 (SS15) with a normal heart rate of 70 bpm, which represents a human in resting condition; (2) a 1 h pulsatile shear stress condition of 30 dyne cm−2 (SS30) with a heart rate of 140 bpm, which represents a human in exhaustive exercise condition, and subsequently 11 h SS15; and (3) 2 h of SS30 and subsequently 10 h SS15. Initially, row 1 was connected to the syringe, which exerted a shear stress profile of SS15. Rows 2 and 3 were interconnected to the syringe, which exerted a shear stress profile of SS30. After 1 h, row 2 was disconnected from row 3 and connected to row 1 for SS15. Similarly, after 2 h, row 3 was connected together with rows 1 and 2 for SS15. As a result, all three flow profiles can be easily realized in a single microfluidic chip system.
The number of microchannel rows can be increased when more complex and varying flow condition processes are needed. By using this microfluidic system, a single microfluidic chip can not only perform a series of experiments with different pulsatile flow conditions simultaneously, but also realize the parallel comparison among several cell culture chambers within one experimental condition.
Protocol for culturing endothelial cells
Two cell lines were used in the experiments. First, normal human umbilical vein endothelial cell line (HUVEC) CRL1730 was isolated from the umbilical vein. Low glucose (1.0 mg ml−1) DMEM (Sigma, USA) was mixed 1![[thin space (1/6-em)]](https://www.rsc.org/images/entities/char_2009.gif) :1 (v/v) with F-12 Ham nutrient mixture (Sigma, USA). The mixture was supplemented with 10% (v/v) fetal bovine serum (FBS, Gibco, USA) and 1% (v/v) penicillin/streptomycin (Gibco, USA) to form a complete growth medium. Second, human vascular endothelial cell caspase-3 (HUVEC-C3) cell line, which was transfected with the FRET biosensor C3, was generated from the normal HUVECs.19 HUVEC-C3 used the same growth medium with the normal cell, only with an additional 500 μg ml−1 geneticin (Gibco, USA) to maintain the stable cell line. All cells were cultured in a T-75 cell culture flask (NUNC, Denmark) in a 5% CO2 humidity incubator at 37 °C. When the cells reached confluency, the cells were trypsinized with 0.25% trypsin and 0.05% EDTA (Gibco, USA), and resuspended in the cell culture medium to obtain a concentration of approximately 1 × 10⁷ cells ml−1. The cell suspension was injected into the microchannels and the microfluidic chip was then incubated for 48 h until the confluent state was reached.
:1 (v/v) with F-12 Ham nutrient mixture (Sigma, USA). The mixture was supplemented with 10% (v/v) fetal bovine serum (FBS, Gibco, USA) and 1% (v/v) penicillin/streptomycin (Gibco, USA) to form a complete growth medium. Second, human vascular endothelial cell caspase-3 (HUVEC-C3) cell line, which was transfected with the FRET biosensor C3, was generated from the normal HUVECs.19 HUVEC-C3 used the same growth medium with the normal cell, only with an additional 500 μg ml−1 geneticin (Gibco, USA) to maintain the stable cell line. All cells were cultured in a T-75 cell culture flask (NUNC, Denmark) in a 5% CO2 humidity incubator at 37 °C. When the cells reached confluency, the cells were trypsinized with 0.25% trypsin and 0.05% EDTA (Gibco, USA), and resuspended in the cell culture medium to obtain a concentration of approximately 1 × 10⁷ cells ml−1. The cell suspension was injected into the microchannels and the microfluidic chip was then incubated for 48 h until the confluent state was reached.
In the experiments, 10 mM HEPES (Sigma, USA) was added into the culture medium to maintain the physiological pH value of the medium in the atmosphere environment. A heating platform was used to maintain the temperature of the microfluidic chip at 37 °C for long-term observation under the microscope.
Cell apoptosis and necrosis by yo pro-1 and propidium iodide
The endothelial cell apoptosis and necrosis were quantified by using fluorescent dyes yo pro-1 (Invitrogen, USA) and propidium iodide (PI) (Sigma, USA) as the first approach.21 Yo pro-1 stain has found a niche in identifying apoptotic cells because apoptotic cells are permeant to this dye, but remain impermeant to PI, which is widely used for staining the dead cells. For this double-labeling technique, 50 μM of yo pro-1, diluted in phosphate buffer and 10 μM of PI, was added in the culture medium. After treating the endothelial cells with different combinations of pulsatile flow profiles and glucose concentrations, the previous used culture medium was replaced with the medium containing these fluorescent dyes. Then, the microfluidic chip was incubated at 4 °C for 30 min in a dark environment and subsequently washed with PBS to remove excess fluorescent dyes in the medium. The fluorescent images were captured by using fluorescence microscopy at excitation wavelengths of 485 nm (λem = 530 nm) and 590 nm (λem = 630 nm) to detect apoptotic cells with yo pro-1 and necrotic cells with PI, respectively. To validate the double-labeling fluorescent technique, the HUVECs were treated with 100 μM etoposide (Sigma, USA), which is a well-known apoptotic inducer, as the positive control. For each treatment condition, 3 cell culture chambers were set as a parallel group. For each chamber, 10 observation sites containing at least 100 cells per site were counted (sample size of 1000 cells). Apoptotic or necrotic ratios were normalized by determining the ratio between the number of labeled cells and the total number of cells.Caspase-3 activation detection in living apoptotic cells via FRET biosensor C3
In order to realize a real-time detection of the HUVEC cells in the microfluidic chip, we have developed a HUVEC-C3 cell line transfected with the FRET biosensor C3.24,25 The biosensor C3 is a recombinant DNA that encodes a fusion protein containing the substrate for caspase-3. It consists of three parts: a donor cyan fluorescent protein (CFP), a 16 amino acid peptide linker containing the caspase-3 cleavage sequence Asp-Glu-Val-Asp (DEVD), and an acceptor yellow fluorescent protein (YFP) as shown in Fig. S1 (ESI†). When HUVEC-C3 cells are alive, the CFP is excited by using a 430-nm excitation light, and its fluorescent emission energy is transferred to the YFP in the cells, resulting in a green fluorescent emission with λem = 530 nm (Fig. S1(a), ESI†). When caspase-3 is activated as the cell undergoing apoptosis, the linker peptide between CFP and YFP is cleaved by the caspase-3, abolishing the FRET effect and resulting in a change of emission light from green to blue with λem = 480 nm (Fig. S1(b), ESI†).To measure the FRET effect, the microfluidic chip with HUVEC-C3 cells was excited by using a fluorescence microscope with a band-pass filter (430 ± 10 nm). The emission images of YFP (530 ± 10 nm) and CFP (480 ± 10 nm) were recorded by a computer-controlled cooled CCD camera (Diagnostic Instruments, Inc., USA). The fluorescent images of YFP and CFP were recorded separately and merged to produce the FRET image by using the ImagePro Plus software (Universal Imaging Co., PA). The green (YFP) color means that cells are alive and the blue (CFP) color means that cells are undergoing apoptosis. The level of apoptosis was quantified by measuring caspase activation using the emission ratio of YFP/CFP. This was achieved by measuring the fluorescent intensities of the cells from the digital images of YFP and CFP, respectively. High emission ratio of YFP/CFP indicates no or low caspase activation and low ratio of YFP/CFP indicates caspase activation. To validate the FRET sensing technique, the HUVEC-C3 cells were treated with typical apoptotic inducers: 500 nM Taxol (Sigma, USA) or exposed to UV-irradiation for 3 min. For each chamber, 10 observation sites containing at least 200 cells were counted (sample size of 2000 cells). The percentage of apoptotic cells was normalized by determining the ratio between the number of CFP cells and the total number of cells.
Apoptosis inhibition by antioxidants
An antioxidant is capable of inhibiting the oxidation of other molecules, which is a chemical reaction that transfers electrons or hydrogen from a substance to an oxidizing agent. Antioxidants were used in this study to test their protective effect on oxidative stress-induced cell apoptosis. The endothelial cells were pre-treated for 1 h with different kinds of antioxidants, including 100 μM butylated hydroxyanisole (BHA), 1 mM L-glutathione reduced (GSH), 20 μM propyl gallate (PG) and 1 mM N-acetylcysteine (NAC), respectively. After the pre-treatment, cells were further treated with different combinations of pulsatile flow profiles and glucose concentrations. Finally, the apoptotic rates were measured and quantified.Results and discussion
Measurement of cell apoptosis and necrosis by yo pro-1 and PI
The measurements of cell apoptosis and necrosis by using yo pro-1 and PI are shown in Fig. 3. With this double-labeling fluorescent method, apoptotic cells became permeant to yo pro-1 and emitted green fluoresce but remained impermeant to PI. Other dead cells were stained by PI and emitted red fluoresce, as shown in Fig. 3(a). The auto-fluorescence intensity of the double-labeling system in normal culture medium and high glucose medium was firstly measured as the background level. In this series of experiments under static flow conditions, a treatment with 100 μM etoposide for 4 h was used as the positive control of yo pro-1 fluorescent dye as it induces only HUVEC apoptosis without necrosis. Etoposide is a widely-used anti-cancer agent, which forms a ternary complex with DNA and the topoisomerase II enzyme, preventing re-ligation of the DNA strands. It causes errors in DNA synthesis and promotes apoptosis of cancer cells.26 Based on the statistical results as shown in Fig. 3(b), more than 50% of apoptotic cells, but a significantly low necrotic ratio (7–8%) for endothelial cells, were observed with the etoposide treatment. This shows the specificity of yo pro-1 to distinguish apoptotic from necrotic cells. In the experiments, endothelial cells were exposed to 5, 10 and 20 mM glucose, respectively, for 12 h and the apoptotic and necrotic ratios were measured. The results show that increasing glucose concentration caused more endothelial cells to die by both apoptosis and necrosis. It is known that high glucose concentration can generate oxidative stress in endothelial cells through several pathways and consequently induce them to apoptosis. In addition, imbalanced concentration of glucose between two sides of the cell membrane impairs the membrane function and induces cell necrosis.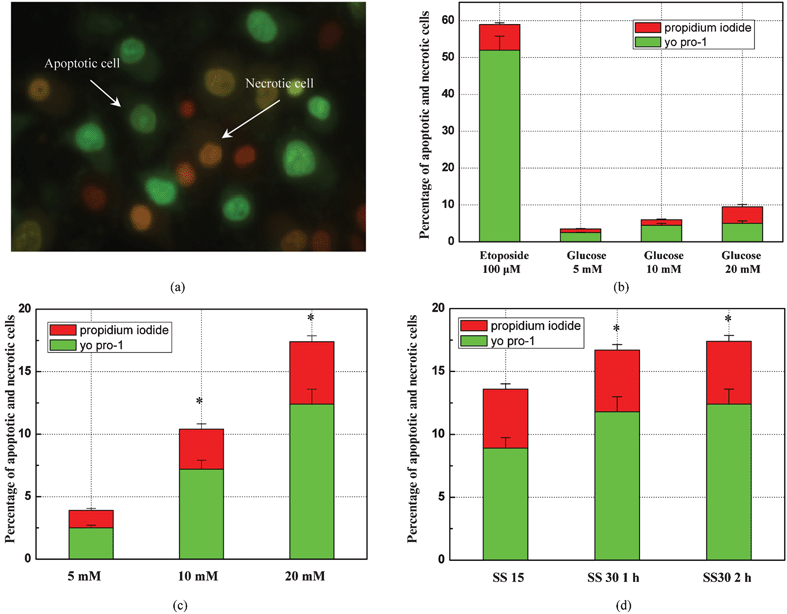 | ||
| Fig. 3 Measurement of cell apoptosis and necrosis by using yo pro-1 and propidium iodide. (a) Optical micrograph of apoptotic cells emitting green fluoresce and necrotic cells emitting red fluoresce; (b) statistical analysis of the rate of apoptosis and necrosis under different glucose concentrations for 12 h. Etoposide was used as the positive control to test the effect of double-labeling method; (c) statistical analysis of the rate of apoptosis and necrosis under different glucose concentrations with a flow profile of 2 h SS30 (30 dyne sec−2) and 10 h SS15 (15 dyne cm−2); and (d) statistical analysis of the rate of apoptosis and necrosis different flow profiles conditions with 20 mM glucose. Sample size: 1000 cells. | ||
By using the double-labeling fluorescent method, the apoptotic and necrotic states of HUVEC under different combinations of pulsatile shear stresses and glucose concentrations were investigated. First, the endothelial cells were exposed to 5, 10 and 20 mM glucose concentration under a flow profile of shear stress 30 dyne cm−2 for 2 h and a subsequent shear stress of 15 dyne cm−2 for 10 h. For diabetes patients, a glucose concentration in the blood of 10 mM is a common condition without any therapeutic treatment, while 20 mM is an extremely high level of glucose. Fig. 3(c) shows the statistical results of the effect of glucose concentration on endothelial cell apoptosis and necrosis with the presence of a pulsatile flow profile. With normal blood glucose levels (5 mM), the intensive pulsatile shear stress induced insignificant cell apoptosis (2.5%) and necrosis (1%) simultaneously. When the glucose concentration was increased to 10 mM, a near 3-fold death ratio was detected (7% for apoptosis and 3% for necrosis). Both apoptotic (12%) and necrotic (5%) rates were further elevated when the glucose concentration was increased to 20 mM. By comparing with the static condition in Fig. 3(b), it can be concluded that a high glucose concentration has a more apparent effect on triggering apoptosis and necrosis in HUVEC, especially under an exhaustive pulsatile flow profile.
To further investigate the impact of pulsatile shear stress on inducing cell death, the glucose concentration was maintained at a high level of 20 mM, while three different pulsatile flow profiles were tested: (1) a normal pulsatile flow condition of shear stress of 15 dyne cm−2 for 12 h was used to represent the shear force at the resting condition; (2) an exhaustive pulsatile flow condition of shear stress of 30 dyne cm−2 for 1 h followed by a normal shear stress of 15 dyne cm−2 for 11 h; and (3) an exhaustive pulsatile flow condition of shear stress of 30 dyne cm−2 for 2 h followed by a normal shear stress of 15 dyne cm−2 for 10 h. The statistical results in Fig. 3(d), show that under the high glucose concentration condition, the pulsatile shear stress of the normal physiological level (15 dyne cm−2) generated a 14% cell death rate, which is higher than the 10% death rate generated by the same high glucose in the static conditions (Fig. 3(b)). The death rates were further increased to 17.5% when a more exhaustive shear stress of 30 dyne cm−2 was applied to cells for 2 h. These results show that it is more accurate and realistic to expose the endothelial cells to pulsatile shear stress during the investigation of the endothelial cell response under different chemical conditions because it can better mimic the in vivo situation in the blood vessels. Thus, for diabetes patients with a high glucose concentration in the blood vessels, an exhaustive blood flow will induce a higher death rate for the endothelial cells, which will further damage the function of the blood vessels.
Measurement of cell apoptosis by caspase-3 activating sensor
Although the double-labeling fluorescent technique is effective in detecting the endothelial cell apoptosis and necrosis, there exist several disadvantages. First, the operation process is complicated, which requires several preparation and processing steps, including the step of keeping the microfluidic chip at 4 °C during the dye staining. This brings undesired factors and influences to the endothelial cells. Most importantly, it will not allow a real-time study of the cell apoptotic process. The effect of different time durations of various treatment conditions cannot be accurate due to these post-treatment steps.To evaluate the influence of the combination of different pulsatile shear stresses and glucose concentrations in real-time, HUVEC-C3 cells constitutively produce a caspase-3 sensor capable of detecting caspase activation in living endothelial cells was used. The HUVEC-C3 cells were induced to apoptosis by 3 min UV-irradiation or incubation with 500 nM Taxol. The UV-mediated apoptosis is a highly complex process in which different molecular pathways are involved, including DNA damage, activation of the tumor suppressor gene p53, triggering of cell death receptors either directly by UV or by autocrine release of death ligands, mitochondrial damage and cytochrome C release.27 The anti-cancer agent, Taxol, stabilizes microtubules leading to M phase cell cycle arrest and subsequently apoptotic cell death.28 The CFP image (colored blue) and the YFP image (colored green) of the same area of cells were merged together and displayed as shown in Fig. 4(a). Fig. 4(b) shows the increased apoptotic rate at 24 h after the treatment of UV-radiation and Taxol. UV-irradiation and Taxol are both well-known apoptotic inducers, which induced 24 and 9% cell apoptosis as measured by the sensor C3 cells. The statistical results show that the sensor C3 cells are reliable in detecting cell apoptosis. In addition, the exposure of 20 mM glucose for 24 h also induced a slight increase in cell apoptosis but this was not significant under the static flow condition.
 | ||
| Fig. 4 Detection of caspase-3 activation in living apoptotic cells based on FRET effect. (a) Merged FRET image of HUVEC-C3 with live cells appeared in green color and apoptotic cells in blue color; (b) statistical analysis of apoptotic rate after 24 h of 3 min UV-exposure, 500 nM of Taxol, and 20 mM of glucose treatments; and (c) statistical measurements of percentage of apoptotic cells using caspase-3 activation under different glucose concentrations and different flow profile conditions. Sample size: 1000 cells. | ||
Similar to the investigations for double-labeling technique, the FRET changes in response to the caspase-3 activation with three different glucose concentrations under three different exhaustive pulsatile flow profiles were investigated. The statistical results are shown in Fig. 4(c). First, the percentage of apoptotic cells under different glucose concentrations (5, 10 and 20 mM) with an exhaustive flow profile of 2 h, exhaustive pulsatile flow condition of shear stress 30 dyne cm−2, and 10 h normal pulsatile flow condition of shear stress of 15 dyne cm−2, were compared and analyzed. The YFP/CFP emission ratio, which indicated the caspase-3 activation in living apoptotic cells, apparently decreases with the elevation of glucose concentration (Fig. S2 in ESI†). To observe a more obvious FRET change, the final YFP/CFP emission ratio was detected 48 h after the treatment to provide more time for caspase activation. By increasing the glucose concentration from the normal physiological level of 5 to 10 mM, a nearly 2-fold increase of the apoptotic rate was observed (from 6.5 to 11%) under shear stresses of 2 h-SS30 and 10 h-SS 15 (Fig. 4(c)). Under the highest glucose concentration of 20 mM, about 12.5% of the endothelial cells underwent a caspase-3 related apoptotic cell death, which could significantly affect the maintenance of the normal blood vessel function.29 Secondly, the apoptotic rate of endothelial cells under the same glucose concentrations of 20 mM with different pulsatile flow profiles were compared and analyzed. The FRET images are illustrated in Fig. S3 in ESI†. It can be seen that cell apoptosis via the caspase-3 pathway is minimal under a normal pulsatile condition of shear stress of 15 dyne cm−2 for 12 h. When a longer period of the exhaustive pulsatile shear stress of 30 dyne cm−2 was applied to the cells in the presence of 20 mM glucose, the measured apoptotic rate was significantly increased from 4 to 12.5% (Fig. 4(c)). Adding 1 h of exhaustive pulsatile shear stress nearly doubled the apoptotic rates of the endothelial cells in all three glucose concentrations (Fig. 4(c)). These results show the potentially damaging effect of excessive mechanical force to endothelial cells, especially in combination with high concentration of glucose at 20 mM. For diabetes patients with a high glucose concentration in the blood vessels, it is quite dangerous to have an exhaustive blood flow lasting a long time, which will induce a high rate of apoptosis of the endothelial cells. When the exhaustive blood flow time becomes longer, it is more dangerous to diabetes patients. Two hours exhaustive blood flow under high glucose concentration may induce quite serious damage to the blood vessels.
Comparison between two apoptosis detection methods
To compare the two cell death detection methods and obtain a deeper understanding of the pulsatile shear stress and the high glucose concentration effect, a comparison of the time-dependent responses of the ROS level, mitochondrial damage, caspase-3 activation and cell apoptotic rate under the same conditions of 20 mM glucose concentration and 15 dyne cm−2 shear stress were compared as shown in Fig. 5. The occurrence of these primary corresponding changes was in sequence. When the endothelial cells were exposed to the pulsatile shear stress and high glucose concentration, the ROS level increased immediately within 30 min (from 20 to 90%) and reached a peak in 60 min (100%). Then, prolonged treatment further induced mitochondrial damage, which manifested as a morphological change to mitochondrial fission within 4 h (from 2 to 25%).16 When the high glucose concentration and pulsatile shear stress microenvironment still existed until the cells lost their own self-repairing function, the endothelial cells underwent the apoptotic pathway. The yo pro-1 and PI double-labeling fluorescent technique can detect all apoptotic and necrotic types. On the other hand, the biosensor C3 probe method can detect caspase-3 dependent apoptosis more precisely in real-time. Since caspase-3 activation is the main pathway of the pulsatile shear stress and high glucose concentration-induced cell death, the two measurements are comparable as shown in Fig. 5(c). The pulsatile shear stress condition-dependent cell measured by the sensor C3 probe is more accurate due to its real-time observation as well as avoiding other disturbing possibilities. In addition, it was observed that the time-dependent increment trend and sequence are consistent among the ROS level, the mitochondrial damage rate and the cell apoptotic rate. | ||
| Fig. 5 Time-dependent responses of (a) ROS level, (b) mitochondrial damage and (c) caspase-3 activation and cell apoptotic rate were measured by yo pro-1 with a glucose concentration of 20 mM and different flow conditions. | ||
Inhibition of the apoptotic effect viaantioxidants
To determine the importance of the ROS production and the oxidative stress to the endothelial dysfunction, the effects of four antioxidants were examined, i.e., 100 μM butylated hydroxyanisole (BHA), 1 mM L-glutathione reduced (GSH), 20 μM propyl gallate (PG) and 1 mM N-acetylcysteine (NAC). In the experiments, the endothelial cells were pre-treated with each of the antioxidants for 1 h and subsequently, were exposed to an exhaustive pulsatile shear stress of 30 dyne cm−2 for 2 h followed by a normal shear stress of 15 dyne cm−2 for 10 h (Fig. S4 in ESI†). To evaluate the effect of these anti-oxidants, the YFP/CFP emission ratio was detected immediately after the treatment. The apoptotic rate was significantly reduced by PG but not the other three antioxidants. PG can prevent Bax translocation to mitochondria and cytochrome c release, which are the two up-stream events of caspase-3 dependent cell apoptosis.30Conclusions
In this paper, a novel endothelial cell apoptosis detection method, which combines a caspase-3-based FRET biosensor cell line and the microfluidic chip system, was developed. The apoptosis and necrosis of endothelial cells undergo a series of different pulsatile flow conditions and glucose concentrations can be detected with high accuracy since the FRET biosensor provides real-time observation and does not need post-treatment.A double-labelling fluorescent technique (yo pro-1 and propidium iodide) was used to validate the results. The results measured by yo pro-1 and PI show that high glucose concentration could significantly increase endothelial death, which was further increased by including the effect of the pulsatile shear stress. Using the endothelial cell line transfected with the FRET biosensor C3, a more accurate cell apoptotic percentage can be obtained with direct observation of fluorescence emission changes. The activation of the biosensor also confirms the endothelial cell apoptosis induced by the elevated pulsatile shear stress and high glucose concentration is through the caspase-3 pathway. This information can form the basis for determining how hyperglycemia as the major risk factor causes endothelial dysfunction under a physiological pulsatile blood flow condition, which leads to cardiovascular diseases and other complications associated with diabetes.
Acknowledgements
This work is supported by the Environmental and Water Industry Development Council of Singapore (Rresearch project Grant No. 1102-IRIS-05-02) and the AcRF Tier 1 grant from the Minister of Education of Singapore (Research project Grant No. M4010891.120, RG45/09).References
- P. Vallance, A. Calver and J. Collier, J. Hypertens., 1992, 10, 25 CrossRef.
- A. A. Quyyumi, Am. J. Med., 1998, 105, 32 CrossRef.
- J. Calles-Escandon and M. Cipolla, Endocr. Rev., 2001, 22, 36 CrossRef CAS.
- I. A. M. van den Oever, H. G. Raterman, M. T. Nurmohamed and S. Simsek, Mediators Inflamm., 2010, 1, 792393 Search PubMed.
- Y. Takamura, T. Tomomatsu, E. Kubo, S. Tsuzuki and Y. Akagi, Invest. Ophthalmol. Visual Sci., 2008, 49, 3216 Search PubMed.
- M. L. Sheu, C. K. Chiang, K. S. Tsai, F. M. Ho, T. I. Weng, H. Y. Wu and S. H. Liu, Free Radical Biol. Med., 2008, 44, 2043 CrossRef CAS.
- N. Das Evcimen and G. L. King, Pharmacol. Res., 2007, 55, 4987 Search PubMed.
- L. Quagliaro, L. Piconi, R. Assaloni, L. Martinelli, E. Motz and A. Ceriello, Diabetes, 2003, 52, 2795 CrossRef CAS.
- S. Srinivasan, M. E. Hatley, D. T. Bolick, L. A. Palmer, D. Edelstein, M. Brownlee and C. C. Hedrick, Diabetologia, 2004, 47, 1727 CrossRef CAS.
- N. Resnick, H. Yahav, A. Shay-Salit, M. Shushy, S. Schubert, L. C. M. Zilberman and E. Wofovitz, Prog. Biophys. Mol. Biol., 2003, 81, 177 CrossRef.
- O. Tricot, Z. Mallat, C. Heymes, J. Belmin, G. Leseche and A. Tedgui, Circulation, 2000, 101, 2450 CrossRef CAS.
- D. van Noort, S. M. Ong, C. Zhang, S. F. Zhang, T. Arooz1 and H. Yu, Biotechnol. Prog., 2009, 25, 52 CrossRef CAS.
- X. Bai, X. Wang and Q. Xu, Vasc. Pharmacol., 2001, 52, 224 CrossRef.
- H. J. Hsieh, C. C. Cheng, S. T. Wu, J. J. Chiu, B. S. Wung and D. L. Wang, J. Cell. Physiol., 1998, 175, 156 CrossRef CAS.
- L. K. Chin, J. Q. Yu, Y. Fu, T. Yu, A. Q. Liu and K. Q. Luo, Lab Chip, 2001, 11, 1856 RSC.
- X. C. Li, J. Wu, A. Q. Liu, Z. G. Li, Y. C. Soew, H. J. Huang, K. Xu and J. T. Lin, Appl. Phys. Lett, 2008, 93, 19390 Search PubMed.
- R. Sgonc and J. Gruber, Exp. Gerontol., 1998, 33, 525 CrossRef CAS.
- S. Elmore, Toxicol. Pathol., 2007, 35, 495 CrossRef CAS.
- E. Plantin-Carrenard, A. Bringuier, C. Derappe, J. Pichon, R. Guillot, M. Bernard, M. J. Foglietti, G. Feldmann, M. Aubery and F. Braut-Boucher, Cell Biol. Toxicol., 2003, 19, 1211 CrossRef.
- X. M. Zhu, A. F. Fu and K. Q. Luo, Biochem. Biophys. Res. Commun., 2012, 418, 641 CrossRef CAS.
- L. Cai, W. Li and G. W. Wang, Diabetes, 2002, 51, 1938 CrossRef CAS.
- J. Q. Yu, Y. Yang, A. Q. Liu, L. K. Chin and X. M. Zhang, Opt. Lett., 2010, 35, 1890 CrossRef CAS.
- Y. Sun, C. S. Lim, A. Q. Liu, T. C. Ayi and P. H. Yap, Sens. Actuators, A, 2007, 133, 340 CrossRef CAS.
- K. Q. Luo, V. C. Yu, Y. M. Puand and D. C. Chang, Biochem. Biophys. Res. Commun., 2001, 283, 1054 CrossRef CAS.
- W. Dai, Y. Z. Zheng, K. Q. Luo and W. Hongka, Biomicrofluidics, 2010, 4, 024101 CrossRef.
- M. Gordaliza, P. A. Garcia, J. M. M. del Corral, M. A. Castro and M. A. Gomez-Zurita, Toxicon, 2004, 44, 441 CrossRef CAS.
- D. Kulms and T. Schwarz, Photodermatol., Photoimmunol. Photomed., 2000, 16, 195 CAS.
- S. S. Bacus, A. V. Gudkov, M. Lowe, L. Lyass, Y. Yung, A. P. Komarov, K. Keyomarsi, Y. Yarden and R. Seger, Oncogene, 2001, 20, 147 CrossRef CAS.
- R. K. Jain, N. Safabakhsh, A. Sckell, Y. Chen, P. Jiang, L. Benjamin, F. Yuan and E. Keshet, Proc. Natl. Acad. Sci. U. S. A., 1998, 95, 10820 CrossRef CAS.
- H. L. Tian, T. Yu, N. N. Xu, C. Feng, L. Y. Zhou, H. W. Luo, D. C. Chang and K. Q. Luo, Cancer Lett., 2010, 297, 18 CrossRef CAS.
Footnote |
| † Electronic supplementary information (ESI) available. See DOI: 10.1039/c3lc50105a |
| This journal is © The Royal Society of Chemistry 2013 |