 Open Access Article
 This Open Access Article is licensed under a
 Creative Commons Attribution 3.0 Unported Licence
Microfluidic oxygen imaging using integrated optical sensor layers and a color camera
Birgit
Ungerböck†
a,
Verena
Charwat†
b,
Peter
Ertl
b and
Torsten
Mayr
*a
aApplied Sensors, Institute of Analytical Chemistry and Food Chemistry, Graz University of Technology, Stremayrgasse 9/3, 8010 Graz, Austria. E-mail: torsten.mayr@tugraz.at; Fax: +43 (0) 316 873 32502; Tel: +43 (0) 316 873 32504
bBioSensor Technologies, AIT Austrian Institute of Technology GmbH, Muthgasse 11/2, 1190 Vienna, Austria. E-mail: peter.ertl@ait.ac.at; Fax: +43(0) 50550 4450; Tel: +43(0) 50550 4469
First published on 18th January 2013
Abstract
In this work we present a high resolution oxygen imaging approach, which can be used to study 2D oxygen distribution inside microfluidic environments. The presented setup comprises a fabrication process of microfluidic chips with integrated luminescent sensing films combined with referenced oxygen imaging applying a color CCD-camera. Enhancement of the sensor performance was achieved by applying the principle of light harvesting. This principle enabled ratiometric imaging employing the red and the green channel of a color CCD-camera. The oxygen sensitive emission of platinum(II)-5,10,15,20-tetrakis-(2,3,4,5,6-pentafluorphenyl)-porphyrin (PtTFPP) was detected by the red channel, while the emission of a reference dye was detected by the green channel. This measurement setup allowed for accurate real-time 2D oxygen imaging with superior quality compared to intensity imaging. The sensor films were subsequently used to measure the respiratory activity of human cell cultures (HeLa carcinoma cells and normal human dermal fibroblasts) in a microfluidic system. The sensor setup is well suited for different applications from spatially and temporally resolving oxygen concentration inside microfluidic channels to parallelization of oxygen measurements and paves the way to novel cell based assays, e.g. in tissue engineering, tumor biology and hypoxia reperfusion phenomena.
Introduction
Oxygen concentration is an immensely important factor in cellular studies.1 Important physiological processes and cell culture applications where the O2 supply plays a prime role include tumor biology and vascularization, hypoxia-reperfusion phenomena, tissue engineering and stem cell differentiation.2,3 Oxygen is fundamental in cellular activities, because it is required for aerobic metabolism of carbon compounds, a very basic cellular function. A lack of oxygen therefore has a huge impact on cell behavior including alterations of the cellular metabolism,4 physiological pathways,5 tissue remodeling and growth of new capillaries, increased tumor resistance to therapy6 as well as necrotic cell death. An excess of oxygen on the other hand can damage cells because of oxidative stress.Because of the high importance of oxygen for cell cultivation, different approaches to defining and controlling oxygen concentration in bulk applications are commercially available, such as incubators with O2 control (in addition to CO2), cell culture flasks with integrated O2 sensors or motorized sensor tips.7 These devices provide single spot measurements and do not consider oxygen gradients within a culture vessel. However, many biological questions require information about oxygen distribution rather than a single averaged value: tumor biology is one well known example of the importance of spatially varying oxygen concentration. Many studies have been conducted to investigate the effects of oxygen gradients in solid tumors.8–10 Oxygen supply becomes a limiting factor and eventually leads to the necrosis of cells in the inner tumor mass while at the same time promoting tumor vascularization for tissue thicknesses greater than 100 μm.11 To investigate such phenomena, assay formats that aim at the creation of a biological niche have been developed. For example co-culture models, 3D tissue analogues or micro-patterned and microfluidic devices have been established to provide physiologically relevant environments. In these assay formats culture conditions are varying over the entire area or volume. Thus it is of prime importance to obtain spatially resolved information on concentration gradients and distribution of parameters of interest such as temperature, cytokines or dissolved gases including oxygen. Literature examples of suitable devices to study oxygen gradients include oxygen sensitive scaffolds,12 microparticles13 or sensor foils14 for tissue cross sections.
In the case of microfluidic devices a variety of integrated optical oxygen sensors for cell analysis have been developed.15 Some of the publications report on point measurements,16,17 while others present 2D read out systems.18–23 While the former measurements assume average cultivation conditions over the entire sensor area, 2D measurements allow for a more detailed look at oxygen levels and gradients inside microbioreactors.20–23 All methods apply oxygen sensitive luminescent dyes based on the well-known collisional luminescence quenching sensing scheme. These dyes exhibit high luminescence intensity (I) and luminescence lifetime (τ) under oxygen-free conditions, while the presence of oxygen molecules leads to a decrease of I and τ. This decrease is a result of energy transfer from the energetically excited dye to the oxygen, which is transferred into its excited singlet state, while the excited oxygen indicator returns to its ground state by radiation-free deactivation.
Luminescence-based imaging applications have been realized in different formats using for example dissolved oxygen sensitive luminescent dyes,19,24 sensor beads13,20 or sensor layers.14,18,21–23,25 Also different read out methods have been developed and applied in microfluidic imaging setups. Intensity imaging18,21–23,26 for example can be easily implemented in laboratories working with fluorescence microscopy equipment. This method, however, has the disadvantage of unwanted signal variations due to defects in the optical system such as inhomogeneities of the light source, inhomogeneous sensitivity of the detection system or inhomogeneous distribution of the fluorescent probes in the sensing matrix. These issues limit the accuracy of the obtained oxygen images. Fluorescence life-time imaging (FLIM)20,27 on the other hand gives highly accurate results, but requires expensive and specialized instrumentation that is not commonly available in cell biology laboratories and consequently limits its applications.
In the present work we therefore implemented two-wavelength ratiometric imaging28–32 to combine low-cost and easily available imaging equipment with high resolution imaging. A color CCD camera measures the intensity at two different wavelengths of the sensor's emitted light by using the different color channels of the camera – one channel providing the oxygen sensitive intensity image, the other one providing a so called reference image. Through calculation of the ratio between these images (red image/green image) the obtained ratiometric image is independent of the previously listed inhomogeneities.
The sensor setup was used to combine ratiometric 2D oxygen imaging and microfluidic cell culturing. The microfluidic system with integrated sensor layers is simple to fabricate. The technology can be used in laboratories working with microfluidic cell cultures to better control and optimize cultivation conditions. This opens the way for novel microfluidic cell based assays in many fields of tissue engineering, tumor biology and hypoxia reperfusion phenomena.
Methods
Materials
Platinum(II)-5,10,15,20-tetrakis-(2,3,4,5,6-pentafluorphenyl)-porphyrin (PtTFPP) was purchased from Frontier Scientific (www.frontiersci.com); polystyrene (PS; M = 250![[thin space (1/6-em)]](https://www.rsc.org/images/entities/char_2009.gif) 000) was obtained from Fisher Scientific (www.fishersci.com); Macrolex Fluorescent Yellow (MFY) was bought from Simon and Werner GmbH (www.simon-und-werner.de); all the solvents and α-D-glucose monohydrate were obtained from Roth (www.carl-roth.de); glucose oxidase from Aspergillus niger (211 U/mg) was purchased from Sigma Aldrich (www.sigmaaldrich.com). Polydimethylsiloxan soft polymer Sylgard 184 (PDMS) was purchased from Dow Corning Germany (www.dowcorning.com); SU-8 2050 negative photoresist was purchased from MicroChem Corp. (www.microchem.com).
000) was obtained from Fisher Scientific (www.fishersci.com); Macrolex Fluorescent Yellow (MFY) was bought from Simon and Werner GmbH (www.simon-und-werner.de); all the solvents and α-D-glucose monohydrate were obtained from Roth (www.carl-roth.de); glucose oxidase from Aspergillus niger (211 U/mg) was purchased from Sigma Aldrich (www.sigmaaldrich.com). Polydimethylsiloxan soft polymer Sylgard 184 (PDMS) was purchased from Dow Corning Germany (www.dowcorning.com); SU-8 2050 negative photoresist was purchased from MicroChem Corp. (www.microchem.com).
Preparation of sensor films
1, 2, or 4 mg PtTFPP, 4 mg MFY, and 200 mg of PS were dissolved in 4.00 g of chloroform to obtain the sensor “cocktails” for optimization experiments of the sensor films. 200 μL of these cocktails were knife-coated onto dust-free microscope slides (www.carl-roth.de) by using a bar film applicator (1 mil, www.byk.com) and the solvent was allowed to evaporate under ambient air to result in a ∼2.5 μm sensor film. Sensor cocktails for optimized sensor films in microfluidic chips contained 4 mg MFY, 2 mg PtTFPP and 200 mg of PS dissolved in 4.00 g of chloroform.Spectral measurements
Emission spectra were acquired on a Hitachi F-7000 fluorescence spectrometer (www.inula.at) equipped with a red-sensitive photomultiplier tube (PMT) R 928 from Hamamatsu (www.hamamatsu.com). The emission spectra were corrected for the sensitivity of the PMT.Integration of sensor films into microfluidic chips
The microfluidic channels were fabricated from PDMS. First, an SU-8 mold featuring the negatives of two 3 mm wide and 50 μm high channels was prepared on a silicon wafer by standard lithography processes. Then liquid PDMS (mixed 1:10 with curing agent) was poured on the structures to cast a 1.5 mm thick PDMS sheet featuring the microchannels. After thermal curing at 60 °C for 4 h, a section of solidified PDMS layer, 2.0 × 2.5 cm2, was cut and peeled from the mold. Three holes (3 mm diameter) were punched into each of the channels to form cell cultivation chambers with low shear force. A 1 mm thick glass cover with holes drilled for fluidic connection was permanently bonded on top of the microfluidic layer using oxygen plasma surface activation (femto plasma cleaner, diener electronic: 40% power, 0.5 min, 45 °C, 0.8 mbar). Then the fluidic layer was assembled with the sensor layer: 2.5 × 2.5 cm2 glass substrates with sensor films were spin-coated (5 min at 2500 rpm) with a thin (10 μm) PDMS film in order to protect the sensor layer (prevention of scratches or delamination) and to promote adhesion of the fluidic layer. The fluidic layer was placed on the sensor layer and then the PDMS film was cured and served as glue. Finally, a piece of tygon tubing (length 1 cm, inner tubing diameter 0.51 mm, SC0029, Ismatec) was glued to the glass cover to create the fluidic interface. Fig. 1 shows a schematic cross section and a photograph of the microfluidic chip with integrated oxygen sensor layer.
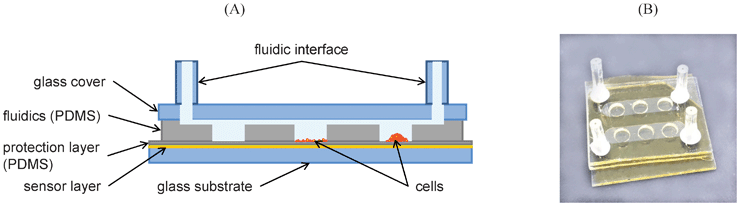 | ||
| Fig. 1 Microfluidic oxygen sensor chip. A) Schematic cross section of the chip assembly showing components of the sensor and fluidic layer (not to scale). The 3 cultivation wells illustrate a cell-free control chamber, a cell monolayer on fibronectin coated PDMS and a cell aggregate on uncoated PDMS. B) Photo of the actual cell–chip device with 2 individually addressable microfluidic channels and three O2-sensitive cell cultivation chambers on each side. | ||
In order to promote cell attachment the channels were activated by 1 min plasma exposure and then coated with 1 μg mL−1 fibronectin (F4759, Sigma-Aldrich) right before use. For operation the chip was mounted on a 37 °C heated microscope stage and connected to a syringe pump (KD Scientific) to rinse the system with fresh (air saturated) medium.
Sensor characterization
Full calibration of the sensor films was performed inside the microfluidic chip by flushing it with gaseous air–nitrogen mixtures. The ratio R of red and green channel was determined for deaerated (R0) and fully air-saturated (Rair) conditions in water at 37 °C. Full calibration of each chip was then obtained by adapting the gaseous calibration data to R0/Rair obtained from their determination in water. Deaerated water was obtained by deoxygenation reaction of glucose (10 mg mL−1) with oxygen in the presence of glucose oxidase (0.05 mg mL−1).Cell culture
Two different cell types (a cancer cell line and a normal (non-immortalized) cell strain) that are widely used for cell-based assays were selected to demonstrate the performance of the newly developed oxygen sensitive cell culture device. HeLa carcinoma cells were cultivated in RPMI-1640 medium (R 00883, Sigma-Aldrich) supplemented with 10% FCS and 4 mM L-glutamine (M11-004, PAA) and normal human dermal fibroblasts (NHDF, PromoCell C-12300) were cultivated in DMEM high glucose medium with stable glutamine (PAA, E15-883) supplemented with 10% fetal calf serum (FCS) from PAA (A15-101). For cell loading of the sensor chip, cells were first enzymatically removed from the culture flask using 0.25% trypsin EDTA (Fisher Scientific) and suspended in fresh medium. The cell suspension was then injected into the chip through the fluidic interface using 1 ml syringes or pipette tips. Cells gravimetrically separated from the slowly flowing medium and accumulated in the cultivation chambers. Fresh cell suspension was added until the desired cell coverage of the chambers was achieved. Then the medium flow was stopped and depending on the experiment cells were allowed to either form a monolayer (on fibronectin coated PDMS) or aggregate to cell clusters (on untreated PDMS). Monolayers consisted of about 50000 (NHDF) to 150000 (HeLa) cells cm−2 or ca. 3500 (NHDF) to 10000 (HeLa) cells/well. Cell clusters consisted of similar total cell numbers, but cells aggregated to 5 to 8 layers resulting in about 100 μm thickness (75 to 150 μm). During experimentation a medium flow of 10 μL min−1 was applied to provide the cells with oxygenated medium and flow was stopped to monitor respiratory cell activity.
Imaging setup and data evaluation
Microscopic oxygen imaging was performed using a Hund Wilovert AFL 40 Phako inverse microscope equipped with a hot stage to regulate the temperature of the microfluidic chips. A HBO 100 (100-watt high-pressure mercury plasma arc-discharge lamp) was used as excitation source. All these components, a Zeiss objective A-Plan 10×/0.25 Ph1 and the FITC filter set consisting of an excitation filter (450–490 nm), a dichroic mirror (510 nm) and a long-pass emission filter (520 nm) were purchased from Werner Jülich (www.juelich-bonn.com).For image acquisition an Olympus XC10 color camera was connected to the microscope via a c-mount 0.5× adapter. The camera uses the Sony ICX 285 AQ image sensor with relative sensitivities of the color channels shown in Fig. 2. This image sensor is commonly used in different camera types (as Leica, Olympus, Allied Vision Technologies, etc.). Image acquisition was performed with the software Olympus CellˆD (www.olympus-europa.com).
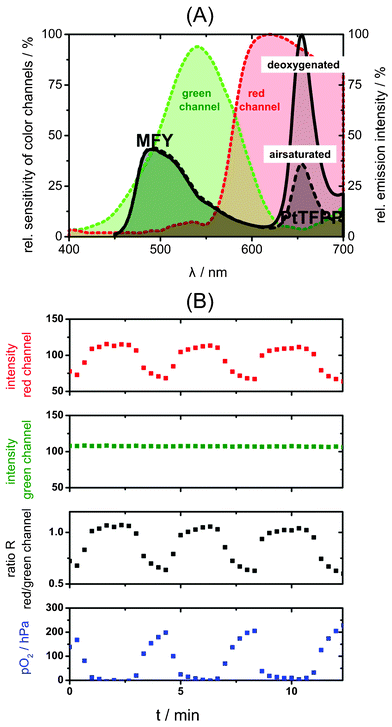 | ||
| Fig. 2 (A) Emission spectra of the two-wavelength ratiometric oxygen sensor under air saturated and deoxygenated conditions and relative sensitivities of the color channels of the color camera; the red channel detects the oxygen sensitive emission of PtTFPP while the green emission of MFY acts as green reference channel. (B) Response curve of a microfluidic chip with integrated sensor film read out by a CCD color camera; from the intensities of red and green images the referenced ratiometric images were calculated, which were then transformed into pO2 images. The curves show data averaged over a region of interest (0.045 mm2) of the channel area. | ||
Macroscopic oxygen imaging was performed using a 458 nm high-power 10 W LED array (www.led-tech.de) as excitation source. The filter set consisting of the excitation filter BG12 (350–470 nm) and the long-pass emission filter OG515 (515 nm) was purchased from Schott (www.schott.com). An AVT Marlin F-201C color camera equipped with a Xenoplan 1.4/23 objective lens (http://www.schneiderkreuznach.com) was used for image acquisition. The camera also uses the Sony ICX 285 AQ image sensor. Image acquisition was performed with the software AVT SmartView (http://www.alliedvisiontec.com).
Matlab R2008a (www.mathworks.com) was used for image processing. The color channels of the obtained images were separated and the ratiometric image R was obtained by dividing the red by the green channel. pO2 images were calculated using the adapted calibration data. Fitting was performed using OriginLab 8.6 (www.originlab.com).
Results and discussion
Chip assembly
The microfluidic oxygen sensor chips consist of a glass substrate, a sensor layer with a protection film, the fluidic part made from PDMS and a glass cover as can be seen in Fig. 1. One important aspect of our chip design was protection of the oxygen sensor to increase mechanical stability. While the dry sensor layer shows good adhesion to the glass substrate, it can peel off more easily in a liquid environment. If tiny scratches or other small defects are present in the sensor layer, liquid films can form under the polystyrene and lift it from the glass substrate. In order to protect the sensor layer, we spin coated it with a thin (10 μm) PDMS layer. Due to the high gas permeability of PDMS, oxygen diffusion from the cell chambers to the sensor took only ∼10 s, which is fast enough for most biological applications. Additionally, the thin PDMS coating served as glue for the fluidic layer. This is a convenient way of assembly for PDMS (microfluidics) and polystyrene (sensor layer), which are otherwise difficult to bond permanently. In order to limit oxygen diffusion into the system the whole fluidic device was covered with a glass slide (see Fig. 1). The glass cover (and glass substrate) restricted oxygen access through the thick channel side walls (ca. 5 mm). Sensor devices fabricated in the described manner showed long usability without loss of performance.It is important to note that our oxygen sensor layer is integrated in the bottom of the cell cultivation device sensing the oxygen concentration almost directly underneath the cell layer. This is a big advantage compared to other sensing methods where oxygen sensitive probes are placed in the medium surrounding the cells. In the presented device distance of the sensing layer to the cells is well defined and reproducible. Furthermore the minimal distance and location underneath the cells ensures that we measure the concentration of oxygen that the cells are really surrounded by instead of less relevant information on oxygen in the bulk medium.
Sensor assembly
Demands for the sensor chemistry were:
a) oxygen sensitive emission in one color channel and a reference emission in another channel of the camera
b) excitation at one wavelength
c) avoidance of UV light, because UV light can lead to background luminescence from media or cell material. It is also known for having a negative impact on cell growth and viability.
To solve the need for matching two different color channels by using one excitation wavelength and to overcome the use of UV light, the principle of FRET33 was chosen and applied as a so-called light harvesting system.34 MFY, the antenna dye of the system, with its excitation and emission maxima at λmax, EX = 450 nm and λmax, EM = 490 nm, collects blue light and transfers a part of its energy to the Q-bands of the oxygen sensitive indicator dye PtTFPP with its emission maximum at λmax = 650 nm.
The use of the light harvesting system allows the usage of the two-wavelength referencing method and sensor signals can be read out by a color CCD camera. Fig. 2(A) shows the working principle of the presented sensor setup. The oxygen sensitive emission of PtTFPP is detected by the red channel of the Sony ICX 285 AQ CCD-chip (frequently used in color CCD cameras for fluorescence microscopy), while the reference emission of MFY matches the green reference channel. Temporal and/or spatial inhomogeneities of the light source, inhomogeneous sensitivity of the detection system or concentration gradients of the luminescent probes influence the emission of both dyes equally, while changes in oxygen concentration alter only PtTFPP emission. Therefore, the ratio of the two channels depends only on the pO2, while it is robust against common drawbacks of intensity imaging such as inhomogeneities in the sensor layer. Further advantages of the light harvesting system are increased signal intensity, decreased risk of background luminescence and an extended Stokes Shift, which leads to a better separability of excitation and emission light.
To form sensor layers both dyes were dissolved in PS, a sensor polymer matrix, which provides good oxygen permeability, bio-compatibility and low auto fluorescence. PS sensor cocktails were applied onto microscope slides by blade coating. This method led to sensor layers with sufficient homogeneity to perform ratiometric imaging. In general, spin coating is also possible and results in homogeneous layers. However, we preferred blade coating, because less sensor material is wasted during the coating process compared to spin coating.
Fig. 2(B) shows the response curve of an integrated sensor film inside a microfluidic chip, which was flushed alternately with air-saturated and deaerated water, recorded with ratiometric imaging. The oxygen sensitive signal is detected in the red channel, while the intensity of the green channel remains stable. From these intensities the referenced ratiometric image R was calculated, which was then transformed into the pO2 image. The curves show data averaged over a region of interest of the channel area.
R can easily be changed by changing the concentration of one of the used dyes of the light harvesting system. Our studies showed that the dye ratio also affects the parameter R0/Rair, which determines the sensitivity of oxygen sensors (see chapter on sensor calibration). This is due to spectral overlapping of the color channels. When the signal intensity of the green channel is too high, the reference signal is also detected in the red channel, which contributes to the oxygen sensitive red channel as background signal. This lowers R0/Rair and thus the sensitivity of the sensor calibration.
Optimization concerning the ratio R and R0/Rair was performed by changing the concentration of the oxygen indicator PtTFPP. A change of the concentration of the antenna dye MFY was not studied as the principle of light harvesting is to use the antenna dye in excess.34Table 1 compares the results of the optimization. The sensor films with 2% (w/w) MFY and 1% (w/w) PtTFPP showed the best performance with a ratio between 0.62 (H2Oair) and 1.56 (H2Odeox). The ratio R0/Rair of this combination is 2.50. Higher concentration of PtTFPP led to a higher value for R0/Rair (see Table 1), which would be worth pursuing in terms of the sensor's sensitivity, but was unsuitable in terms of the ratio R (Rair = 1.16, R0 = 4.41). Moreover, these sensor films showed inhomogeneous ratiometric images, which can be traced back to the fact that high dye concentration leads to inhomogeneously dissolved dyes in the sensor matrix.
| PtTFPP [%(w/w)] | R air | R 0 | R 0/Rair |
|---|---|---|---|
| 0.5 | 0.42 ± 0.04 | 0.77 ± 0.01 | 1.84 ± 0.20 |
| 1 | 0.62 ± 0.01 | 1.56 ± 0.05 | 2.50 ± 0.08 |
| 2 | 1.16 ± 0.05 | 4.41 ± 0.08 | 3.80 ± 0.19 |
Characterization of sensor films
Fig. 3 compares an intensity image with a ratiometric image obtained by division of the red by the green channel. Looking at the intensity response shown in Fig. 3(A) it is obvious that the pure intensity image cannot be calibrated by using only one calibration function, but requires the use of multiple calibration functions (one per pixel). While this is possible for one position of the microfluidic chip, the use of multiple calibration functions is very cumbersome and inefficient when the chip is moved to another position. In the case of referenced ratiometric imaging (Fig. 3(B)) a single calibration function is sufficient to adequately describe the whole sensing area of one chip. Thereby the ratiometric imaging approach enables considerably easier handling of oxygen imaging inside microfluidics and offers the possibility for high accuracy imaging.
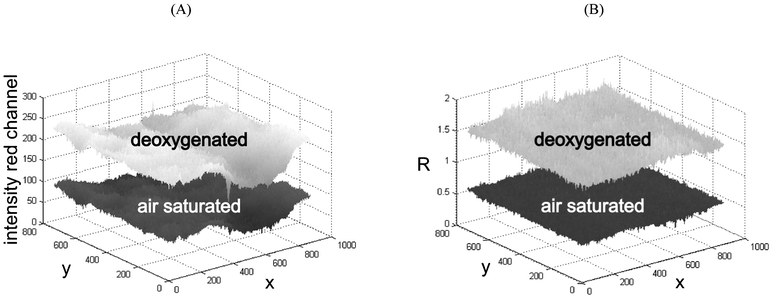 | ||
| Fig. 3 (A) Intensity response (red channel) of the oxygen sensor and (B) ratiometric (referenced) image obtained by division of the red by the green channel. | ||
Table 2 shows a qualitative comparison of intensity imaging and ratiometric imaging. The values in brackets display the relative standard deviations of the obtained intensity or referenced signal within one image. With the ratiometric imaging approach the error was decreased to less than half of the intensity imaging standard deviation.
| pO2 [hPa] | Intensity (red) image [a.u.] | Ratiometric image R [a.u.] |
|---|---|---|
| 0 | 219 ± 17 (± 7.7%) | 1.588 ± 0.049 (± 3.1%) |
| 210 | 92 ± 10 (± 10.7%) | 0.631 ± 0.023 (± 3.6%) |
Sensor calibration
A Stern–Volmer calibration curve of a microfluidic sensor chip calibrated with gaseous oxygen is shown in Fig. 4. The experimental data points show the typical non-linearity, which is also known for many other optical sensors described in literature.35 An adapted version of the two-site model of Demas et al.36 was used to fit the calibration data.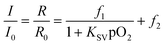 | (1) |
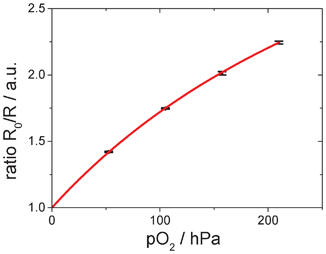 | ||
| Fig. 4 Calibration plot of the used sensor showing the nonlinear fit (simplified two-site-model). The black dots and error bars show experimental data from 3 independent calibration measurements. | ||
Versatility of sensor setup
Oxygen imaging using the presented microfluidic chips with integrated sensor layers not only enabled microscopic oxygen imaging but also “macroscopic” imaging. Here macroscopic refers to parallelized measurements with basically the same sensor setup, where one image shows multiple microfluidic channels. Both, the microscopic and the macroscopic approach equally benefit from the use of ratiometric imaging, as they are usually subject to inhomogeneous illumination and detection efficiencies. Fig. 5 shows a color and an oxygen image. Choosing suitable camera lenses and excitation sources allows for performing microscopic imaging to resolve oxygen concentration within one microfluidic channel (Fig. 5(A) and (B)) and for macroscopic and parallelized measurements (Fig. 5(C) and (D)) within one image.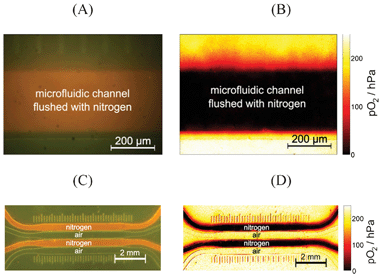 | ||
| Fig. 5 (A) Microscopic color (original) image and (B) calculated oxygen image of one channel of a microfluidic chip, which is flushed with nitrogen. (C) Macroscopic color (original) image and (D) calculated oxygen image of four channels of the same microfluidic chip; the first and the third channel were flushed with nitrogen, while the other channels contained air. | ||
2D oxygen information of microfluidic cell cultures
As mentioned in the introduction, 2D measurements allow a more detailed look at oxygen levels and gradients inside microbioreactors. This chapter assesses the importance of these measurements, especially when oxygen consumption of complex cell clusters is observed.Fig. 6 shows how oxygen gradients can be resolved in a cell culture microenvironment. (A) and (D) show phase contrast images of (A–C) a HeLa cell monolayer and (D–F) fibroblasts forming a cell cluster. (B) and (E) show the corresponding pO2 images. While the oxygen level of the monolayer is rather homogeneous, oxygen gradients can clearly be seen in the case of the cell cluster. Towards the center of the cell cluster oxygen concentration is significantly lower compared to the edge of the cluster or even cell free areas. Fig. 6(C) and (F) compare the pO2 gradients taken from a horizontal line in the images to the mean pO2, which would be obtained by a single point measurement of a fiber optic sensor with d = 1 mm2. In case of the HeLa cell monolayer, the pO2 gradient over the image is fairly constant and can be approximated by the mean pO2 without loss of relevant information. Here, a single point measurement would be a sufficiently good alternative for 2D information. The cell cluster in Fig. 6(D) to (F), however, shows an example of a clear pO2 gradient. Some areas of the cell cluster almost face hypoxic conditions, while the mean pO2 displays sufficient oxygen supply. Since oxygen tension impacts basic metabolic functions, it is important to know that cells in some areas were exposed to low oxygen concentration. Here oxygen imaging can serve as a tool to observe the heterogeneous oxygen distribution during experimentation in cellular assays.
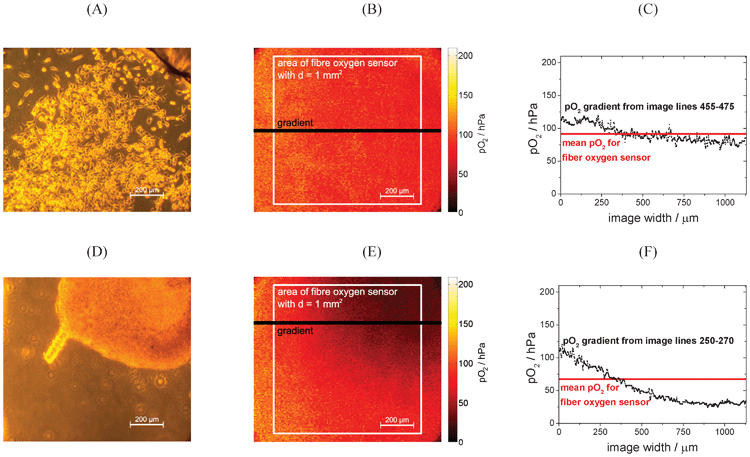 | ||
| Fig. 6 (A) Phase contrast and (B) pO2 image of HeLa cells forming a monolayer with marks for regions of interest for data evaluation. After overnight cell adhesion, the chip was rinsed with medium to replenish oxygen. Then the flow was stopped and after 1 h the images were taken to show cellular oxygen consumption. (C) shows the pO2 gradient of image lines 445–475 of image (B); mean pO2 over image area covering the area of an optical fiber is 91.5 hPa, while the detailed gradient from lines 455–475 ranges from 67.3 to 119.0 hPa; (D) phase contrast and (E) pO2 image of fibroblasts forming a cell cluster with marks for regions of interest for data evaluation. The images were taken 13 h after seeding the chip with fibroblasts. (F) shows the pO2 gradient of image lines 250–270 of the pO2 image; mean pO2 over image area covering the area of an optical fiber is 67.3 hPa, while the detailed gradient ranges from 24.0 to 120.0 hPa. | ||
In addition to spatial information on oxygen distribution, for many applications also temporal resolution is of interest. For example, it can be important to follow the metabolic activity of cells during pharmaceutical drug screening or environmental monitoring. In Fig. 7 oxygen changes in a microfluidic chip containing a HeLa cell aggregate were monitored over time. A region of interest (red square, 250 × 250 μm2) was selected in the center of the cell cluster and the mean pO2 values of this region were extracted from the oxygen images.
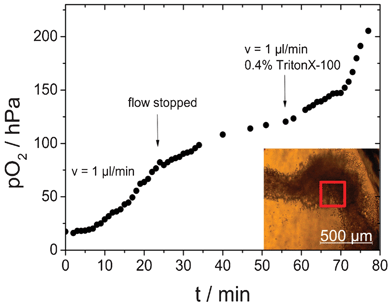 | ||
| Fig. 7 Oxygen imaging of HeLa cells over time; the microfluidic chip was flushed with 0.4% Triton X in medium. The curve shows the average pO2 of a region of interest (red square, 250 × 250 μm2) with high cell density. | ||
Oxygen sensing was started after overnight formation of the cell cluster without medium flow resulting in low initial oxygen concentrations. First the microfluidic channel was flushed with medium (v = 1 μL min−1) for 23 min. During the first minutes no change in oxygen concentration was observed. This can easily be explained by the fluidic dead volume. After the volume of the cell chambers was exchanged with fresh air saturated medium an increase in oxygen levels was observed. However, this increase was not very rapid, because it was counteracted by the cells' oxygen consumption. The balance between oxygen supply and cellular respiration resulted in an overall constant increase of pO2. After 23 min the medium flow was stopped. Oxygen supply was therefore limited to diffusion through the medium and consequently the increase in the oxygen concentration became slower and eventually reached a plateau. Then (after 57 min) the medium flow was started again (t = 57 min), but this time 0.4% Triton X was added to the medium. Triton X is a detergent that rapidly kills cells by destroying their membranes. When the Triton X containing medium reached the cells (t = 70 min), a clear and fast increase of pO2 was observed. This strong increase indicates reduced oxygen consumption as a result of cell death. Importantly, at this point oxygen levels also became almost constant over the entire image area. The experiment showed that oxygen imaging allows for time resolved information on oxygen levels within a microfluidic device with high sensitivity by selecting a highly sensitive region of interest with high cell densities. The method enables the monitoring of respiration rates as indicator of metabolic activity for instance during pharmaceutical drug screening.
Conclusion
In this work we adapted a fabrication process of microfluidic chips for integration of luminescent sensing films and implemented ratiometric oxygen imaging inside microfluidic environments. This ratiometric approach allows for improved read outs compared to intensity imaging because of data normalization to a non-oxygen sensitive reference dye. Ratiometric imaging yielded less than half the standard deviation compared to intensity imaging. The non-linear two-site model was used to accurately describe the experimental calibration curve. The applied sensor setup allowed for performing temporally and spatially resolved measurements inside microfluidic environments ranging from microscopic to macroscopic and parallelized oxygen imaging.The sensitivity of the selected sensor setup showed to be sufficiently accurate to monitor 2D oxygen levels in human cell culture devices. The technology can be used in laboratories working with microfluidic cell cultures to better control and optimize cultivation conditions and opens the way for novel cell based assays in the highly relevant fields of tissue engineering, tumor biology and hypoxia reperfusion phenomena.
Acknowledgements
Financial support by the Austrian Research Promotion Agency (FFG) in the framework of the Austrian Nano Initiative (Research Cluster 0700–ISOTEC) and by the European Union FP7 Project BIOINTENSE – Mastering Bioprocess integration and intensification across scales (Grant Agreement Number 312148) is gratefully acknowledged.Notes and references
- S. M. Grist, L. Chrostowski and K. C. Cheung, Sensors, 2010, 10, 9286–9316 CrossRef CAS
.
- M. Csete, Ann. N. Y. Acad. Sci., 2005, 1049, 1–8 CrossRef CAS
- M. C. Simon and B. Keith, Nat. Rev. Mol. Cell Biol., 2008, 9, 285–296 CrossRef CAS
- S. Lahiri, J. Appl. Physiol., 2000, 88, 1467–1473 CAS
- M. Radisic, J. Malda, E. Epping, W. Geng, R. Langer and G. Vunjak-Novakovic, Biotechnol. Bioeng., 2006, 93, 332–343 CrossRef CAS
- M. Höckel and P. Vaupel, J. Natl. Cancer Inst., 2001, 93, 266–276 CrossRef
- E. O. Pettersen, L. H. Larsen, N. B. Ramsing and P. Ebbesen, Cell Proliferation, 2005, 38, 257–267 CrossRef
- C. Yeom, Y. Goto, Y. Zhu, M. Hiraoka and H. Harada, Int. J. Mol. Sci., 2012, 13, 13949–13965 CrossRef CAS
- G. L. Semenza, Cancer Metastasis Rev., 2000, 19, 59–65 CrossRef CAS
- D. Fan, L. R. Morgan, C. Schneider, H. Blank, S. Roy, Y. F. Wang and S. Fan, J. Cancer Res. Clin. Oncol., 1985, 110, 209–215 CrossRef CAS
- O. Trédan, C. M. Galmarini, K. Patel and I. F. Tannock, J. Natl. Cancer Inst., 2007, 99, 1441–1454 CrossRef
- Y. Liu and S. Wang, Colloids Surf., B, 2007, 58, 8–13 CrossRef CAS
- M. A. Acosta, P. Ymele-Leki, Y. V. Kostov and J. B. Leach, Biomaterials, 2009, 30, 3068–3074 CrossRef CAS
- K. Kellner, G. Liebsch, I. Klimant, O. S. Wolfbeis, T. Blunk, M. B. Schulz and A. Göpferich, Biotechnol. Bioeng., 2002, 80, 73–83 CrossRef CAS
- D. Schäpper, M. Alam, N. Szita, A. Eliasson Lantz and K. Gernaey, Anal. Bioanal. Chem., 2009, 395, 679–695 CrossRef
- R. H. W. Lam, M.-C. Kim and T. Thorsen, Anal. Chem., 2009, 81, 5918–5924 CrossRef CAS
- A. P. Vollmer, R. F. Probstein, R. Gilbert and T. Thorsen, Lab Chip, 2005, 5, 1059–1066 RSC
- V. Nock, R. J. Blaikie and T. David, Lab Chip, 2008, 8, 1300–1307 RSC
- D. Sud, G. Mehta, K. Mehta, J. Linderman, S. Takayama and M.-A. Mycek, J. Biomed. Opt., 2006, 11, 050504 CrossRef
- B. Ungerböck, A. Pohar, T. Mayr and I. Plazl, Microfluid. Nanofluid., 2013, 14, 565–574 CrossRef
- V. Nock and R. J. Blaikie, IEEE Sens. J., 2010, 10, 1813–1819 CrossRef CAS
- V. Nock and R. J. Blaikie, in 2009 IEEE Sensors, 2009, pp. 1248–1251 Search PubMed.
- P. C. Thomas, S. R. Raghavan and S. P. Forry, Anal. Chem., 2011, 83, 8821–8824 CrossRef CAS
- G. Mehta, K. Mehta, D. Sud, J. Song, T. Bersano-Begey, N. Futai, Y. S. Heo, M.-A. Mycek, J. Linderman and S. Takayama, Biomed. Microdevices, 2007, 9, 123–134 CrossRef CAS
- H. Zhu, X. Zhou, F. Su, Y. Tian, S. Ashili, M. R. Holl and D. R. Meldrum, Sens. Actuators, B, 2012, 173, 817–823 CrossRef CAS
- Z. Lin, T. Cherng-Wen, P. Roy and D. Trau, Lab Chip, 2009, 9, 257–262 RSC
- G. Liebsch, I. Klimant, B. Frank, G. Holst and O. S. Wolfbeis, Appl. Spectrosc., 2000, 54, 548–559 CrossRef CAS
- M. I. J. Stich, S. M. Borisov, U. Henne and M. Schäferling, Sens. Actuators, B, 2009, 139, 204–207 CrossRef
- Y. Feng, J. Cheng, L. Zhou, X. Zhou and H. Xiang, Analyst, 2012, 137, 4885–4901 RSC
- M. Larsen, S. M. Borisov, B. Grunwald, I. Klimant and R. N. Glud, Limnol. Oceanogr.: Methods, 2011, 9, 348–360 CrossRef CAS
- X. Wang, R. J. Meier, M. Link and O. S. Wolfbeis, Angew. Chem., Int. Ed., 2010, 49, 4907–4909 CrossRef CAS
- R. J. Meier, L. H. Fischer, O. S. Wolfbeis and M. Schäferling, Sens. Actuators, B, 2013, 177, 500–506 CrossRef CAS
- T. Förster, Ann. Phys., 1948, 437, 55–75 CrossRef
- T. Mayr, S. M. Borisov, T. Abel, B. Enko, K. Waich, G. Mistlberger and I. Klimant, Anal. Chem., 2009, 81, 6541–6545 CrossRef CAS
- E. R. Carraway, J. N. Demas and B. A. DeGraff, Anal. Chem., 1991, 63, 332–336 CrossRef CAS
- J. N. Demas, B. A. DeGraff and W. Xu, Anal. Chem., 1995, 67, 1377–1380 CrossRef CAS
Footnote |
| † Birgit Ungerböck and Verena Charwat contributed equally to this work. |
| This journal is © The Royal Society of Chemistry 2013 |