Revealing hidden paint layers in oil paintings by means of scanning macro-XRF: a mock-up study based on Rembrandt's “An old man in military costume”†
Matthias
Alfeld
*a,
Wout
De Nolf
a,
Simone
Cagno
a,
Karen
Appel
b,
D. Peter
Siddons
c,
Anthony
Kuczewski
c,
Koen
Janssens
a,
Joris
Dik
d,
Karen
Trentelman
e,
Marc
Walton
e and
Andrea
Sartorius‡
f
aAXI2L Research group, Department of Chemistry, University of Antwerp, Groenborgerlaan 171, B-2020 Antwerp, Belgium. E-mail: matthias.alfeld@ua.ac.be; koen.janssens@ua.ac.be; Fax: + 32 (0)326 2376; Tel: +32 (0)32653326
bHamburger Synchrotronstrahlungslabor (HASYLAB) at the Deutsches Elektronen Synchrotron (DESY), Notkestr. 85, D-22607, Hamburg, Germany
cNational Synchrotron Light Source, Brookhaven National Laboratory, 75 Brookhaven Avenue, Upton, NY 11973-5000, USA
dDelft University of Technology, Department of Materials Science, Mekelweg 2, 2628CD Delft, The Netherlands
eThe Getty Conservation Institute, 1200 Getty Center Drive, Suite 700, Los Angeles, CA 90049-1684, USA
fPaintings Conservation Department, J. Paul Getty Museum, 1200 Getty Center Drive, Los Angeles, CA 90049-1687, USA
First published on 22nd November 2012
Abstract
Over the past several decades the oeuvre of Rembrandt has been the subject of extensive art historical and scientific investigations. One of the most striking features to emerge is his frequent re-use of canvases and panels. The painting An Old Man in Military Costume (78.PB.246), in the collection of the J. Paul Getty Museum, is an example of such a re-used panel. Conventional imaging techniques revealed the presence of a second portrait under the surface portrait, but the details of this hidden portrait have not yet been revealed. Vermilion (HgS) has been identified to have been used nearly exclusively in the flesh tones of the lower painting, suggesting that element-specific XRF imaging might successfully image the hidden portrait. To test this hypothesis, a full-scale mock-up of the painting was created, including a “free impression” of the hidden portrait, reproducing as closely as possible the pigments and paint stratigraphy of the original painting. XRF imaging of the mock-up painting was conducted using three different XRF imaging systems: a mobile X-ray tube based system and two synchrotron-based setups (one equipped with multiple SDDs and one equipped with a Maia detector). The sensitivity, limits of detection and imaging capabilities of each system under the chosen experimental conditions are evaluated and compared. The results indicate that an investigation of the original painting by this method would have an excellent chance of success.
Introduction
The relatively new technique of scanning macro-XRF1,2 (MA-XRF) offers possibilities for visualizing hidden layers in oil paintings in a non-destructive and non-invasive manner that, up to now, could not be realized with established methods, such as X-ray radiography (XRR), infrared reflectography (IRR) and neutron activation autoradiography (NAAR). In MA-XRF the macroscopic lateral distribution of elements in a painting is determined by scanning its surface with an X-ray beam that has a diameter of several hundreds of micrometers up to 1 mm. The emitted fluorescence radiation is collected by one or more energy dispersive X-ray detector(s). From the resulting XRF spectra, the presence and relative abundance of many elements can be determined. Due to the penetrative nature of X-rays, information is not only obtained from the material at the surface, but also from several hundred micrometers deep, thus allowing the visualization of buried paint layers. The principle feasibility of imaging a covered portrait was first demonstrated by Dik et al.3 on Vincent van Gogh's painting A Patch of Grass and since then on paintings by Rembrandt van Rijn,4,5 Philipp Otto Runge,6 Goya,7 N. C. Weyth8 and A. Streeton.9 Most of these investigations involve the use of synchrotron radiation. Mobile setups that allow MA-XRF investigations of paintings have recently been described by Hocquet et al.10,11 and Alfeld et al.12 and are to some extent also realized in the ARTAX13 instrument (Röntec GmbH, Berlin, now Bruker Nano GmbH, Berlin, Germany) with which small areas of paintings can be scanned.14In this paper we explore for the first time the possibilities of optimizing the MA-XRF investigation of a work by Rembrandt called An Old Man in Military Costume (Fig. 1a–d) [J. Paul Getty Museum (78.PB.246)] via the preparation of a detailed mock-up. The main purpose was to determine the extent to which the typical pigments of Rembrandt's palette (especially vermilion, HgS, in the flesh tones) could be visualized through a covering painting, executed in the same palette. This innovative manner of preparing for a MA-XRF investigation offers a number of advantages but also has some limitations that are discussed below.
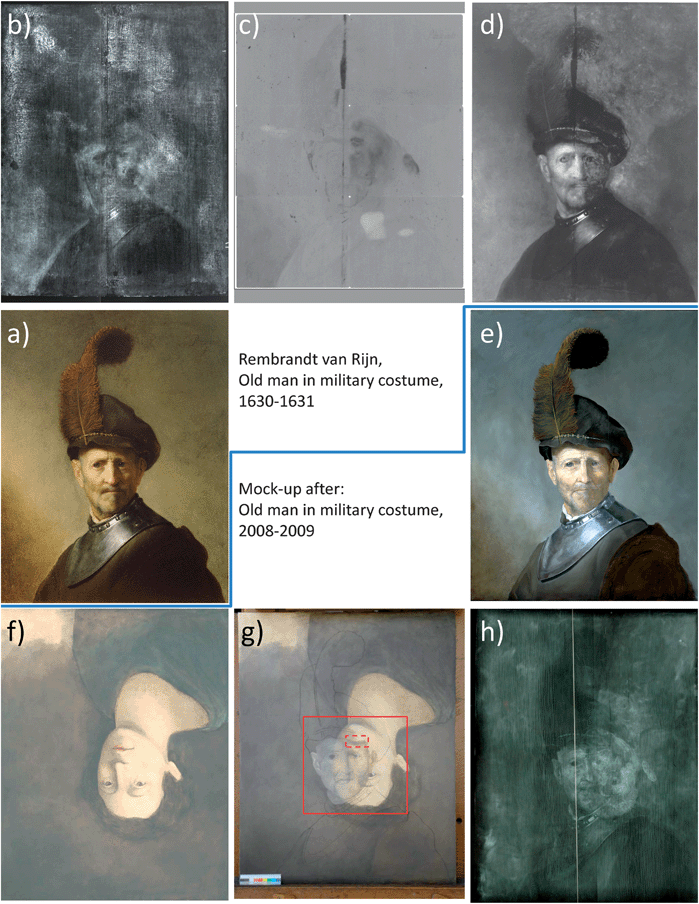 | ||
| Fig. 1 (a) Rembrandt van Rijn, Old Man in Military Costume, 1630-31, oil on panel (50.8 × 66 cm), The J. Paul Getty Museum, Los Angeles, 78.PB.246. (b) X-radiograph, (c) montage of six NAA image plates acquired 8.4 days after activation, exposure 2.5 days; (d) infrared reflectogram acquired using Inframetrics Infracam (PtSi), 1000–2500 nm; (e) final mock-up painting subject to this study; (f) recreation of the hidden portrait, (g) recreation of the hidden portrait with a sketch of the final portrait above, and (h) radiograph of the mock-up painting. In (g) the areas investigated in more detail are indicated by red lines. The solid lines indicate the scan of the whole facial area, while the dashed lines indicate the detailed high resolution investigations. | ||
The painting was chosen for this study, as conventional imaging techniques such as X-ray radiography (XRR, see Fig. 1b) revealed the presence of an over painted portrait under the surface, but failed to visualize its details.15 Additional investigations using neutron activation autoradiography (NAAR), while providing limited elemental information, likewise only produced a faint impression of the hidden portrait (see Fig. 1c). Infrared reflectography (IRR), a technique frequently employed to reveal underdrawings, produced an image in which the underdrawing of the upper portrait could be observed, but the hidden portrait appears only as a diffuse mass (see Fig. 1d).
Non-invasive investigations employing single-spot X-ray fluorescence (XRF) spectroscopy and X-ray diffraction (XRD), together with the study of limited number of samples removed from the painting's edges and mounted for cross-section analysis, provide important, but localized information regarding the composition and stratigraphy of the paint layers. Consequently, it is still unclear if/how the hidden figure relates to Rembrandt's known oeuvre, what place it has in young Rembrandt's stylistic development and which period/year the lower painting was created.
Great effort was made to reproduce a materially accurate, full-scale mock-up of the painting, faithfully replicating the original object in terms of paint layer stratigraphy as well as pigment composition (see Fig. 1e–h). Second, three different MA-XRF scanners were employed to systematically examine the mock-up. In this manner, the scanners were compared not only in terms of spectroscopic figures-of-merit, but also with respect to their imaging capability in a situation strongly approaching the reality and complexity of Baroque paintings. This comparison would not have been possible with an original painting, as it would be irresponsible to expose a unique precious work of art to the stress of transporting it to multiple experiments.
In addition to comparing the results of the three different MA-XRF scanners, the aim of the comparison exercise was to answer the following research questions:
(1) Is it possible to obtain a more detailed visualization of the hidden layers beneath the surface of An Old Man in Military Costume with one of the three scanners than with a combination of XRR/IRR and if so, how accurate and how complete is such a visualization?
(2) Is it worthwhile transporting the valuable Rembrandt panel from the P.J. Getty Museum to a (nearby) synchrotron facility for a MA-XRF investigation or would the use of a mobile MA-XRF in the museum itself yield equivalent information?
To answer these questions, in what follows, we present and compare MA-XRF imaging results from the mock-up painting obtained using: (1) a mobile MA-XRF instrument employing a Mo-target micro-focus X-ray tube, (2) a synchrotron radiation (SR)-based system at the Hamburger Synchrotronstrahlungslabor (HASYLAB) at the Deutsches Elektronen-Synchrotron (DESY, Hamburg, Germany), using multiple conventional Silicon-Drift-Detectors (SDDs) for detection, and (3) a SR-based system at the National Synchrotron Light Source (NSLS, Brookhaven National Laboratory, Upton, New York, USA), using a prototype of the Maia detector. These three scanners were specifically assembled for these measurements and have not (yet) been described in this form in the literature. Via spectral data obtained from reference materials, the capabilities of the three systems are compared in terms of sensitivity and limits of detection.
Beyond the comparison of the scanners, having a full-scale materially correct replica also enables one to conduct complete “dry runs”, i.e., to evaluate all aspects of the study, including the transportation, handling and mounting of the painting for analysis.
Experimental
Preparation of the mock-up and preliminary investigations
The mock-up was prepared based on information about the composition and stratigraphy of the paint layers in the original painting obtained via XRR and NAAR studies together with compositional analysis of selected areas conducted using XRF, XRD and cross-sectional analysis of a limited number of samples removed from the edges of the painting. The analyses were carried out at the J. Paul Getty Museum with the collaboration of the Getty Conservation Institute. These investigations were predominantly of a qualitative nature, so that the concentration of the pigments used to paint the mock-up may differ from those in the original. The chemical composition and manufacturer of each pigment are given as ESI.† The elements expected to be detected by X-ray fluorescence and a schematic illustration of the stratigraphy of the mock-up are presented in Fig. 2. All paints used in the mock-up were prepared using linseed oil as a binder.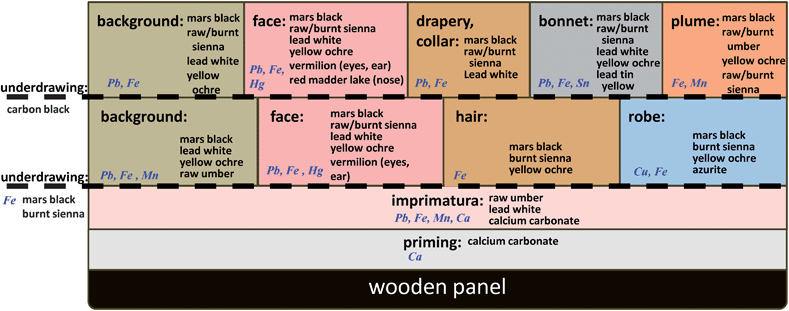 | ||
| Fig. 2 Schematic stratigraphy of the mock-up with elemental markers of paint layers. | ||
An oak panel assembled from two boards was used as a substrate and sized with a rabbit skin glue. The priming layer consisted of calcium carbonate mixed in 10% rabbit skin glue, and a second priming layer, the imprimatura, additionally contained the pigments raw umber and lead white.
A free impression of the underlying figure was designed based on the X-radiograph of the original painting. An underdrawing of the impression of the hidden figure was sketched using a mixture of the pigments mars black and burnt sienna, and the flesh tones, background and drapery of the hidden portrait were subsequently completed (Fig. 1f) using the pigments indicated in Fig. 2 for the various areas of the underlying figure. The brown and black tones of the flesh, hair and background were created using mixtures of iron oxide earth pigments (yellow ochre, raw umber, burnt and raw sienna, mars black) admixed with lead white. Based on localized analyses conducted using XRF and XRD, the red mercury-containing pigment vermilion (HgS) and the blue copper-based pigment azurite (CuCO3·Cu(OH)2) were used for the lips (and fewer amounts in the chin, proper left ear and proper left cheek) and robe, respectively, of the hidden portrait.
The upper portrait is inverted with respect to the lower portrait, so the panel was rotated 180°. There is no evidence of a priming layer between the upper and lower portraits, so the underdrawing for the upper portrait was created, using carbon black, directly on the underlying portrait (Fig. 1g). The flesh tones, background, drapery, collar and plume were painted using the pigments shown in Fig. 2 for the various areas. Similar to the hidden portrait, the flesh tones, drapery and background were painted using mixtures of iron earth pigments (yellow ochre, raw and burnt sienna, mars black), admixed with lead white. The feather plume additionally contained umber (Mn containing) pigments. Unique to the upper portrait is the use of lead–tin yellow (Pb2SnO4) for the small decorations along the decorative band of the bonnet. Along with iron-oxide based pigments, additional red tones in the upper portrait were created using the organic pigment madder on the nose; small amounts of the mercury-containing pigment vermilion were applied around the proper right ear and corner of the left eyes only. The finished visible portrait that was subject to our investigations is shown in Fig. 1e. Fig. 1h shows the X-radiograph of the mock-up. Similar to the radiograph of the original (see Fig. 1d), detailed features of the hidden portrait are not visible.
MA-XRF investigations
In order to scan a large area (i.e., of several hundred square centimeters) in a reasonable time (i.e., a few days) with an acceptable signal-to-noise level, it is advisable to employ detector(s) that record fluorescence radiation from a large solid angle and a high intensity primary X-ray source, such as a synchrotron storage (SR) facility. Indeed, the primary radiation at a SR is so intense that it allows losing a major part of the beam's intensity in a monochromator and still yielding a primary beam intensity that allows for fast acquisition.SR-based MA-XRF has until recently been limited by the lack of dedicated detectors to handle high intensity fluorescence radiation. Commonly available Silicon-Drift-Detectors (SDDs) are designed to efficiently collect photons in experiments generating relatively low fluorescence radiation intensity levels (<100.000 cps) and easily become oversaturated in SR-based XRF experiments unless the intensity of the fluorescence radiation reaching the detector is diminished by primary beam attenuation and/or detector collimation. However, the recent development of dedicated detectors for SR-based XRF, such as the Maia detector, may provide a solution. The prototype Maia detector consists of 96 detectors, each with 1 mm2 of active area;16,17 the limited size of each detector element makes it less prone to being oversaturated than a single SDD with a larger active area, but taken as a whole, the Maia detector array is a sensitive, high-throughput X-ray detector that allows exploiting high intensity primary radiation. Despite the high sensitivity of the Maia, the prototype used in these experiments was hindered by its energy resolution that is still significantly worse than that of a SDD. Furthermore, the Maia has a low response to low energy radiation, so imaging of elements lighter than Ca by their K-shell fluorescence is normally not possible.
MA-XRF scans of the mock-up were conducted using three different experimental setups that are described in each of the sections below and shown in Fig. 3. The areas of the mock-up scanned by each of the three instruments are indicated in Fig. 1g.
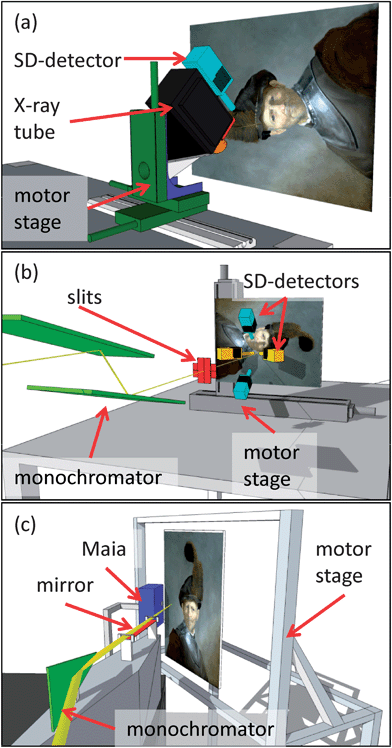 | ||
| Fig. 3 Schematics of XRF instruments used. (a) Mobile X-ray tube based scanner, (b) DESY scanner with SDDs, and (c) NSLS scanner with Maia. | ||
X-ray tube based MA-XRF investigations
The mobile MA-XRF scanner (see Fig. 3a) consisted of an air-cooled 60 W Kevex micro-focus X-ray tube (Kevex, CA, USA) with a Mo-target and a Vortex-EX60 SDD (SII, Northridge, CA, USA) detector with an active area of 50 mm2 that were mounted on an XYZ motor stage (Micro-Controle Spectra-Physics S.A., Évry, France) in a detector/beam geometry of 90°. The maximum travel distance of the stage was 10 cm in each direction. This scanner is a slightly improved version of “Instrument A” described in ref. 12.The signals recorded by the detector were analyzed by an Inspector CSERF (Canberra Inc., CT, USA) Multi Channel Analyzer (MCA). In order to prevent excessive heating of the X-ray tube head, it was operated at a power level of 10 W. The scanner was equipped with a polycapillary lens (XOS, NY, USA), yielding a primary beam of around 50 μm at the focus. During the experiments the painting was moved 2 mm out of focus, resulting in a beam diameter of 100 to 200 μm. As described in more detail elsewhere,1 the transmission efficiency of the lens is relatively low in the energy range above 20 keV. This polycapillary lens was employed for high resolution scans of the details of the portrait(s). An alternative beam defining element, a Pb pinhole collimator (of 700 μm diameter) was employed during the measurement of the entire face. Besides yielding a less divergent beam, the pin hole also transmits the high energy components of the bremsstrahlung spectrum of the X-ray tube; this is useful for the excitation of K-shell fluorescence radiation of elements such as Ag, Sn, Sb and Ba.
Due to the limited travel range of the motorized stages, the face was scanned in subareas of 10 × 10 cm2 that were later assembled to yield an overall distribution map. All scans were performed with tube settings of 35 kV and 150 μA. The detailed scan was done with a step size of 300 micrometers and live times of 14 s per pixel; the scan of the entire facial area was done with 1 mm step size and a live time of 15 s per pixel, resulting in a total scanning time of 19 days for the face and 7 days for the detailed scan shown below.
SR-based MA-XRF investigations employing multiple SDDs
The SR-based scanner at DESY is illustrated schematically in Fig. 3b. The fluorescence radiation emitted from the excited spot on the painting was collected with two Vortex-EX60 and two Vortex-EX90 SDDs. All detectors were positioned at angles of roughly 45° relative to the primary X-ray beam that intersected the surface of the painting at normal incidence. The active area of each detector is 50 mm2, providing a total active area of 200 mm2. However, two of the detectors were positioned roughly 20 cm away from the painting's surface and 1.5 mm diameter collimators were mounted on the other two to reduce the intensity of the scattered radiation reaching the detector, thus leading to a considerably lower solid angle than the total active area of 200 mm2 would suggest. The analog output of the detectors was processed with a XIA-XMAP multi-channel analyzer (MCA) (XIA LLC, Hayward CA, USA) to obtain energy dispersive spectra of the collected fluorescence radiation. The painting was scanned by moving it continuously through a beam collimated by a pair of slits.Similar to the tube-based investigations, along with an overview scan of the entire facial area (ca. 23 × 23 cm2, step size 0.5 mm, collimated beam of 0.5 × 0.5 mm2, dwell time 1.5 s per pixel, primary energy of quasi-monochromatic beam: 32 keV), a number of detailed areas were scanned with smaller step size (0.3 mm, collimated beam of 200 μm × 250 μm (horizontal × vertical), dwell time of 0.7 s per pixel). For the latter scans, a monochromatic beam of 27 keV was employed; quasi-monochromatic radiation (ΔE/E: 1%) was obtained via a Ni/C multilayer monochromator from white radiation generated in a bending magnet of the second generation synchrotron ring DORIS III. The overview scan took 3 days while the area of the lip investigated in detail was scanned in five hours.
SR-based MA-XRF investigations employing a Maia detector
At Beamline X7A of the NSLS use was made of a horizontally focusing curved-crystal monochromator to extract an energy band of 12.7 keV from the white radiation, emitted from a bending magnet source. The fluorescence radiation was collected by means of a prototype of the Maia detector, consisting of an array of 96 individual 1 mm2 Si detectors. With a total active area of roughly 1 cm2 the Maia detector has a sensitivity comparable to a conventional SDD detector, while it is due to the small size of the individual detector element less prone to be oversaturated, so that a much higher flux of fluorescence photons can be processed. The detector was positioned 5 cm from the painting's surface and not collimated, so that the solid angle covered by the active area of the detector in this instrument was roughly 10 times that of the DESY instrument.The primary energy was selected so as to be below the Pb-L3 absorption edge (13.0 keV) but above the Hg-L3 absorption edge (12.3 keV). This was done to avoid the spectral interference between the Hg-Lα (10.0 keV) and the Pb-Lα (10.6 keV) lines. Therefore, by means of this scanner, elements up to Se (Se-K absorption edge: 12.7 keV) could be detected via their K-lines and up to Hg via their L-lines. Due to the low response to low energy radiation the distribution of Pb could not be imaged by its M-lines. The pre-focused monochromatic beam was focused down to 100 × 100 μm2 by means of a bent mirror, fabricated from Pt coated commercial float-glass. Nearly the entire area of the mock-up (ca. 50 × 50 cm2) was scanned with a pixel size of 250 μm and a dwell time of 18 ms. The entire data collection took ca. 24 h.
Data processing
The spectral data acquired with the tube-based system and the multiple SDD configuration employed at the DESY SR-based setup were evaluated by the AXIL software package18 and in-house written software. The data acquired with the Maia detector were evaluated with the GeoPIXE software package,19 making use of off-line Dynamic Analysis (DA) with a DA matrix based on the sum spectrum of the entire scan.20 The relative limits of detection (LODs) of all setups were calculated based on results obtained with PyMCA21 from spectra of a multi-element reference glass.In the case of the DESY scanner, spectra of the same image location recorded by different individual Vortex detectors were scaled to the same energy calibration and summed for evaluation. Furthermore, the distribution maps obtained with this scanner were normalized to the summed intensity of the incoherent scattered radiation per line to correct for variations in the primary beam's intensity and resulting dead time variations in one operation.
Results and discussion
Analytical characteristics of the MA-XRF setups
Since the three scanners used in this work were specifically assembled for these measurements, their performance was to be compared in a quantitative manner, thus providing additional means to evaluate the quality of the resulting images. The sensitivity and limits of detection of each system were determined from measurements of National Institute of Standards and Technology (NIST) Standard Reference Material (SRM) 611 Trace elements in glass. NIST SRM 611 is a 1 mm thick glass disk, containing a broad range of trace elements at a nominal concentration level of 500 ppm. The concentration of elements not certified by the manufacturer was taken from ref. 22. Spectra acquired from this sample are shown in Fig. 4. The higher sensitivity of the NSLS system over the DESY system and the X-ray tube based scanners is rather obvious, as is the difference in energy resolution.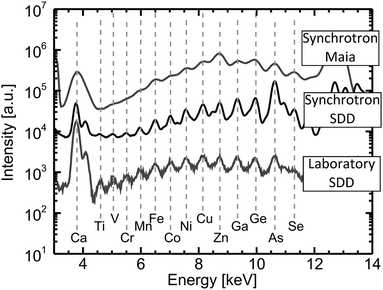 | ||
| Fig. 4 Spectra of NIST SRM 611 (Trace Elements in Glass) obtained with the SR- and X-ray tube based MA-XRF scanners equipped with polycapillary. Only the Kα lines of the elements present are indicated. The seemingly enhanced As signal in the case of the synchrotron SDD scanner is due to a blind contribution from the shielding of the scanner. | ||
From these spectra the sensitivity (number of photons counted per mass unit), and the limits of detection (amount of material that needs to be present for its signal to be discernible from the background) were calculated for the Kα and Lα lines of a number of selected elements and the results are shown in Fig. 5a and b, respectively. Details of these calculations are given as ESI†.
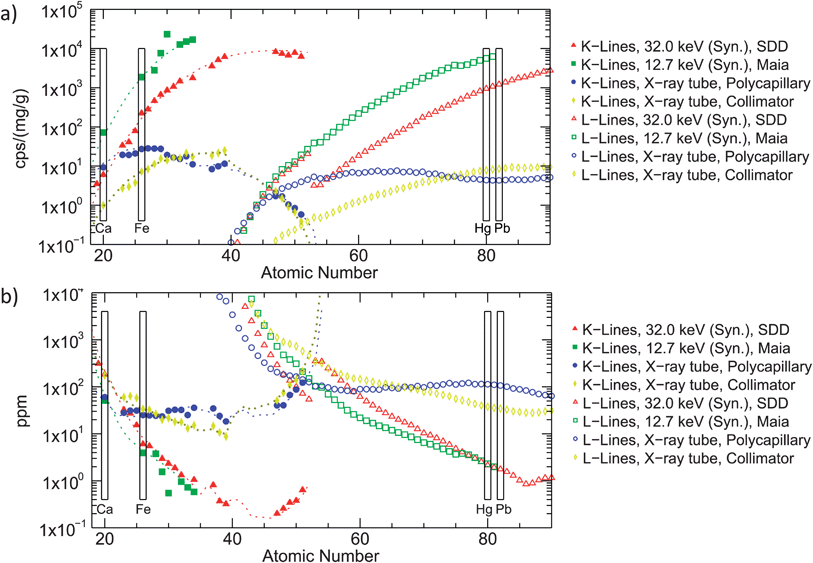 | ||
| Fig. 5 Sensitivity (a) and Limits of detection (LODs) for 1000 s acquisition time (b) of the synchrotron and X-ray tube based MA-XRF scanners. L-line values were calculated based on the fundamental parameter approach. Dotted lines indicate calculated K-line values. | ||
These figures of merit could be directly measured for K-level radiation, but due to spectral interferences it was not possible to do the same for L-level fluorescence radiation. To obtain similar values for the L-lines the sensitivities of the instruments were modeled using a fundamental parameter approach, as described in ref. 1 and 23. The spectrum of the X-ray tube was calculated by ref. 24, while all physical values were taken from XRAYLIB (Version 2.15.0).25,26 The corresponding LOD values were obtained from the calculated sensitivities and the experimentally determined background intensities. While these values do not represent detection limits for these elements in NIST SRM 611 or in a paint layer matrix, they do allow a comparison between the instruments to be made, as any systematic deviations from reality are considered to be equal for all scanners.
As to be expected is the performance of the X-ray tube-based MA-XRF scanner strongly dependent on the type of optic used. As can be seen in Fig. 5a and Table 1, in terms of sensitivity, the use of a polycapillary optic instead of a pinhole/collimator is advantageous for the detection of elements with a fluorescence energy below 8.5 keV. It should be noted that for the main element of interest in the underlying portrait in the Rembrandt painting, Hg (Z = 80), the collimator optic gives better results. However, it was not used for the more detailed scans, since it was not possible to produce a small beam of sufficient intensity in this manner.
| Element | Z |
E (keV) (Kα or Lα)![[thin space (1/6-em)]](https://www.rsc.org/images/entities/char_2009.gif) |
Sensitivity (cps per mg g−1) | LOD (μg g−1) | ||||||
|---|---|---|---|---|---|---|---|---|---|---|
| X-ray tube | SR | X-ray tube | SR | |||||||
| Polycapillary | Collimator | SDD | Maia | Polycapillary | Collimator | SDD | Maia | |||
| Ca | 20 | 3.7 | 12 | 1.0 | 5.2 | 62 | 48 | 188 | 215 | 51 |
| Fe | 26 | 6.4 | 28 | 7.4 | 167 | 1840 | 25 | 33 | 8.3 | 4.4 |
| Hg | 80 | 10.0 | 4.4 | 7.8 | 946 | 5610 | 112 | 38 | 2.2 | 2.3 |
| Pb | 82 | 10.6 | 4.3 | 8.5 | 1221 | n.d. | 107 | 35 | 1.8 | n.d. |
The spectra acquired at the synchrotron sources by means of the SDDs at DESY and the Maia detector at NSLS also show significant differences in performance. While the sensitivities obtained with the Maia detector are consistently a factor of 6–10 times higher than with SDDs, the XRF spectrum of NIST SRM 611 acquired with the Maia detector (see Fig. 4) appears less well resolved. This is due to its limited energy resolution (320 eV) compared to that of 170 eV for the SDDs (energy resolution calculated as Full-Width-at-Half-Maximum (FWHM) of the Mn-Kα line (5.9 keV)). The limited energy resolution of the Maia detector is also the reason why the difference to the SDD based scanner in terms of LODs is less than one would expect from the difference in sensitivity, as the background intensity below each peak is considerably larger.
Due to the limited energy resolution of the Maia system it is difficult to accurately determine the intensity of fluorescence lines of minor components adjacent to much stronger peaks. Since this is the case in the mock-up painting, where vermilion is a minor component in a lead white matrix, during the measurements at NSLS, the Hg-Lα/Pb-Lα spectral interference was eliminated by employing a primary energy of 12.7 keV, i.e., just under the Pb-L3 edge and so too low to excite any Pb L-level fluorescence radiation.
When comparing the curves of Fig. 5a and b and the values in Table 1, it is evident that up to Ti (Z = 22), the laboratory setup and the synchrotron setups yield roughly comparable results. This is due to the fact that in both synchrotron based scanners monochromatic radiation of 12.7 keV (Maia), resp. 32 keV (DESY) was employed, which is inefficient at exciting low-Z elements that have a considerably lower absorption edge. Thus, in the low Z-range, all scanners feature a sensitivity of below 100 cps per mg g−1.
For higher Z elements (having more energetic fluorescence radiation), however, the performance differs considerably. For example, although for Fe the sensitivities differ by a factor of only 1:6:65 (mobile scanner:DESY(SDDs):NSLS (Maia)) for heavier elements the sensitivities of the SR-based setups are a factor 10 to 100 higher than that of the X-ray tube based setups. The difference in sensitivity for K-lines rises up to a factor of roughly 10000 for Sn (X-ray tube based scanner with collimator compared to the DESY SDD scanner). The performance of the DESY SDD scanner should be considered in light of the fact that the high energy of the primary beam at DESY (32 keV) was chosen to penetrate deeper into the painting and excite the deeper paint layers more efficiently. A lower energetic primary beam would have been considerably more efficient at exciting the elements discussed to emit fluorescence radiation.
The ability to collect images at higher resolution and/or speed than with a tube-based scanner represents a significant advantage of synchrotron based systems that, in certain cases, may justify the additional risks associated with taking a painting to a synchrotron for study.
Scan of entire painting
Due to the higher efficiency of the Maia detector, nearly the entire painting could be scanned using the NSLS scanner in almost half the time necessary to scan just the facial area using the DESY scanner. The resulting Ca, Fe and Hg maps of the central part of the mock-up painting scanned with the NSLS scanner are shown in Fig. 6.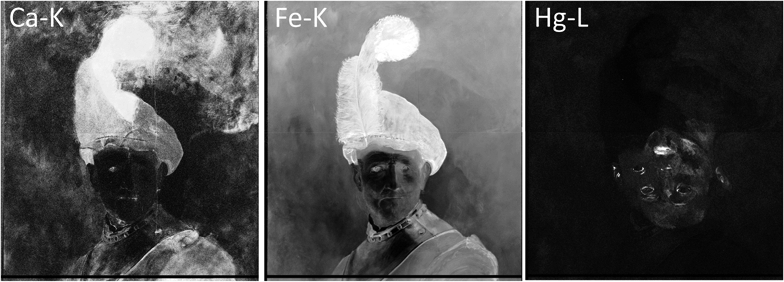 | ||
| Fig. 6 Ca, Fe, and Hg distribution images obtained by means of the NSLS scanner. The entire central area (ca. 56 cm high × 50 cm wide) of the mock-up was scanned in 24 hours. | ||
In the Ca and Fe distribution images the surface portrait is easy to recognize. In the Hg-L distribution image the hidden portrait is well visible.
The robe of the hidden portrait is visible in the Ca-K distribution map (and to a less extent the Fe-K distribution map) due to the inclusion of these elements in the pigments used to paint the robe. Additional Ca and Fe fluorescence radiation also originates from lower paint layers in areas with less absorbing covering layers, i.e., layers with a lower lead white content. This is especially visible in the feather of the final portrait and contributes to the heterogeneous appearance of the background in the Ca and Fe distribution image.
Scans of facial area
The element distribution maps for Ca-K, Fe-K and Hg-L in the facial area of the painting acquired using each of the three scanners are shown in Fig. 7. Pb-L lines could not be excited by the NSLS scanner because of the decision to use an excitation energy of 12.7 keV in order to avoid Hg-L/Pb-L interferences. These are severe in the case of the Maia detector in view of its limited energy resolution. The Pb-M (2.5 keV) lines were not detectable due to the low response of the Maia detector in this energy region. The images were recorded at different lateral resolutions from 0.25 mm per pixel (NSLS) over 0.5 mm per pixel (DESY) to 1.0 mm per pixel (mobile scanner).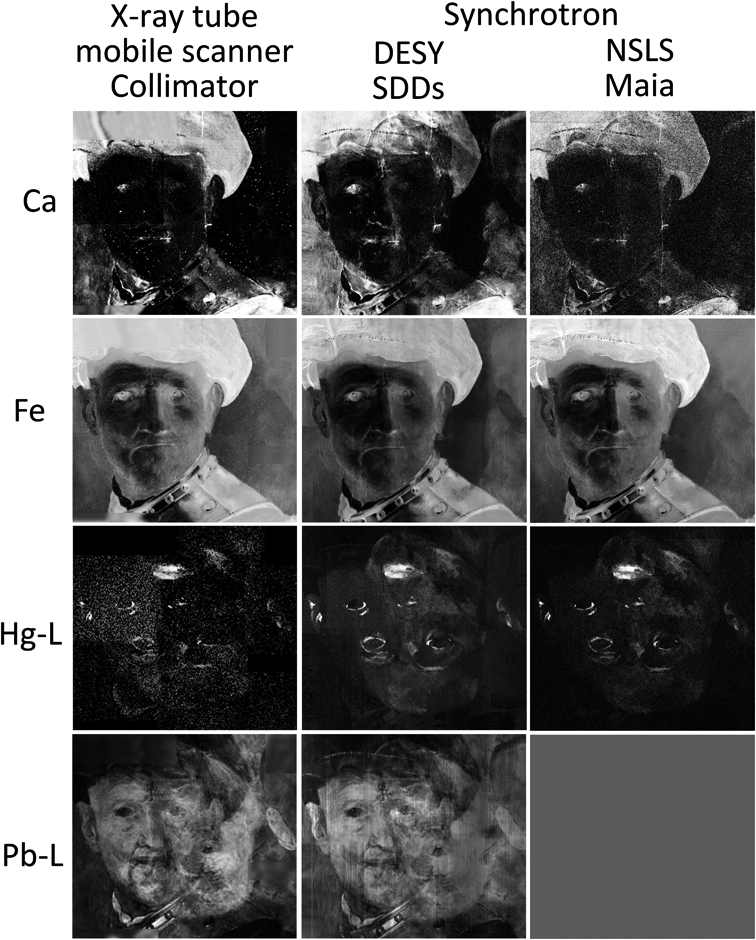 | ||
| Fig. 7 Elemental maps (ca. 25 × 23 cm2) of Ca, Fe, Hg and Pb. Pb was not excited by means of the NSLS scanner. The images were recorded at different lateral resolutions from 0.25 mm per pixel (NSLS) over 0.5 mm per pixel (DESY) to 1.0 mm per pixel (mobile scanner). | ||
All three Ca-K distribution maps seem rather noisy, due to the fact that all the scanners have relatively low sensitivities in this energy region. In the Ca maps obtained using the X-ray tube and NSLS scanners, no indications of the hidden portrait are apparent and nearly all Ca that is detected can be attributed to features in the upper portrait. By contrast, in the Ca map obtained using the DESY scanner, the face in the hidden portrait is visible as a silhouette, due to the same shielding mechanism discussed in the previous section for the NSLS Maia system.
The Fe distribution maps from all three scanners similarly appear to be dominated by the final portrait, although a faint outline of the hidden figure's face also is evident in each, due to the greater concentration of Fe in the background areas of the underlying portrait than in the face. The outline of the underlying portrait is most clearly discernible in the map obtained with the DESY scanner; the high-energy synchrotron beam can efficiently penetrate through the upper paint layers and provide increased contrast.
This increased contrast is also noticeable in the Pb-L maps, where even the wood grain is visible. This is due to the varying thickness of the Pb-containing imprimatura that follows the surface structure of the ground layer, which itself follows the slight undulations of the wood grain. Because the face of the underlying portrait was painted using the strongly X-ray absorbing pigment lead white, the Pb distribution maps provide information most directly comparable to that of the X-ray radiographs (Fig. 1b and h). Again the Pb-map obtained with the DESY scanner features a better contrast than that obtained by the X-ray tube based scanner.
The Hg-L maps obtained by both synchrotron-based scanners are of comparable quality, with quite a few details of the face of the hidden portrait visible: the eyes, ear and lips can be discerned and it is possible to follow the contour of the face, especially of the chin. Unfortunately the results obtained in the laboratory with the tube-based scanner are far noisier. Areas of high Hg abundance in both portraits can be identified and imaged, but the general shape of the face, clearly visible in the other Hg maps, is not apparent.
Detailed scans
As indicated in Fig. 1g, one area containing the lips of the hidden portrait was selected for more detailed investigations by means of the tube-based and DESY scanners. For comparison, although detailed scans were not conducted using the Maia equipped NSLS scanner, these same areas from the full painting scans (Fig. 6) are reproduced in these figures.Generally, these images are consistent with the findings from the larger scans. While the Fe and Pb distribution maps of the lips of the hidden portrait (Fig. 8) acquired using the tube-based and DESY scanners are of comparable quality, the Hg-L distribution map obtained at DESY is clearer and more detailed, reproducing even single brushstrokes. The distributions acquired by the NSLS scanner seem inferior, but it has to be kept in mind that they were acquired at 40 times the pace of the investigation at DESY.
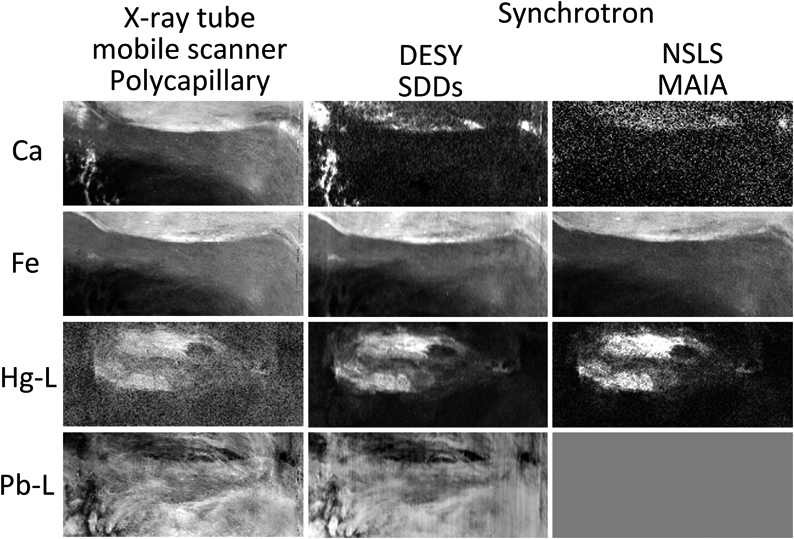 | ||
| Fig. 8 Detailed scan of the lips of the hidden portrait. Obtained by means of the DESY scanner: 300 μm step size, 0.7 s dwell time per pixel. NSLS Scanner: 250 μm step size, 0.018 s dwell time per pixel and mobile scanner with polycapillary optic: 300 μm step size, 14 s live time per pixel. | ||
The Ca distribution map of the lips obtained with the tube-based scanner equipped with a polycapillary optic is clearer and more detailed than the map obtained by means of either of the synchrotron scanners. Although the tube-based scanner with the polycapillary optic has a similar sensitivity to Ca as the DESY scanner (as discussed above), because a dwell time of 20 times longer was used, the resulting image is superior. Of all the systems tested, the NSLS scanner has the highest sensitivity for Ca, but the extremely short dwell time per pixel (0.018 s) used in order to allow the entire painting to be scanned, resulted in the generation of a very noisy distribution map.
Conclusions
MA-XRF imaging of a full scale and materially accurate mock-up of a painting by Rembrandt van Rijn's called An Old Man in Military Costume using three different MA-XRF scanners was conducted in order to (a) determine the best analytical protocol by which the original painting may be studied to reveal the hidden portrait, and (b) compare the performance of a X-ray tube-based mobile MA-XRF scanner and two synchrotron-based scanners, one equipped with multiple silicon drift detectors and the other with a prototype of the Maia detector.The differences in performance between the three scanners are illustrated via the comparison of the element distributions of Ca, Fe, Hg and Pb acquired from the mock-up painting and their spectroscopic figures of merit. While the Fe distribution images obtained by all three scanners are comparable, the Ca image obtained using the X-ray tube based scanner with the polycapillary optic is superior to that of the synchrotron scanners, as the slightly lower sensitivity is more than overcompensated for by the longer dwell time per point employed by the mobile scanner.
For heavy elements of interest in paintings, in particular Hg and Pb, the synchrotron based scanners have a more than hundred times higher sensitivity than the tube-based scanner. This increased sensitivity permits the use of much shorter acquisition times and smaller step sizes yielding increased resolution and contrast. While the synchrotron based scanners could image the face of the hidden portrait in great detail, the elemental maps acquired by the mobile scanners only showed the Hg-rich hot spots and did not allow a detailed image of the hidden face to be acquired. To our knowledge, MA-XRF is the only method by means of which this level of detail can be achieved.
In contrast, the Pb distribution maps obtained with the DESY and mobile scanners are comparable in quality, since the higher abundance of Pb compensates the difference in sensitivity; comparable data for Pb from the NSLS scanner was not available. The tunable monochromatic primary beam of the synchrotron based scanners offers the additional advantage of permitting selective excitation of specific elements. However, the inferior energy resolution of the Maia based NSLS scanner made it necessary to use a primary energy below the Pb-L3 edge, and thus limited the number of detectable elements considerably. Differences in sensitivity notwithstanding, the applicability of the tube-based scanner for these studies also was limited by the reach of the motorized stage.
It has to be pointed out that, as expected, no visible alteration in the painting due to beam damage was observed; this and similar experiments suggest that upon exposure to a monochromatic synchrotron beam of up to several minutes, a spot on the surface of an historical painting shows no signs of alteration.
On the basis of the above observations it is therefore possible to respond in the following manner to the research questions formulated earlier:
(1) It is our expectation that by means of either the DESY or the NSLS MA-XRF scanner, it will be possible to obtain a more detailed visualization of the hidden layers beneath the surface of An Old Man in Military Costume than what is currently possible with a combination of XRR and IRR and that it should be possible to obtain a fairly complete/a highly ‘readable’ image of the face of the person in the hidden representation.
(2) Transporting the Rembrandt panel from the P.J. Getty Museum to a (nearby) synchrotron facility for a MA-XRF investigation should therefore be a useful and relevant activity to undertake.
Even though, a priori it cannot be excluded that heavy reworking above the hidden face might make the elemental distribution image of Hg as difficult to read as the current radiography, ultimately, such element distribution information, when recorded from the original Rembrandt painting, is expected to provide scholars with new information to evaluate how the hidden portrait fits within Rembrandt's oeuvre.
Finally, on the instrumental level, it is relevant to note that all the scanners used in this study are/were prototypes, and predecessors of future instruments with improved capabilities. The scanner at NSLS was especially hindered by the fact that the intensity of the primary beam at beamline X-7 was rather low. An advanced version of this scanner, utilizing a brighter source with improved monochromator and optics, coupled with the final version of the Maia detector which will have 384 detector elements, is expected to have its sensitivity increased by at least a factor of 50. A similar set-up has been recently described,9 allowing for a very fast imaging of elements heavier than Ca, in the case that no strong interferences between fluorescence lines occur.
Following the above comparison, it was possible to improve the DESY scanner by repositioning the SDDs in a tighter geometry and thus yielding a high solid angle and enhancing the sensitivity by 30%, constituting a scanner that can detect the widest range of elements of the scanners discussed here. Due to its better energy resolution, spectral interferences are more easily resolved than in the NSLS scanner and the number of elements that can be studied in parallel is thus enhanced. This improved scanner has been described elsewhere.6
The tube-based scanner used for the studies presented here was not capable of imaging the complete face of the hidden portrait. Also in this case, the above comparison was the inspiration for the development of a more advanced version of this scanner (described in ref. 12), with a maximum scan area of 1500 cm2, a more powerful tube, multiple detectors and faster detector electronics that has a sensitivity fifty times greater than the tube-based scanner described in this paper. This allows the mobile scanner to obtain performance characteristics competitive with the synchrotron scanners for many elements. Although a tube-based scanner will probably never be able to reach the sensitivity of a synchrotron-based scanner, its mobility, allowing in situ investigations, is considered to compensate for the longer measurement times necessary. We expect that in the future routine investigations will be executed with mobile instruments, while synchrotron scanners will be limited to cases demanding in terms of resolution or sensitivity.
The examination of works of art is important for their understanding, interpretation, and preservation. Any analyses that can be performed without having to remove samples or otherwise alter the work of art are strongly preferred. We consider that the results presented here, along with other recent advances in MA-XRF imaging, represent a significant advancement in the ability to extract detailed information regarding the composition and, perhaps more importantly, the form of painted images in buried paint layers.
Acknowledgements
This research was supported by the Interuniversity Attraction Poles Programme – Belgian Science Policy (IUAP VI/16). The text also presents results of GOA “XANES meets ELNES” (Research Fund University of Antwerp, Belgium) and from FWO (Brussels, Belgium) projects no. G.0704.08 and G.01769.09. Further, the research leading to these results has received funding from the European Community's Seventh Framework Programme (FP7/2007-2013) under grant agreement n° 226716. M. Alfeld receives a Ph.D. fellowship of the Research Foundation – Flanders (FWO). The authors gratefully acknowledge Yvonne Szafran and the staff of the Paintings Conservation Department of the J. Paul Getty Museum for making available their infrared reflectography (IRR) and X-radiographic images of the painting, and also the neutron activation analysis (NAA) images acquired in 1996 at NIST by Dr Henry Prask in collaboration with Mark Leonard, former head of the J. Paul Getty Museum Paintings Conservation Department. We are also grateful to Peter Reischig, a graduate intern at the Getty Conservation Institute and a Ph.D. candidate at Delft University of Technology for his assistance.Notes and references
- Microscopic X-ray Fluorescence Analysis, ed. K. Janssens, F. Adams and A. Rindby, Wiley, Chichester, 2000 Search PubMed.
- K. Janssens, J. Dik, M. Cotte and J. Susini, Acc. Chem. Res., 2010, 43, 814–825 CrossRef CAS.
- J. Dik, K. Janssens, G. Van der Snickt, L. van der Loeff, K. Rickers and M. Cotte, Anal. Chem., 2008, 80, 6436–6442 CrossRef CAS.
- J. Dik, K. Janssens, M. Alfeld, K. Rickers and E. van de Wetering, in Nouveau Regard Sur Rembrandt, ed. E. v. d. Wetering, Local World BV, Amsterdam, The Netherlands, 2010, pp. xx–xxiv Search PubMed.
- P. Noble, A. van Loon, M. Alfeld, K. Janssens and J. Dik, Technè, 2012, 35, 36–45 Search PubMed.
- M. Alfeld, K. Janssens, K. Appel, B. Thijsse, J. Blaas and J. Dik, Zeitschrift fur Kunsttechnologie und Konservierung, 2011, 25, 157–163 Search PubMed.
- D. Bull, A. Krekeler, M. Alfeld, J. Dik and K. Janssens, The Burlington Magazine, 2011, vol. 153, pp. 668–673 Search PubMed.
- J. L. Mass and C. Bisulca, Antiques and Fine Art, 2010, Summer/Autumn, 222–223 Search PubMed.
- D. L. Howard, M. D. de Jonge, D. Lau, D. Hay, M. Varcoe-Cocks, C. G. Ryan, R. Kirkham, G. Moorhead, D. Paterson and D. Thurrowgood, Anal. Chem., 2012, 84, 3278–3286 CrossRef CAS.
- F.-P. Hocquet, H.-P. Garnir, A. Marchal, M. Clar, C. Oger and D. Strivay, X-Ray Spectrom., 2008, 37, 304–308 CrossRef CAS.
- F.-P. Hocquet, H. C. del Castillo, A. C. Xicotencatl, C. Bourgeois, C. Oger, A. Marchal, M. Clar, S. Rakkaa, E. Micha and D. Strivay, Anal. Bioanal. Chem., 2011, 399, 3109–3116 CrossRef CAS.
- M. Alfeld, K. Janssens, J. Dik, W. de Nolf and G. van der Snickt, J. Anal. At. Spectrom., 2011, 26, 899–909 RSC.
- H. Bronk, S. Röhrs, A. Bjeoumikhov, N. Langhoff, J. Schmalz, R. Wedell, H.-E. Gorny, A. Herold and U. Waldschläger, Fresenius' J. Anal. Chem., 2001, 371, 307–316 CrossRef CAS.
- K. Trentelman, M. Bouchard, M. Ganio, C. Namowicz, C. S. Patterson and M. Walton, X-Ray Spectrom., 2010, 39, 159–166 CrossRef CAS.
- An Old Man in Military Costume, http://www.getty.edu/art/gettyguide/artObjectDetails?artobj=787, accessed 10/07/11.
- C. G. Ryan, D. P. Siddons, R. Kirkham, P. A. Duun, A. Kuczewski, G. Moorhead, G. De Geronimo, D. J. Paterson, M. D. de Jonge, R. M. Hough, M. J. Lintern, D. L. Howard, P. Kappen and J. Cleverley, AIP Conf. Proc., 2010, 1221, 9–17 CrossRef CAS.
- R. Kirkham, P. A. Dunn, A. J. Kuczewski, D. P. Siddons, R. Dodanwela, G. F. Moorhead, C. G. Ryan, G. De Geronimo, R. Beuttenmuller, D. Pinelli, M. Pfeffer, P. Davey, M. Jensen, D. J. Paterson, M. D. de Jonge, D. L. Howard, M. Küsel and J. McKinlay, AIP Conf. Proc., 2010, 1234, 240–243 CrossRef CAS.
- B. Vekemans, K. Janssens, L. Vincze, F. Adams and P. Van Espen, X-Ray Spectrom., 1994, 23, 278–285 CrossRef CAS.
- C. G. Ryan, D. R. Cousens, S. H. Sie, W. L. Griffin, G. F. Suter and E. Clayton, Nucl. Instrum. Methods Phys. Res., Sect. B, 1990, 47, 55–71 CrossRef.
- C. G. Ryan, B. E. Etschmann, S. Vogt, J. Maser, C. L. Harland, E. van Achterbergh and D. Legnini, Nucl. Instrum. Methods Phys. Res., Sect. B, 2005, 231, 183–188 CrossRef CAS.
- V. A. Sole, E. Papillon, M. Cotte, P. Walter and J. Susini, Spectrochim. Acta, Part B, 2007, 62, 63–68 CrossRef.
- N. J. G. Pearce, W. T. Perkins, J. A. Westgate, M. P. Gorton, S. E. Jackson, C. R. Neal and S. P. Chenery, Geostand. Newsl., 1997, 21, 115–144 CrossRef CAS.
- Handbook of X-ray Spectrometry, ed. R. E. Van Grieken and A. A. Markowicz, Marcel Dekker, Inc., New York, 2002 Search PubMed.
- H. Ebel, X-Ray Spectrom., 1999, 28, 255–266 CrossRef CAS.
- A. Brunetti, M. Sanchez del Rio, B. Golosio, A. Simionovici and A. Somogyi, Spectrochim. Acta, Part B, 2004, 59, 1725–1731 CrossRef.
- T. Schoonjans, A. Brunetti, B. Golosio, M. Sanchez del Rio, V. A. Sole, C. Ferrero and L. Vincze, Spectrochim. Acta, Part B, 2011, 66, 776–784 CrossRef CAS.
Footnotes |
| † Electronic supplementary information (ESI) available. See DOI: 10.1039/c2ja30119a |
| ‡ Current address: Kunstmuseum Wolfsburg, Hollerplatz 1, 38440 Wolfsburg, Germany. |
| This journal is © The Royal Society of Chemistry 2013 |