 Open Access Article
Revisiting the Brønsted acid catalysed hydrolysis kinetics of polymeric carbohydrates in ionic liquids by in situ ATR-FTIR spectroscopy†
Andreas J. Kunov-Kruse*a,
Anders Riisager*a,
Shunmugavel Saravanamurugana,
Rolf W. Bergb,
Steffen B. Kristensena and
Rasmus Fehrmanna
aCentre for Catalysis and Sustainable Chemistry, Department of Chemistry, Building 207, DK-2800 Kgs. Lyngby, Technical University of Denmark, Denmark. E-mail: ar@kemi.dtu.dk; ajoku@kemi.dtu.dk; Fax: +45 45883136; Tel: +45 45252390 Tel: +45 45252233
bDepartment of Chemistry, Building 207, DK-2800 Kgs. Lyngby, Technical University of Denmark, Denmark
First published on 22nd July 2013
Abstract
A new versatile method to measure rates and determine activation energies for the Brønsted acid catalysed hydrolysis of cellulose and cellobiose (and other polymeric carbohydrates) in ionic liquids is demonstrated by following the C–O stretching band of the glycoside bond with in situ ATR-FTIR. An activation energy in excellent agreement with the literature was determined for cellulose hydrolysis, whereas a distinctly lower activation energy was determined for cellobiose hydrolysis. The methodology also allowed to independently determine activation energies for the formation of 5-hydroxymethylfurfural in the systems.
Introduction
The demand for substituting the petroleum products used today with biomass derived chemicals and fuels is continuously increasing.1,2 Extensive effort has in particular been put into developing systems based on the furanic platform, which are able to provide a diverse range of products.3–5 However, the initial production of 5-hydroxymethylfurfural (HMF) is in most cases focused on applying sugars such as fructose and glucose, which are derived from corn, starch sugar canes or other edible resources.6 These resources are far from unlimited, and in a longer term perspective such processes must apply lignocellulosic materials instead, which are available in surplus from various agricultural processes and waste streams. However, there still needs to be a breakthrough in the conversion technologies of cellulose into sugars to make this approach competitive to food crops.The acid catalysed hydrolysis of cellulose in ionic liquids has been attracting immense interest in the last decade since Rogers and co-workers7 discovered that some ionic liquids are able to dissolve cellulose. The dissolution of cellulose makes the glycoside bond more susceptible to attack by a catalyst than if the crystalline fibres are just suspended in a heterogeneous mixture. Most studies concerned with the hydrolysis of cellulose in ionic liquids in the presence of homogeneous or heterogeneous acid catalysts have focused on the product distribution after hydrolysis8–10 and paid less attention to the hydrolysis kinetics. However, an interesting effect of dissolving cellulose in ionic liquids is that the mechanism of hydrolysis seems to be altered as studies of the hydrolysis kinetics in ionic liquids report lower activation energies than normally observed in water.11–13 Generally, the apparent activation energy observed for acid cellulose hydrolysis and its oligomers in water is relatively high around 120–130 kJ mol−1.14 The high activation energy is induced by an unfavourable oxocarbenium ion which has considerably higher energy than observed for oxocarbenium ions in general, because the pyranose ring structure prevents the preferred planar geometry around the C![[double bond, length as m-dash]](https://www.rsc.org/images/entities/char_e001.gif) O+ group (activation energies of simple acetals are only of the order of 50–60 kJ mol−1).15,16 In ionic liquids the strongly ionic environment may stabilise the positive charge of the oxocarbenium ion and thus lower its energy.13 This is supported by the finding that the hydrolysis rate of the glucoside bond in water–1,4-dioxane mixtures is significantly enhanced in the presence of chloride and bromide ions.17
O+ group (activation energies of simple acetals are only of the order of 50–60 kJ mol−1).15,16 In ionic liquids the strongly ionic environment may stabilise the positive charge of the oxocarbenium ion and thus lower its energy.13 This is supported by the finding that the hydrolysis rate of the glucoside bond in water–1,4-dioxane mixtures is significantly enhanced in the presence of chloride and bromide ions.17
Cellulose and short chain cellulose oligomers are insoluble in conventional solvents. This makes it very challenging to estimate the initial reaction rate of hydrolysis by conventional analytical methods. Furthermore, analytical techniques dealing with the analysis of all the hydrolysis products, including long chain oligomers, are very laborious.11 Analysis is further complicated by the formation of secondary products, as acid catalysts are active in glucose dehydration to, e.g., HMF and levulinic acid.13 Such reactions occur simultaneously with hydrolysis and at considerable rates, making the produced glucose an unsuitable measure of the hydrolysis rate. Since the activation energies for cellulose hydrolysis and glucose dehydration by Brønsted acids are similar,18,19 methods solely taking the produced glucose into account, and not the products produced hereof, are thus likely to underestimate the actual hydrolysis rate and thus overestimate the activation energy.
In this work we introduce a new approach to measure the hydrolysis kinetics of cellulose. Hence, instead of monitoring the formation of hydrolysis products, the disappearance of glycoside bonds is followed during hydrolysis by in situ ATR-FTIR in a specially designed stirred micro reactor.20
Results and discussion
Initially, we performed a thorough investigation of vibrational modes in cellulose using DFT model calculations (B3LYP/6-311+G(d,p)) (ESI, Fig. S10†) to identify quantifiable bands. Among several new IR-active modes that are characteristic of the glucose moieties in cellulose, we were able to locate the position of the two group vibrations comprising C–O–C stretching vibrations at around 1165–1155 and 965–975 cm−1 (anti-symmetric and symmetric modes, respectively; see ESI, Table S2†) in very good agreement with interpretations found in the literature.21–30 The modes are schematically shown in Scheme 1.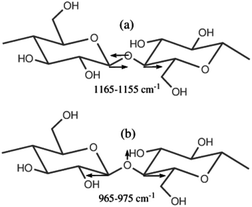 | ||
| Scheme 1 Schematic representation of the two characteristic anti-symmetric (a) and symmetric (b) vibrations of the glycoside bond. | ||
When using the popular ionic liquids 1-butyl-3-methylimidazolium chloride and 1-ethyl-3-methylimidazolium chloride ([BMIm]Cl and [EMIm]Cl) as solvents for the hydrolysis, it was only possible to follow the time evolution of the very weak symmetric stretching mode at 965 cm−1. Moreover, the 1160 cm−1 band was here unsuited for accurate quantitative measurements due to overlap with a very strong mode comprising the bending of the C2–H proton on the [BMIM]+ cation. However, this C–H bending mode disappeared when the hydrogen in the C2 position was substituted with a methyl group, thus allowing quantitative analysis via the intense band due to anti-symmetric stretching of the glycoside bond (ESI, Fig. S15†). The ionic liquid 1-butyl-2,3-dimethylimidazolium chloride ([BDMIm]Cl) was accordingly chosen for the kinetic experiments.
Time-resolved difference spectra measured for the sulfuric acid catalysed hydrolysis of Avicel cellulose in [BDMIm]Cl are shown in Fig. 1. Notably, the spectra reflect the total change in the composition during hydrolysis and show thus a mixture of disappearing bands for both cellulose and glucose as the reaction proceeds. Therefore, care must be taken when a quantitative interpretation is done because the pyranose backbone of the cellulose chains show many similarities with glucose and several of the types of vibrational bands are found in the spectra of both structures (see ESI, Table S2 and Fig. S19†).
![Corrected ATR-FTIR difference spectra recorded during the first 30 min of sulfuric acid catalysed hydrolysis of Avicel cellulose in [BDMIm]Cl at 120 °C. The symmetric and anti-symmetric glucoside C–O–C stretching bands are highlighted with boxes. The insert shows the 1800–1600 cm−1 range (full region spectra can be found in ESI, Fig. S20–S22).](/image/article/2013/GC/c3gc41174e/c3gc41174e-f1.gif) | ||
| Fig. 1 Corrected ATR-FTIR difference spectra recorded during the first 30 min of sulfuric acid catalysed hydrolysis of Avicel cellulose in [BDMIm]Cl at 120 °C. The symmetric and anti-symmetric glucoside C–O–C stretching bands are highlighted with boxes. The insert shows the 1800–1600 cm−1 range (full region spectra can be found in ESI, Fig. S20–S22†). | ||
For the polymeric glucose species the introduction of acetal groups with the glycoside bonding creates several modes involving deformation around the oxygen atom inside the pyranose. Consequently, new strong bands from C–O–C stretching in the pyranose ring and new C–C stretching and C–H bending modes were found in the cellulose spectrum around 1070–1060 cm−1. The intensities of these bands decreased markedly during the hydrolysis of cellulose, and indeed these bands initially showed a linear decrease as a function of time that possibly could be used to determine the initial rates (ESI, Fig. S8†). However, glucose also had intense bands in the same region. Therefore, these bands were unsuitable for quantitative analysis, as they expressed an unknown fraction of the hydrolysis rate of both cellulose and glucose (an elaborate discussion follows later). The anti-symmetric stretching of the glycoside bond has a relatively strong absorption band at around 1155–1160 cm−1, which is found in cellulose and in cellulose oligomers including the dimer cellobiose (ESI, Fig. S18†). The spectra of glucose showed an intense band at around 1140 cm−1 probably due to C1–O1 bond stretching and bending of C1–H and O1–H bonds, whereas cellulose and the cellulose oligomers showed only a weak absorption band. These bands can thus easily be distinguished and quantified by deconvolution of the ATR-corrected difference spectra. No general linear time dependence of the area of the 1140 cm−1 band was observed during the experiments. The difference between these bands was further confirmed by experimental spectra of cellulose oligomers, which all showed that the C–O–C stretching band was only present in the polymeric species (ESI, Fig. S18†).
Knowledge about the kinetics of cellulose hydrolysis in ionic liquids is quite limited due to the earlier mentioned analytical difficulties, although some activation energies of cellulose hydrolysis in ionic liquids catalysed by strong mineral acids or similar systems have been reported.12,13 Here, we firstly investigated the hydrolysis using sulfuric acid as a catalyst to allow direct comparison of the kinetics obtained by the in situ FTIR method to kinetics derived from studies using more conventional analytical methods. The cellulose hydrolysis was investigated in situ in [BDMIm]Cl from 90 to 140 °C in steps of 10 °C using 1.7 wt% sulfuric acid catalyst. The small volume of the stirred detachable micro reactor ensured fast heating and equilibration of the cooled premixed reaction mixture.
In the IR spectra a slight increase of the intensity of the 1157 cm−1 band was initially observed at the set temperatures, probably due to incomplete dissolution of the cellulose (see the development in ESI, Fig. S1†). However, within a short time period a steady decrease of the band was measured for all the temperatures allowing first the initial rates to be determined by integration of the 1157 cm−1 band of the deconvoluted spectra and, secondly, the initial rates (expressed as absorbance per second) to be established with high accuracy from the in situ experiments (ESI, Fig. S1 and Table S1†). A plot of ln(abs) as a function of time confirmed that the reaction was first order in concentration of glucoside bonds, as expected (ESI, Fig. S3†). In Fig. 2 the experimentally determined rate constants for the hydrolysis are plotted in an Arrhenius plot as ln(−k) against 1/T. From the rate constants (first order with respect to catalyst concentration) the activation energy for the hydrolysis of cellulose with sulfuric acid was determined to be 96.4 ± 4.1 kJ mol−1, which is in excellent agreement with recent values of 92–96 kJ mol−1 reported for analogous cellulose hydrolysis in [EMIm]Cl.12,13
 | ||
| Fig. 2 Arrhenius plot showing the temperature dependence of the initial rates for cellulose and cellobiose hydrolysis with the sulfuric acid catalyst. | ||
Cellobiose is often used as a model for cellulose when modelling cellulose hydrolysis, due to simplicity and the comparative higher solubility of cellobiose in many solvents.12 Accordingly, we also investigated cellobiose hydrolysis under the same conditions as described for cellulose above (Fig. 3 and ESI Fig. S2 and S3†). Notably, we found here the apparent activation energy for cellobiose hydrolysis to be 69.6 ± 3.0 kJ mol−1, which is significantly lower than for cellulose. In the earlier work using [EMIm]Cl the activation energy for cellobiose hydrolysis was not reported, but it was observed that the hydrolysis rate of cellobiose was first order with respect to the concentration of glucoside bonds and indeed significantly faster than for cellulose.12,13 This directly supports our finding of a lower activation energy, even though the nature of the glucoside bonds of cellobiose and cellulose are rather similar, as also indicated by our DFT calculations.
![Corrected ATR-FTIR difference spectra recorded during the first 15 min of sulfuric acid catalysed hydrolysis of cellobiose in [BDMIm]Cl at 120 °C. The symmetric and anti-symmetric glucoside C–O–C stretching bands are highlighted with boxes. The insert shows the 1800–1600 cm−1 range (full region spectra can be found in ESI, Fig. S23–S25).](/image/article/2013/GC/c3gc41174e/c3gc41174e-f3.gif) | ||
| Fig. 3 Corrected ATR-FTIR difference spectra recorded during the first 15 min of sulfuric acid catalysed hydrolysis of cellobiose in [BDMIm]Cl at 120 °C. The symmetric and anti-symmetric glucoside C–O–C stretching bands are highlighted with boxes. The insert shows the 1800–1600 cm−1 range (full region spectra can be found in ESI, Fig. S23–S25†). | ||
A recent theoretical study on cellobiose hydrolysis suggests the high energy transition state to be associated with distortion of the stable chair conformation, when the protonated glucoside bond is split into glucose and the oxocarbenium ion.31 In the transition state the two glucose units are orientated in a 90 degree angle, which is possible due to flexibility of both glucose units in the cellobiose dimer around the glycoside bond.32 This conformation allows the structure to rearrange so the reaction barrier for hydrolysis is lowered. In contrast, the polymeric cellulose chain will in general not bend 90 degrees around each glucoside bond, and thus behave more rigidly with no possibility to undergo an analogous conformation change that can stabilise the transition state. The reason why the activation energies for hydrolysis of cellulose and cellobiose in water are still found to be similar seems to be an effect of poor stabilisation of the positive charge on the oxocarbenium ion. This effect can, however, be altered in a strongly ionic environment to lower the reaction barrier significantly.11–13,17 Hence our results suggest that the difference in magnitude of the reaction barrier for the hydrolysis of cellobiose and cellulose in ionic liquids is mainly caused by conformational effects.
A dehydration experiment with 10 wt% glucose in [BDMIm]Cl and 1.7 wt% sulfuric acid was performed to exclude that the observed decrease in intensity of the 1157 cm−1 band from cellobiose was due to simultaneous conversion of the formed glucose into HMF. Such a misinterpretation would namely increase the apparent rate and thus decrease the calculated activation energy. In addition, the experiment could corroborate that the observed intensity loss of the 1142 cm−1 band of glucose was distinguishable from the glycoside 1157 cm−1 band. From the results of the experiment it was clear that glucose was converted mainly into HMF and to a lower degree into carboxylic acids (increase of νCO bands at 1669 and 1705 cm−1, respectively; see the discussion below), and that the 1157 and 1142 cm−1 bands could easily be distinguished by deconvolution. Moreover, no absorption bands at 1157 cm−1 were observed in the difference spectra as otherwise seen in the difference spectra of cellulose and cellobiose (ESI, Fig. S9†). The experiment further showed that the strong vibration bands overlapping with the cellulose backbone at 1070–1060 cm−1 cannot be used for the kinetic analysis, since almost identical activation energies for the acid catalysed cellulose hydrolysis and the glucose dehydration to HMF18,19 result in an overall deceptive linear decrease. Examination of the spectra recorded during cellobiose hydrolysis at lower temperatures of 90 and 100 °C revealed that the contribution from the simultaneous dehydration to the glucose backbone vibration bands at 1140–970 cm−1 was significantly less pronounced. This strongly suggests that the cellobiose hydrolysis was faster than the subsequent glucose dehydration.
During the hydrolysis of cellulose an intense and sharp band at 1669 cm−1 appeared independently in the FT-IR spectra along with two broad bands at 1705 and 1623 cm−1, respectively. As mentioned above, the former band can be assigned to CO stretching from HMF being formed from the simultaneous glucose dehydration, while a related increase of the band at 1623 cm−1 corresponded to O–H bending from the water gradually being formed by the dehydration reaction. Similarly, the broad shoulder band at 1705 cm−1 was assigned to carboxylic CO stretching from formic acid and levulinic acid formed by the rehydration of HMF. Post-reaction analysis by HPLC (high-performance liquid chromatography) confirmed that glucose, HMF and carboxylic acids were the main products of the reaction (ESI, Fig. S11†). The rate of the HMF formation was determined by quantification of the carbonyl CO stretching band at 1669 cm−1 after deconvolution (ESI, Fig. S12 and Table S3†). Initially, a low rate was found until a steady glucose concentration was established from the hydrolysis reaction. Thereafter, the formation rate followed a pronounced first order kinetics (see ESI, Fig. S14†). When the rates were plotted in an Arrhenius plot (Fig. 4) the apparent activation energy for the HMF formation was determined to be 94.7 ± 3.7 kJ mol−1, which is remarkably close to the activation energy of 96.4 kJ mol−1 determined for the cellulose hydrolysis. However, we interpret this result as an indirect reproduction of the cellulose hydrolysis kinetics, and not as the actual activation energy for the acid catalysed dehydration of the formed glucose.
 | ||
| Fig. 4 Arrhenius plot showing the temperature dependence of the initial rates for HMF formation during hydrolysis of cellulose and cellobiose with the sulfuric acid catalyst. | ||
The quantification method was also applied for the HMF CO stretching band at 1669 cm−1 during cellobiose hydrolysis (Fig. 4). As expected, the initial rate indicated instant release of glucose from the hydrolysis of the glucoside bond in cellobiose (ESI, Fig. S13†), and the activation energy was determined from the initial rates to be 85.0 ± 1.8 kJ mol−1. This value is in perfect agreement with a recent value of 84.7 kJ mol−1 calculated from the reported data for glucose degradation in [EMIm]Cl.12 However, it is higher than the activation energy of 69.6 kJ mol−1 determined for the hydrolysis of the glucoside bond in cellobiose (vide supra), and resembles therefore more likely the actual activation energy for acid catalysed glucose dehydration in ionic liquids. This is further supported by the finding that the rate of HMF formation did not follow first order kinetics at longer reaction times. Instead the rate was here faster than predicted by a first order rate law (ESI, Fig. S14†), thus suggesting the glucose concentration to be regulated by a combination of fast first order kinetics of the hydrolysis of the glucoside bonds and slower first order kinetics of glucose isomerisation to form fructose, which generally is believed to be an essential step for HMF formation.5 The activation energy for Brønsted acid catalysed fructose dehydration in an analogous system with [BMIm]Cl has been determined to be as low as 62.2 kJ mol−1.33 The large difference in activation for dehydration of fructose and glucose is expected to facilitate dehydration of fructose to HMF in mixed systems. Hence, the absence of fructose in reaction samples analysed from ionic liquid glucose dehydration systems13 is most likely related to kinetics and not necessarily indicative of an alternative mechanism.
Conclusions
Time-resolved in situ ATR-FTIR spectroscopy has been introduced as a viable analytical tool to determine reaction rates and apparent activation energies for Brønsted acid catalysed hydrolysis of polymeric carbohydrates and simultaneous HMF formation from glucose in ionic liquids. The activation energy for hydrolysis of cellulose with sulfuric acid was experimentally found to be 96.4 ± 4.1 kJ mol−1, which is in excellent agreement with earlier reported activation energies. Notably, the activation energy determined for the analogous hydrolysis of cellobiose was significantly lower at 69.6 ± 3.0 kJ mol−1. In contrast, the apparent activation energy for HMF formation from glucose was determined to be 94.7 ± 3.7 and 85.0 ± 1.8 kJ mol−1 with cellulose and cellobiose, respectively. The study clearly emphasizes the limitations of using cellobiose as a model substrate for cellulose in kinetic studies.The work was performed within the framework of the Catalysis for Sustainable Energy initiative funded by the Danish Ministry of Science, Technology and Innovation.
Experimental and computational details
In situ ATR-FTIR spectroscopy
Cellulose (Avicel, Sigma-Aldrich) or 1,4-β-cellobiose (99%, Sigma-Aldrich) was dissolved in 1-butyl-2,3-dimethylimidazolium (95%, Sigma-Aldrich) at 120 °C under reduced pressure (10–15 mbar) by stirring for 2 h. One equivalent of water was then added and the solutions were equilibrated for 2 h at 90 °C. About 2 g of the ionic liquids with water were subsequently added to the appropriate catalyst at 60 °C, rapidly mixed with a spatula for 1 min and then freeze quenched in acetone/dry ice. The resulting solutions of cellulose and cellobiose were 10.0 and 10.6 wt%, respectively, thus containing almost identical concentrations of glucose monomers. A catalyst concentration of 1.7 wt% sulfuric acid (98%, Sigma-Aldrich) was used. The reaction mixtures were stored in a sealed glass container and cooled in dry ice prior to use.For the FT-IR measurements approximately 15 mg of the reaction mixture were loaded into a custom-made 25 μL glass reactor together with a small magnet rod. The reactor was applied on top of a preheated diamond ATR-plate and magnetically stirred by a commissioned device (Scheme 2). The spectra were recorded isothermally using a Nicolet iS5 spectrometer equipped with a thermo regulated (up to 300 °C) GladiATR diamond cell (Pike Technologies). For each recording 16–80 scans with 4 cm−1 resolution (approximately 15 s to 2 min recording time) were performed depending on the reaction rate. All spectra were background corrected by subtracting a constant under the assumption of zero absorbance at 4000 cm−1. Then the spectra were ATR corrected with a built-in algorithm in OMNIC 8.2 assuming a sample refractive index of 1.5. Difference spectra were produced by subtracting a spectrum corresponding to the pseudo steady state from each spectrum before analysis (ESI, Fig. S4–S7, S22 and S25†), and deconvoluted with PeakFit using the built-in Voigt area approximation algorithm (ESI, Fig. S17†). The reaction rates of the hydrolysis reactions were determined on the basis of the area of the band at 1157 cm−1 in the deconvoluted spectra (ESI, Fig. S1 and S2† for hydrolysis and Fig. S12 and S13† for HMF formation).
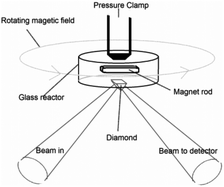 | ||
| Scheme 2 Schematic drawing of the stirred micro reactor used for the in situ ATR-FTIR experiments.20 | ||
Reference spectra of cellulose oligomers were recorded on powder samples with cellotriose, cellotetraose and cellopentaose (Megazymes) (ESI, Fig. S18†).
HPLC analysis
After hydrolysis of the cellulose with sulfuric acid, spot checks (100 and 120 °C) were performed on the reaction mixtures to confirm the presence of glucose and HMF. The reaction mixtures were analysed by HPLC with RI detection (Agilent 1200 series, 30 cm Aminex© HPX-87H column, 0.005 M H2SO4 in MilliQ water as an eluent at a flow rate of 0.6 mL min−1). The formed products (glucose, HMF, levulinic acid and formic acid) were identified by comparison with retention times of individual reference samples.Calculation of theoretical IR spectra
DFT calculations were performed with Gaussian0934 software using a starting structure adopted from an experimentally determined crystal structure.35 Initially, the structure was optimized with Hartree–Fock and the 6-31G(d) basis set and then refined with DFT using the B3LYP functional and the 6-311+G(d,p) basis set (ESI, structures are shown in Fig. S10† and the interpretation of the spectra in Table S2†).The theoretical spectra that are found in ESI, Fig. S19† are normalized with respect to the number of glucose units in the structure.
Notes and references
- J. J. Bozell, Science, 2010, 329, 522–523 CrossRef CAS.
- D. M. Alonso, J. Q. Bond and J. A. Dumesic, Green Chem., 2010, 12, 1493–1513 RSC.
- A. A. Rosatella, S. P. Simeonov, R. F. M. Fraude and C. A. M. Afonso, Green Chem., 2011, 13, 754–793 RSC.
- T. Ståhlberg, W. Fu, J. M. Woodley and A. Riisager, ChemSusChem, 2011, 4, 451–458 CrossRef.
- A. Boisen, T. B. Christensen, W. Fu, Y. Y. Gorbanev, T. S. Hansen, J. S. Jensen, S. K. Klitgaard, S. Pedersen, A. Riisager, T. Ståhlberg and J. M. Woodley, Chem. Ing. Res. Des., 2009, 87, 1318–1327 CAS.
- P. Gallezot, Chem. Soc. Rev., 2012, 41, 1538–1558 RSC.
- R. P. Swatloski, S. K. Spear, J. D. Holbrey and R. D. Rogers, J. Am. Chem. Soc., 2002, 124, 4974–4975 CrossRef CAS.
- C. Li and Z. K. Zhao, Green Chem., 2008, 10, 177–182 RSC.
- J. Guo, D. Zhang, C. Duan and C. Liu, Carbohydr. Res., 2010, 345, 2201–2205 CrossRef CAS.
- F. Tao, H. Song and L. Chou, ChemSusChem, 2010, 3, 1298–1303 CrossRef CAS.
- R. Rinaldi, N. Meine, J. vom Stein, R. Palkovits and F. Schüth, ChemSusChem, 2010, 3, 266–276 CrossRef CAS.
- L. Vanoye, M. Fanselow, J. D. Holbrey, M. P. Atkins and K. R. Seddon, Green Chem., 2009, 11, 390–396 RSC.
- S. J. Dee and A. T. Bell, ChemSusChem, 2011, 4, 1166–1173 CrossRef CAS.
- R. Rinaldi and F. Schüth, ChemSusChem, 2009, 2, 1096–1107 CrossRef CAS.
- C. Vernon, Proc. R. Soc. London, B, 1967, 167, 389–401 CrossRef CAS.
- A. Kresge and T. J. Straub, J. Am. Chem. Soc., 1983, 105, 3957–3957 CrossRef CAS.
- H. D. Phan, T. Yokoyama and Y. Matsumoto, Org. Biomol. Chem., 2012, 10, 7382–7391 CAS.
- K. Lourvanij and G. L Rorrer, Ind. Eng. Chem. Res., 1993, 32, 11–19 CrossRef CAS.
- M. Bicker, J. Hirth and H. Vogel, Green Chem., 2003, 5, 280–284 RSC.
- A. J. Kunov-Kruse, EP12174782.8/US61667837, Patent pending, 2012.
- D. Buslov and N. Nikonenko, Appl. Spectrosc., 1997, 51, 666–672 CrossRef CAS.
- D. Buslov and N. Nikonenko, Appl. Spectrosc., 1998, 52, 613–620 CrossRef CAS.
- N. A. Nikonenko, D. K. Buslov, N. I. Sushko and R. G. Zhbankov, Biopolymers, 2000, 57, 257–262 CrossRef CAS.
- N. A. Nikonenko, D. K. Buslov, N. I. Sushko and R. G. Zhbankov, J. Mol. Struct., 2005, 752, 20–24 CrossRef CAS.
- S. Barsberg, J. Phys. Chem. B, 2010, 114, 11703–11708 CrossRef CAS.
- S. Barsberg, A. R. Sanadi and H. Jørgensen, Carbohydr. Polym., 2011, 85, 457–464 CrossRef CAS.
- R. Marchessault and C. J. Liang, J. Polym. Sci., 1959, 37, 385–395 CrossRef.
- R. Marchessault and C. J. Liang, J. Polym. Sci., 1959, 39, 269–278 CrossRef.
- R. Marchessault and C. J. Liang, J. Polym. Sci., 1962, 59, 357–378 CrossRef CAS.
- F. Pearson, R. Marchessault and C. J. Liang, J. Polym. Sci., 1960, 43, 101–116 CrossRef.
- T. P. Nevell and W. R. Upton, Carbohydr. Res., 1976, 49, 163–174 CrossRef CAS.
- X. Liang, A. Montaya and B. S. Haynes, J. Phys. Chem. B, 2011, 115, 10682–10691 CrossRef CAS.
- X. Qi, M. Watanabe, T. M. Aida and R. L. Smith Jr, Ind. Eng. Chem. Res., 2008, 47, 9234–9239 CrossRef CAS.
- M. J. Frisch, G. W. Trucks, H. B. Schlegel, G. E. Scuseria, M. A. Robb, J. R. Cheeseman, G. Scalmani, V. Barone, B. Mennucci, G. A. Petersson, H. Nakatsuji, M. Caricato, X. Li, H. P. Hratchian, A. F. Izmaylov, J. Bloino, G. Zheng, J. L. Sonnenberg, M. Hada, M. Ehara, K. Toyota, R. Fukuda, J. Hasegawa, M. Ishida, T. Nakajima, Y. Honda, O. Kitao, H. Nakai, T. Vreven, J. A. Montgomery Jr., J. E. Peralta, F. Ogliaro, M. Bearpark, J. J. Heyd, E. Brothers, K. N. Kudin, V. N. Staroverov, R. Kobayashi, J. Normand, K. Raghavachari, A. Rendell, J. C. Burant, S. S. Iyengar, J. Tomasi, M. Cossi, N. Rega, J. M. Millam, M. Klene, J. E. Knox, J. B. Cross, V. Bakken, C. Adamo, J. Jaramillo, R. Gomperts, R. E. Stratmann, O. Yazyev, A. J. Austin, R. Cammi, C. Pomelli, J. W. Ochterski, R. L. Martin, K. Morokuma, V. G. Zakrzewski, G. A. Voth, P. Salvador, J. J. Dannenberg, S. Dapprich, A. D. Daniels, Ö. Farkas, J. B. Foresman, J. V. Ortiz, J. Cioslowski and D. J. Fox, Gaussian 09, Revision A.1, Gaussian, Inc., Wallingford, CT, 2009 Search PubMed.
- Y. Nishiyama, J. Sugiyama, H. Chanzy and P. Langan, J. Am. Chem. Soc., 2003, 125, 14300–14306 CrossRef CAS.
Footnote |
| † Electronic supplementary information (ESI) available: Experimental details, FT-IR spectra and interpretation of data, and HPLC analytic results. See DOI: 10.1039/c3gc41174e |
| This journal is © The Royal Society of Chemistry 2013 |