 Open Access Article
 This Open Access Article is licensed under a
 Creative Commons Attribution 3.0 Unported Licence
The microscopic features of heterogeneous ice nucleation may affect the macroscopic morphology of atmospheric ice crystals†
Stephen J.
Cox
ab,
Zamaan
Raza
a,
Shawn M.
Kathmann
c,
Ben
Slater
a and
Angelos
Michaelides
ab
aThomas Young Centre and Department of Chemistry, University College London, London, WC1E 6BT, UK
bLondon Centre for Nanotechnology, University College London, 17–19 Gordon Street, London, WC1H 0AH
cPhysical Sciences Division, Pacific Northwest National Laboratory, Richland, Washington 99352, United States
First published on 14th May 2013
Abstract
It is surprisingly difficult to freeze water. Almost all ice that forms under “mild” conditions (temperatures > −40 °C) requires the presence of a nucleating agent – a solid particle that facilitates the freezing process – such as clay mineral dust, soot or bacteria. In a computer simulation, the presence of such ice nucleating agents does not necessarily alleviate the difficulties associated with forming ice on accessible timescales. Nevertheless, in this work we present results from molecular dynamics simulations in which we systematically compare homogeneous and heterogeneous ice nucleation, using the atmospherically important clay mineral kaolinite as our model ice nucleating agent. From our simulations, we do indeed find that kaolinite is an excellent ice nucleating agent but that contrary to conventional thought, non-basal faces of ice can nucleate at the basal face of kaolinite. We see that in the liquid phase, the kaolinite surface has a drastic effect on the density profile of water, with water forming a dense, tightly bound first contact layer. Monitoring the time evolution of the water density reveals that changes away from the interface may play an important role in the nucleation mechanism. The findings from this work suggest that heterogeneous ice nucleating agents may not only enhance the ice nucleation rate, but also alter the macroscopic structure of the ice crystals that form.
I. Introduction
Ice formation is a process important in numerous fields, ranging from microbiology1–3 to understanding and predicting chemical processes in the atmosphere where, for example, it is known that ice particles in the polar stratospheric regions catalyse the formation of radicals responsible for ozone depletion.4 Almost all ice formation is facilitated by the presence of a (solid) foreign body, in a process known as heterogeneous nucleation, and it is well reported that different materials affect the rate of ice formation to different extents.5–9 However, despite the wide ranging consequences of ice formation, little is understood about how the surface properties of a foreign body affect its ice nucleating ability. By furthering our knowledge of the microscopic details of heterogeneous nucleation, it is possible that new pathways to the rational design of materials that either inhibit or enhance ice formation can be explored, with implications for the atmospheric10–16 and climate sciences,17,18 along with the food and transport industries.Whereas experiments aimed at measuring the ice nucleating ability of different materials relevant to the atmosphere provide useful information for global climate models, as well as telling us which materials actually make good ice nucleating agents, most of our molecular level understanding of water–surface interactions are a result of detailed surface science studies (for an overview see ref. 19–25). For example, through the combined use of density functional theory (DFT) calculations and experiments such as scanning tunnelling microscopy and infrared spectroscopy, the structures of the first wetting layer at Pt(111)26,27 and sub-monolayer chains at Cu(110)28 have been elucidated. Such studies are, however, unable to provide the simultaneous spatial and temporal resolution required to probe the heterogeneous ice nucleation mechanism, making computer simulation an appropriate tool to study such a process. Despite a number of computer simulation studies of homogeneous nucleation,29–37 there have been very few that have directly probed heterogeneous nucleation. Yan and Patey38,39 have performed an excellent set of molecular dynamics (MD) simulations aimed at investigating the effect of strong electric fields on ice nucleation, finding that ferroelectric cubic ice forms in the region exposed to the electric field. Although this provides some insight into the role of electric fields on nucleation, the fields used are relatively smooth, whereas those exerted by real surfaces are likely to greatly vary on molecular length scales. Solveyra et al.40 have also looked at the effect of confinement on ice nucleation in both hydrophilic and hydrophobic nanopores, using the single-site mW water model.41 Use of such coarse grained force fields to describe the molecular interactions has the distinct advantage of being able to simulate large length- and time-scales at reasonable computational cost, but would unfortunately be inappropriate for the current study, where the electrostatic interactions between the surface and water are significant. The work presented here is unique in that, to our knowledge, it will be the first to directly simulate the dynamical process of heterogeneous nucleation where the atomic structure of both water and the substrate is taken into account.
As with homogeneous nucleation, there are many computational techniques at our disposal for looking at heterogeneous nucleation. One possible route is to use a free-energy based method such as metadynamics42 or umbrella sampling43 (for applications of these methods to homogeneous ice nucleation see ref. 35–37). The advantage of methods such as these is that one is able to obtain free energy barriers to nucleation along a specified reaction coordinate, but with the drawback that the system has to be driven along a predetermined set of collective variables, with no guarantee that the ‘true’ reaction pathway is being sampled. Another approach is to perform a number of unbiased MD simulations, starting with water in the supercooled liquid state, over suitably long time-scales until the nucleation event is observed. Although adopting such an approach may be seen as computationally inefficient, with recent advances in computer technology and software, the timescales involved are realisable at a reasonable computational cost for small to medium system sizes. Furthermore, by only performing unbiased MD simulations, we are no longer imposing a priori the reaction coordinate that the system must traverse. This direct approach has been used to seemingly good effect to study homogeneous ice nucleation, first by Matsumoto et al.29 and subsequently by Jungwirth and co-workers.30–32
With our aim of understanding heterogeneous ice nucleation, we have opted to explore the clay mineral kaolinite as our model ice nucleating agent. Each year, as much as 3000 Tg of mineral dust (naturally occurring crystalline solid compounds) is transported into the troposphere from desert regions44 where it catalyses the formation of ice.5,9 The composition of mineral dust is diverse with quartz, feldspar, calcite and clays all present in significant proportions in typical atmospheric dust samples. Clays are the most frequently observed group in atmospheric mineral dust, of which kaolinite forms a substantial fraction.9 Apart from being a known effective ice nucleating agent,7,8,45 the binding of water to the pristine hydroxyl-terminated (001) face has been well characterised theoretically,46,47 which aids in the analysis of our nucleation simulations.
Kaolinite is a layered silicate mineral with chemical composition Al2Si2O5(OH)4. Each layer consists of a tetrahedral silica sheet alternating with an octahedral alumina sheet, terminated with hydroxyl groups (see Fig. 1). In the bulk, these layers are bound by hydrogen bonds between the hydroxyl-terminated face and the silica-terminated face, giving rise to facile cleavage along the (001) plane, exposing the hydroxyl- and silicate-terminated faces. It is believed that the hydrophilic hydroxyl-terminated face is the origin of the ice nucleating efficacy of kaolinite, with the textbook explanation being that the pseudo-hexagonal arrangement of –OH groups acts as a template upon which the basal face of ice Ih can grow.5 Despite its attractive simplicity, the validity of this explanation has been questioned; a series of DFT calculations by Hu and Michaelides46–48 indicate that the most stable ice-like bilayer at the kaolinite surface is actually hydrophobic with respect to growth of further layers of ice, a property attributed to the amphoteric nature of the hydroxyl-terminated surface; whilst grand canonical Monte Carlo simulations by Croteau et al.49–51 have shown that only small regions of hexagonal motifs form in the first water overlayer and that these are somewhat stretched relative to bulk ice. In this work, we will directly probe the ice nucleation mechanism at the kaolinite (001) surface using MD simulations in a bid to shed further light onto the process of ice formation in the presence of this important mineral, as well as make inroads into understanding heterogeneous ice nucleation in general.
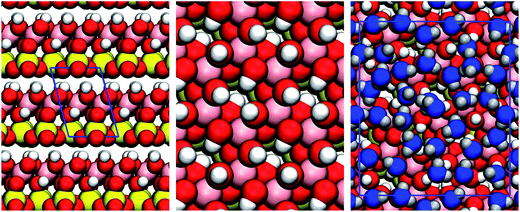 | ||
| Fig. 1 Structure of kaolinite. On the left we show the layered bulk structure of kaolinite. As the layers are bound by hydrogen bonds between the hydroxyl-terminated and silicate-terminated faces, facile cleavage is observed along in the (001) plane. The middle panel shows the hydroxyl-terminated (001) face. DFT calculations46,47 show that upon cleavage, 1/3 of the OH groups rotate into the plane of the surface, making it amphoteric i.e. able to both accept and donate hydrogen bonds with water. On the right is a snapshot from one of the MD simulations showing the first contact layer of supercooled water. We can see that the water molecules are densely packed and disordered. The colour scheme is: Si, yellow; Al, pink; O, red; and H, white. Water molecules in the first contact layer are shown in blue. | ||
In what follows, we will see that, rather than the basal face, we exclusively see the prism face growing from the kaolinite surface. We will show that density fluctuations in the supercooled water away from the kaolinite slab play an important role in the heterogeneous nucleation mechanism. We will also discuss the role finite size effects play in our simulations before concluding and discussing the implications for the macroscopic crystal structure of our findings.
II. Methods
As we wish to simulate many molecules over long time scales it will be necessary to use classical force fields as opposed to quantum mechanical methods such as DFT. To this end, we employ the TIP4P/2005 water model52 and the CLAYFF potential of Cygan et al.53 to describe the kaolinite. TIP4P/2005, a rigid point charge water model, has been shown to replicate the phase diagram of water qualitatively well along with the transport properties of bulk water, even though it predicts the melting point of ice Ih to be ca. 252 K. It also reproduces the experimental bulk densities of liquid water, hexagonal and cubic ice very well, making it a suitable choice for modelling ice nucleation. The CLAYFF potential has been widely used for studying water at various clay mineral interfaces,54–57 and in particular for the study of ice nucleation at kaolinite by grand canonical Monte Carlo methods.49–51 In this approach, the clay atoms are treated as simple point charges with Lennard-Jones interactions, with the only explicit bonding term occurring between the oxygen and hydrogen of the hydroxyl groups. Such flexibility in the model allows CLAYFF to describe a number of different clay structures and phases satisfactorily, as well as the swelling of clays with increased water content.53 The water–clay interaction was calculated using the standard Lorentz–Berthelot mixing rules.58,59For the MD simulations, we followed a protocol similar to that used by Jungwirth and co-workers,30–32 who have had much success in direct simulation of homogeneous ice nucleation. To create our homogeneous systems, 192 water molecules were placed in an orthogonal simulation cell with lateral (xy) dimensions of ca. 13.2 × 15.6 Å2.60 Due to the small x- and y-dimensions, a small cutoff of 6.5 Å was employed. Electrostatic interactions were calculated using the smooth particle mesh Ewald method, with a pseudo 2D correction61 for the slab geometry, giving an effective z-dimension of at least 100 Å. The geometry of this system can thus be best described as an infinite slab with two liquid–vapour interfaces. For the heterogeneous system, the kaolinite was modelled as a single slab and 192 water molecules were placed on the hydroxyl-terminated (001) face, creating a solid–liquid interface, whilst leaving a liquid–vapour interface. Due to the presence of the kaolinite substrate, the lateral dimensions were ca. 15.5 × 17.9 Å2, slightly larger than in the homogeneous case. To ensure that the kaolinite slab did not drift, one of the silicon atoms was fixed throughout the simulations.
To propagate the dynamics, the velocity Verlet algorithm was used with a timestep of 2 fs. Simulations were performed in the canonical ensemble and the temperature was controlled using a Nosé–Hoover chain of length 10 and a temperature coupling constant of 0.5 ps. Both systems were equilibrated at 300 K for 2 ns from which initial configurations for the production runs were sampled. For the production simulations, the systems were quenched to 220 K (i.e. approximately 30 K supercooled) and ran for the order of 1 μs or until nucleation was observed. The water geometry was maintained using the SETTLES62 algorithm, whereas the P-LINCS63 algorithm was used to constrain the O–H bond in kaolinite. All simulations were performed using the GROMACS 4.5 simulation package.64
III. Results and discussion
In total we ran 27 heterogeneous simulations, observing 10 nucleation events and 30 homogeneous simulations, observing 9 nucleation events. Movies of some of these are available in the supporting information (ESI†). Before doing any detailed analysis, one trend was immediately clear: on the kaolinite we exclusively formed hexagonal ice whereas in the homogeneous simulations we generally observed a mixture of hexagonal and cubic stacking patterns. In all but one of the homogeneous simulations, at least half of the ice formed consisted of cubic sequences with the bilayers parallel to the liquid–vapour boundary. Only one simulation resulted in solely hexagonal ice. This is qualitatively consistent with X-ray diffraction data and Monte Carlo simulations performed by Malkin et al., which demonstrated that the homogeneous nucleating phase is stacking disordered (denoted as ice Isd), consisting of roughly equal numbers of cubic and hexagonal sequences.65,66 This mixture of cubic and hexagonal layers is also consistent with previous simulation studies.30,67 Furthermore, when ice forms homogeneously we see a variety of crystal orientations within the simulation cell whereas when ice forms on the kaolinite, we always see growth along the prism face of ice and not the basal face i.e. the ice bilayers grow perpendicular to the kaolinite slab. In Fig. 2 we show diagrams of the basal and prism faces at the kaolinite surface. The observation that the prism face nucleates at kaolinite is interesting, as it means that the pseudo-hexagonal arrangement of –OH groups at the kaolinite surface are not acting as a template for the basal face of ice.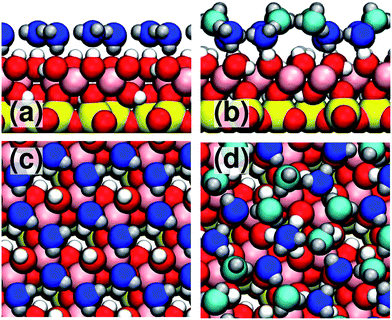 | ||
| Fig. 2 Diagram of ice-like structures at the kaolinite surface. In panel (a) we show a side view of the basal face of ice bound to kaolinite in the “H-down bilayer” configuration.47 All water molecules bind with similar heights from the surface. Panel (b) shows a side view of the prism face bound to kaolinite. In this structure, the water molecules come in high-lying (light blue) and low-lying (dark blue) pairs. Note that the prism face structure donates hydrogen bonds to the surface, as well as having ‘dangling’ hydrogen bonds pointing away from the surface (these dangling hydrogen bonds are absent in the basal face structure). Panels (c) and (d) show top views of the basal and prism face structures, respectively. | ||
From visual inspection of the ice-forming trajectories it was noticed that, during the nucleation event, considerable rearrangement of the water molecules always seemed to occur in the second water layer above the kaolinite surface (note that this statement does not preclude any rearrangement occurring in the first or third layers). To provide evidence for this observation we measured how the density of water varies with height along the z-direction during the transition. In Fig. 3 we present this analysis for a single heterogeneous and homogeneous simulation along with the corresponding snapshots. First of all, we can see that the supercooled liquid (shown at 55 ns) has an extremely sharp and intense density peak at the kaolinite surface, as well as a pronounced, but broader, second peak.68 After 61.5 ns the nucleation event has occurred and we can see the intensity of the first peak has decreased slightly, although it still remains much higher than anywhere else in the system. We also see that the second peak has started to split (highlighted in yellow), indicative of an ice-like layer forming. It is only after this change in density in the second layer that we see the first layer transform fully to ice. We can compare this to the homogeneous case, where the density in the supercooled liquid is essentially uniform and the nucleation event seems to occur by two or three layers concurrently forming ice. In both the homogeneous and heterogeneous scenarios, once the initial nucleation event has occurred the growth of ice then proceeds, with a quasi liquid-like layer remaining at the water–vapour interface, consistent with previous simulation studies.30,67,69,70 We note that the observed changes away from the surface have striking similarity with the previously reported ‘collective mechanism’ for ice growth along non-basal faces at temperatures below 240 K.71,72
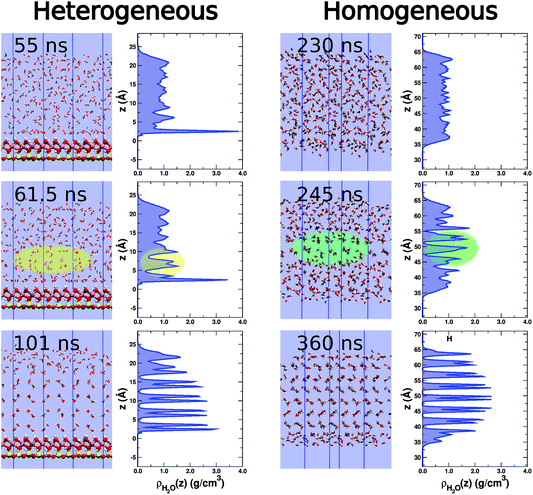 | ||
| Fig. 3 Snapshots and water density profiles for a homogeneous (right) and heterogeneous (left) nucleation event. In the presence of kaolinite, the supercooled water (55 ns) has a high density peak corresponding to the first contact layer. There is also a noticeable second peak, but this is far less intense and much broader. After 61.5 ns, nucleation has started. There is a slight reduction in density of the first density peak, but this is still much higher than anywhere else in the system. Rearrangement of water molecules in the second layer associated with a split in the density peak (highlighted in yellow), is also seen and is indicative of an ice-like layer forming. By 101 ns the first contact layer has fully transformed to ice and the density is similar to that observed in the rest of the system. Note that it is the prism face of ice exposed to the kaolinite surface and that we only observe hexagonal ice. In contrast, for the homogeneous slab we see a fairly uniform density profile in the supercooled regime (230 ns). We also see a mixture of hexagonal and cubic stacking. In this instance, the initial nucleation event (highlighted in green) leads to a cubic stacking arrangement. The densities are averages over a 2.5 ns interval centred at the specified time. The colour scheme is the same as Fig. 1. | ||
To investigate these structural changes away from the surface further, for each heterogeneous nucleation event observed we have computed the density difference:
| Δρ(z) = ρ(z) − 〈ρliq(z)〉 | (1) |
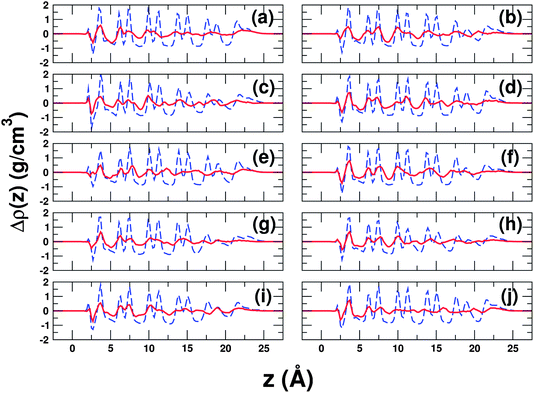 | ||
| Fig. 4 Water density difference profiles for all heterogeneous nucleation events. Each panel (a–j) shows an independent nucleation event. The quantity plotted is Δρ(z) as defined by eqn (1). The red solid line shows Δρ(z) at a time just after the onset of nucleation and the blue dashed line shows Δρ(z) at a later time after ice has grown. In all cases, we see that there are density changes in the second layer (just below 7.5 Å) of a similar size to those in the first layer, before ice goes on to form fully (noticeable changes in the third layer are also often observed). In the case of (b), we know from a committor analysis that the red line corresponds to a pre-critical configuration. The displayed densities are averages over 2.5 ns. | ||
It is important to consider how significant the changes in density away from the surface are in the ice nucleation mechanism; after all, one may argue that these are just a consequence of the initial changes seen in the first layer and are merely indicative of ice growth rather than playing a role in the nucleation mechanism itself. We have therefore performed a committor analysis on the heterogeneous trajectory presented in Fig. 3 (and panel (b) in Fig. 4), using the CHILL algorithm of Moore et al.73 to monitor ice formation. This was done by choosing different configurations along this trajectory and starting 10 new trajectories with random velocities drawn from the Maxwell–Boltzmann distribution. Results from three starting configurations are presented in Fig. 5, where we can clearly define a pre- and post-critical region (initial configurations from 62.5 ns and 70.0 ns of the initial trajectory, respectively). In between these two regimes, however, we do not see an expected 50![[thin space (1/6-em)]](https://www.rsc.org/images/entities/char_2009.gif) :50 split of trajectories going on to reach the liquid and ice states, rather we see some that definitely go to ice, some that definitely go to liquid but some trajectories that stay somewhere in between, even over fairly long timescales (ca. 50 ns). As the cost of this committor analysis is high, we have not attempted to refine our search further and remain satisfied that the configuration sampled at 65.0 ns is a reasonable representation of the ‘transition region’. What is relevant to our discussion regarding the density changes in the second layer is that Δρ(z) shown by the red line shown in Fig. 4(b) corresponds to the configuration sampled at 62.5 ns i.e. the splitting in the second peak for this trajectory occurs in the pre-critical regime, indicating that these structural changes are part of the nucleation mechanism rather than a feature of growth. We have also performed a similar analysis for the trajectory in Fig. 4(d), which we present in the supporting information (ESI†), along with movies showing how Δρ(z) varies during the nucleation event.
:50 split of trajectories going on to reach the liquid and ice states, rather we see some that definitely go to ice, some that definitely go to liquid but some trajectories that stay somewhere in between, even over fairly long timescales (ca. 50 ns). As the cost of this committor analysis is high, we have not attempted to refine our search further and remain satisfied that the configuration sampled at 65.0 ns is a reasonable representation of the ‘transition region’. What is relevant to our discussion regarding the density changes in the second layer is that Δρ(z) shown by the red line shown in Fig. 4(b) corresponds to the configuration sampled at 62.5 ns i.e. the splitting in the second peak for this trajectory occurs in the pre-critical regime, indicating that these structural changes are part of the nucleation mechanism rather than a feature of growth. We have also performed a similar analysis for the trajectory in Fig. 4(d), which we present in the supporting information (ESI†), along with movies showing how Δρ(z) varies during the nucleation event.
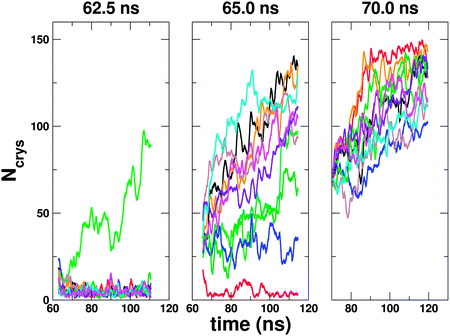 | ||
| Fig. 5 Committor analysis from one of the heterogeneous ice nucleation trajectories. Results here are shown for initial configurations sampled at 62.5 ns, 65.0 ns and 70.0 ns from the initial ice forming trajectory. 10 independent trajectories were started from each configuration by giving the particles random velocities sampled from a Maxwell–Boltzmann distribution. By monitoring the number of water molecules defined as being ice by the CHILL algorithm,73Ncrys, we are able to determine whether or not ice forms. We can clearly see that at 62.5 ns we are in a pre-critical regime and by 70 ns all trajectories continue to form ice. At 65.0 ns we do not see all trajectories form ice or liquid, but some stay somewhere in between the two states, even over the ca. 50 ns timescale. Results are presented as running averages over a 1 ns interval. | ||
It is interesting to attempt to explain some of these observations. To help understand why we see the formation of ice with its prism rather than basal face exposed to the kaolinite surface, we have investigated how the adsorption energy of ice changes with the number of ice-like layers, for both the prism and basal faces bound to the kaolinite (details of these calculations are given in the supporting information, ESI†). The results of this analysis are presented in Fig. 6, where we present the data in terms of adsorption energy per water molecule and adsorption energy per conventional unit cell of kaolinite. When only the first contact layer is present, the basal face of ice is more strongly bound than the prism face by approximately 15 meV/H2O. As soon as we go beyond the first layer, however, the prism face becomes more stable, with the difference becoming more pronounced as more layers are added. The prism face also binds with a higher coverage than the basal face (5.33 vs. 4 H2O per conventional unit cell) meaning that the prism face is more stable per unit cell of kaolinite independent of the number of ice-like layers. To understand these differences, it is useful to examine the structure of the ice-like layers when binding through the prism and basal faces, which we show in Fig. 2. Here it can be seen that the water molecules in the basal face structure bind with similar heights from the kaolinite, with half the molecules donating one hydrogen bond to the surface and the other half accepting a hydrogen bond from the kaolinite whilst donating two hydrogen bonds to other water molecules (the “H-down bilayer” structure as described in ref. 47).74 By adopting this structure, the water molecules maximise their bonding to the kaolinite and maintain good hydrogen bonding between each other, giving a large overall adsorption energy for the first layer. This structure, however, saturates all hydrogen bonds leaving no ‘dangling’ hydrogen bonds that water molecules in above layers can bind to and consequently, the adsorption energy rapidly becomes less exothermic as other layers are added. This finding is consistent with previous findings from a DFT study,47 as well as the experimental observation that the availability of dangling hydrogen bonds determines the multilayer wetting behaviour of water on metal and metal oxide surfaces.75 On the other hand, the prism face binds with a somewhat more corrugated configuration, with the water molecules coming in high-lying and low-lying pairs. One of the molecules in the low-lying pair donates one hydrogen bond to the kaolinite whilst its partner accepts hydrogen bonds from the kaolinite. The high-lying pairs bridge the low-lying pairs through hydrogen bonds, with the important feature that one of these high-lying molecules has an OH bond directed away from the surface i.e. the prism face exhibits dangling hydrogen bonds. The fact that half of the molecules come in high-lying pairs means that the adsorption energy per water molecule of the first layer is less for the prism face than it is for the basal face, but the ability of the prism face to donate and accept hydrogen bonds to both the surface and the above water layers means that it becomes more stable as the number of water layers increases. We have also computed the adsorption energies of the first and second layers with DFT using the Perdew–Burke–Ernzerhof (PBE) exchange–correlation functional76 (full details of these calculations are given in the supporting information, ESI†). Although agreement is not exact between our force field setup and PBE (which should not be taken as a benchmark) the trend that the prism face becomes more stable than the H-down bilayer upon adsorption of a second layer of ice is still seen. This suggests that this observation is not an artifact of our choice of force field.
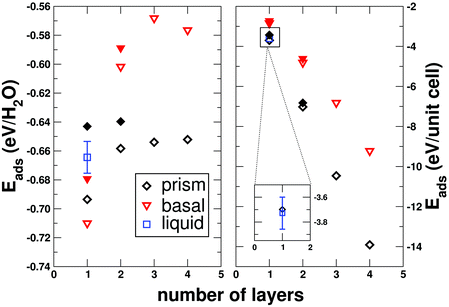 | ||
| Fig. 6 Variation of the adsorption energy (Eads) of ice to kaolinite as the number of ice layers changes. The black diamonds show results for ice binding to kaolinite through its prism face, whilst the red triangles show results for ice binding through its basal face. Filled symbols show results from DFT calculations. The left panel shows the adsorption energy calculated per water molecule, whereas the right panel shows the adsorption energy per conventional unit cell of kaolinite. For the first contact layer on its own, the adsorption energy per water molecule is stronger for the basal face than the prism face, but upon adsorption of other layers, the prism face structure becomes significantly more stable. When ice binds through the prism face, the coverage of water molecules is higher than when it binds through the basal face, meaning that the adsorption energy per unit cell of kaolinite is more stable for the prism face independent of the number of adsorbed layers. Data for the first liquid layer is also shown (the bars indicate estimates of the thermal fluctuations). On a per molecule basis, this is less stable than the ice-like structures, but is more stable per unit cell of kaolinite. | ||
In Fig. 6 we also show the average adsorption energy of the first layer from 25 configurations selected from the supercooled liquid.77 On a per molecule basis, the liquid layer is less stable than either of the ice-like structures, but from the right hand panel of Fig. 6 we can see that per unit cell of kaolinite, the liquid layer is slightly more stable. This result may help us explain the observed density changes away from the surface during the nucleation process. If we draw an analogy to the grand canonical ensemble, we may consider the first water layer as a subsystem that is able exchange heat and particles with the bulk liquid above.78 In the supercooled state, therefore, there will be some pseudo-equilibrium number of water molecules in the first layer, which we have measured to be 5.61 H2O/unit cell (cf. 5.33 H2O/unit cell for the prism face). Thus, although the adsorption energy per water molecule is stronger for the first layer of ice, on average more water molecules are present in the first liquid layer leading to an overall stabilisation. For ice to form and persist at the surface, it is therefore required that the average number of water molecules at the surface decreases. In keeping with the analogy to the grand canonical ensemble, this amounts to a need for a change in the chemical potential of the reservoir of water molecules above the first layer, which manifests itself as the structural changes away from the surface discussed previously. We can also see from the right panel of Fig. 6 that the adsorption energy of the prism face per unit cell is within our estimate of the thermal fluctuations from the average liquid value. This may be one of the reasons for kaolinite's good ice nucleating ability.
Finally, it is important that we mention the role of finite size effects in this work. We have attempted to perform these simulations with system sizes doubled in the lateral dimensions (768 water molecules, cutoff for interactions extended to 9 Å) but no nucleation was observed in a total simulation length of 15.5 μs over a temperature range spanning of 190–220 K. We also simulated 2 μs at 240 K using the TIP4P/ice water model,79 which has a melting point similar to experiment, but still no nucleation was observed. This discrepancy can be explained by the fact that in the small systems, there is a self interaction of the growing ice nucleus with its periodic images that lowers the interfacial free energy cost of nucleation. We have also performed 14 homogeneous simulations in the same cell used for the heterogeneous simulations (i.e. lateral dimensions of ca. 15.5 × 17.9 Å without the kaolinite slab). No nucleation events were observed. Although it would have been desirable to have observed nucleation in these simulations, so that we could have compared homogeneous and heterogeneous rates, one pleasing aspect of this last null result is that it means that the heterogeneous nucleation results presented earlier are not completely dominated by finite size effects. As we are able to routinely observe nucleation in this cell when the kaolinite slab is present, but not homogeneously, we are left to conclude that kaolinite significantly enhances the rate. We are not currently in a position, however, to go beyond this qualitative level.
As a final test of the finite size effects, we doubled the lateral cell dimensions and used a configuration from one of our heterogeneous simulations, replicated in both dimensions to fill the larger cell, as an initial configuration. Taking the configuration that we have determined to be representative of the transition region from the committor analysis as a ‘seed’ configuration for the larger cell, we still see ice growth in the same manner as the small cells. The fact that we see growth and not a collapse of the crystal suggests that the prism face is stable on the hydroxyl-terminated (001) kaolinite face and is not solely stabilised by periodic boundary effects present in the small cells.
IV. Conclusions
We have investigated ice nucleation in thin water films, both homogeneously and heterogeneously in the presence of a kaolinite slab, using regular molecular dynamics simulation. We have performed many simulations on the order of one microsecond, observing many nucleation events. In agreement with previous simulation studies and recent experiments, in the case of homogeneous nucleation we see a mixture of cubic and hexagonal arrangements. Contrary to expectation, at the kaolinite surface we always see growth along the prism face of ice, suggesting that the source of kaolinite's good ice nucleating ability does not lie with its good epitaxial match with the basal face of ice. By monitoring the density of water above the kaolinite slab during the nucleation event, we see that changes in the second water layer appear crucial to the nucleation mechanism. The growth of the prism face rather than the basal face is due to the ability of the former to bind favourably to both the surface and water layers above, as well as having a higher coverage. The observed structural changes away from the surface have been explained as allowing the average number of water molecules in the first layer to decrease, which subsequently allows the remaining water molecules to form the favoured ice-like structure. We have, however, seen that finite size effects are non-negligible in these simulations, with no nucleation observed upon moving to bigger cells. Nevertheless, the fact that we do not observe homogeneous nucleation in the cell size used for the heterogeneous nucleation simulations suggests that the results on kaolinite are not entirely dominated by the finite size effects. This result also shows that kaolinite is a potent ice nucleating agent.Given the finite size effects, it would be highly desirable to implement a free energy method that could definitively probe the heterogeneous nucleation mechanism proposed here. Even with the current state-of-the-art in free energy methods and advanced sampling techniques, freezing water is still likely to be difficult. The reason for this is that slow dynamics offered by the hydrogen bonding network present in supercooled water makes it very difficult for methods such as umbrella sampling and metadynamics to equilibrate the system as it is pushed along the chosen order parameter.80 Furthermore, advanced sampling techniques that exploit natural dynamics, such as transition path sampling81 or forward flux sampling82 are likely to suffer as the actual transition time is relatively long (tens of nanoseconds, as seen in Fig. 5), which may make sampling computationally prohibitive. One way to circumvent this problem is through the use of a coarse grained potential such as the mW model41 which, by treating hydrogen bonding in a mean-field sense, reduces the complexity of the underlying potential energy surface and results in faster dynamics. This has already been used to good effect with both direct molecular dynamics (see e.g.ref. 83) and forward flux sampling84 for homogeneous nucleation. Such methods could be used to verify previous homogeneous simulations that suffer from similar finite size effects.30–32 This approach is unlikely to work in the case of heterogeneous nucleation on substrates such as clays, however, where electrostatics are dominant. How to proceed in such cases is at present unclear, but given the industrial and environmental implications of ice formation, the topic deserves a major research effort.
Finally, the fact that the pristine kaolinite surface promotes the growth of the prism face over the basal face may have consequences for the macroscopic crystal structure of ice that forms. Ice exhibits a complex habit diagram85 and as the surface cleavage energies of the prism and basal faces are very similar86 it is possible that different heterogeneous ice nucleating agents could tip the balance to favour different ice habits under the same conditions. As the macroscopic structure of an ice crystal can affect its light scattering properties, understanding the effect of ice nucleating agents may be important for global climate models. Future calculations will probe the influence of other ice nucleating agents on nucleation and growth processes with the aspiration of comparing with measurements from cloud chamber experiments.
Acknowledgements
The authors would like to thank Dr. Xiao-Liang Hu for many helpful discussions when commencing this work and for providing Fig. S2.† This research used resources of the National Energy Research Scientific Computing Center, which is supported by the Office of Science of the U.S. Department of Energy under Contract No. DE-AC02-05CH11231. We are grateful to the London Centre for Nanotechnology and UCL Research Computing for computational resources. Via our membership of the UK’s HPC Materials Chemistry Consortium, which is funded by EPSRC (EP/F067496), this work made use of the facilities of HECToR, the UK’s national high-performance computing service, which is provided by UoE HPCx Ltd. at the University of Edinburgh, Cray Inc., and NAG Ltd., and funded by EPSRC’s High End Computing Programme. The authors also acknowledge the use of the UCL Legion High Performance Computing Facility, and associated support services, in the completion of this work. S.M.K. was supported fully by the U.S. Department of Energy, Office of Basic Energy Sciences (BES), Division of Chemical Sciences, Geosciences, and Biosciences. S.J.C. was supported by a student fellowship funded jointly by UCL and BES. A.M. is supported by the European Research Council and the Royal Society through a Royal Society Wolfson Research Merit Award.References
- K. A. Sharp, Proc. Natl. Acad. Sci. U. S. A., 2011, 108, 7281 CrossRef CAS PubMed.
- Y. Liou, A. Tocilj, P. Davies and Z. Jia, Nature, 2000, 406, 322 CrossRef CAS PubMed.
- B. C. Christner, C. E. Morris, C. M. Foreman, R. Cai and D. C. Sands, Science, 2008, 319, 1214 CrossRef CAS PubMed.
- J. P. D. Abbatt, Chem. Rev., 2003, 103, 4783 CrossRef CAS PubMed.
- H. R. Pruppacher and J. D. Klett, Microphysics of Clouds and Precipitation - Second Revised and Enlarged Edition with an Introduction to Cloud Chemistry and Cloud Electricity, Kluwer Academic Publishers, Dordrecht, The Netherlands, 1997 Search PubMed.
- W. Cantrell and A. Heymsfield, Bull. Am. Meteorol. Soc., 2005, 86, 795 CrossRef.
- F. Zimmermann, S. Weinbruch, L. Schuetz, H. Hofmann, M. Ebert, K. Kandler and A. Worringen, J. Geophys. Res.: Atmos, 2008, 113, D23204 CrossRef.
- M. L. Eastwood, S. Cremel, C. Gehrke, E. Girard and A. K. Bertram, J. Geophys. Res.: Atmos, 2008, 113, D22203 CrossRef.
- B. J. Murray, D. O'Sullivan, J. D. Atkinson and M. E. Webb, Chem. Soc. Rev., 2012, 41, 6519 RSC.
- P. DeMott, D. Rogers and S. Kreidenweis, J. Geophys. Res.: Atmos, 1997, 102, 19575 CrossRef CAS.
- D. Rogers, P. DeMott, S. Kreidenweis and Y. Chen, Geophys. Res. Lett., 1998, 25, 1383 CrossRef CAS.
- R. W. Saunders, O. Möhler, M. Schnaiter, S. Benz, R. Wagner, H. Saathoff, P. J. Connolly, R. Burgess, B. J. Murray, M. Gallagher, R. Wills and J. M. C. Plane, Atmos. Chem. Phys., 2010, 10, 1227 CrossRef CAS.
- M. B. Baker, Science, 1997, 276, 1072 CrossRef CAS.
- J. Verlinde, J. Y. Harrington, G. M. McFarquhar, V. T. Yannuzzi, A. Avramov, S. Greenberg, N. Johnson, G. Zhang, M. R. Poellot, J. H. Mather, D. D. Turner, E. W. Eloranta, B. D. Zak, A. J. Prenni, J. S. Daniel, G. L. Kok, D. C. Tobin, R. Holz, K. Sassen, D. Spangenberg, P. Minnis, T. P. Tooman, M. D. Ivey, S. J. Richardson, C. P. Bahrmann, M. Shupe, P. J. DeMott, A. J. Heymsfield and R. Schofield, Bull. Am. Meteorol. Soc., 2007, 88, 205 CrossRef.
- G. M. McFarquhar, G. Zhang, M. R. Poellot, G. L. Kok, R. McCoy, T. Tooman, A. Fridlind and A. J. Heymsfield, J. Geophys. Res.: Atmos, 2007, 112, D24201 CrossRef.
- B. J. Murray, T. W. Wilson, S. Dobbie, Z. Cui, S. M. R. K. Al-Jumur, O. Möhler, M. Schnaiter, R. Wagner, S. Benz, M. Niemand, H. Saathoff, V. Ebert, S. Wagner and B. Kaercher, Nat. Geosci., 2010, 3, 233 CrossRef CAS.
- Y.-S. Choi and C.-H. Ho, Geophys. Res. Lett., 2006, 33, L21811 CrossRef.
- J. Lee, P. Yang, A. E. Dessler, B.-C. Gao and S. Platnick, J. Atmos. Sci., 2009, 66, 3721 CrossRef.
- P. A. Thiel and T. E. Madey, Surf. Sci. Rep., 1987, 7, 211 CrossRef CAS.
- M. Henderson, Surf. Sci. Rep., 2002, 46, 1 CrossRef CAS.
- A. Hodgson and S. Haq, Surf. Sci. Rep., 2009, 64, 381 CrossRef CAS PubMed.
- A. Verdaguer, G. Sacha, H. Bluhm and M. Salmeron, Chem. Rev., 2006, 106, 1478–1510 CrossRef CAS PubMed.
- G. Ewing, Chem. Rev., 2006, 106, 1511–1526 CrossRef CAS PubMed.
- J. Carrasco, A. Hodgson and A. Michaelides, Nat. Mater., 2012, 11, 667 CrossRef CAS PubMed.
- A. Michaelides, Faraday Discuss., 2007, 136, 287 RSC.
- S. Nie, P. J. Feibelman, N. C. Bartelt and K. Thürmer, Phys. Rev. Lett., 2010, 105, 026102 CrossRef CAS.
- P. J. Feibelman, N. C. Bartelt, S. Nie and K. Thürmer, J. Chem. Phys., 2010, 133, 154703 CrossRef PubMed.
- J. Carrasco, A. Michaelides, M. Forster, S. Haq, R. Raval and A. Hodgson, Nat. Mater., 2009, 8, 427 CrossRef CAS PubMed.
- M. Matsumoto, S. Saito and I. Ohmine, Nature, 2002, 416, 409 CrossRef CAS PubMed.
- L. Vrbka and P. Jungwirth, J. Phys. Chem. B, 2006, 110, 18126 CrossRef CAS PubMed.
- E. Pluhařová, L. Vrbka and P. Jungwirth, J. Phys. Chem. C, 2010, 114, 7831 Search PubMed.
- S. Bauerecker, P. Ulbig, V. Buch, L. Vrbka and P. Jungwirth, J. Phys. Chem. C, 2008, 112, 7631 CAS.
- E. B. Moore and V. Molinero, Phys. Chem. Chem. Phys., 2011, 13, 20008 RSC.
- E. B. Moore and V. Molinero, J. Chem. Phys., 2010, 132, 244504 CrossRef PubMed.
- A. Reinhardt and J. P. K. Doye, J. Chem. Phys., 2012, 136, 054501 CrossRef PubMed.
- R. Radhakrishnan and B. Trout, J. Am. Chem. Soc., 2003, 125, 7743 CrossRef CAS PubMed.
- D. Quigley and P. M. Rodger, J. Chem. Phys., 2008, 128, 154518 CrossRef CAS PubMed.
- J. Y. Yan and G. N. Patey, J. Phys. Chem. Lett., 2011, 2, 2555 CrossRef CAS.
- J. Y. Yan and G. N. Patey, J. Phys. Chem. A, 2012, 116, 7057 CrossRef CAS PubMed.
- E. González Solveyra, E. de la Llave, D. A. Scherlis and V. Molinero, J. Phys. Chem. B, 2011, 115, 14196 CrossRef PubMed.
- V. Molinero and E. B. Moore, J. Phys. Chem. B, 2009, 113, 4008 CrossRef CAS PubMed.
- A. Laio and M. Parrinello, Proc. Natl. Acad. Sci. U. S. A., 2002, 99, 12562 CrossRef CAS PubMed.
- G. Torrie and J. Valleau, J. Comput. Phys., 1977, 23, 187 CrossRef.
- P. A. Smithson, Int. J. Climatol., 2002, 22, 1144 CrossRef.
- B. J. Murray, S. L. Broadley, T. W. Wilson, J. D. Atkinson and R. H. Wills, Atmos. Chem. Phys., 2011, 11, 4191 CrossRef CAS.
- X. L. Hu and A. Michaelides, Surf. Sci., 2007, 601, 5378 CrossRef CAS PubMed.
- X. L. Hu and A. Michaelides, Surf. Sci., 2008, 602, 960 CrossRef CAS PubMed.
- X. L. Hu and A. Michaelides, Surf. Sci., 2010, 604, 111 CrossRef CAS PubMed.
- T. Croteau, A. K. Bertram and G. N. Patey, J. Phys. Chem. A, 2008, 112, 10708 CrossRef CAS PubMed.
- T. Croteau, A. K. Bertram and G. N. Patey, J. Phys. Chem. A, 2009, 113, 7826 CrossRef CAS PubMed.
- T. Croteau, A. K. Bertram and G. N. Patey, J. Phys. Chem. A, 2010, 114, 2171 CrossRef CAS PubMed.
- J. L. F. Abascal and C. Vega, J. Chem. Phys., 2005, 123, 234505 CrossRef CAS PubMed.
- R. Cygan, J. Liang and A. Kalinichev, J. Phys. Chem. B, 2004, 108, 1255 CrossRef CAS.
- J. P. Larentzos, J. A. Greathouse and R. T. Cygan, J. Phys. Chem. C, 2007, 111, 12752 CAS.
- J. Wang, A. G. Kalinichev, R. J. Kirkpatrick and R. T. Cygan, J. Phys. Chem. B, 2005, 109, 15893 CrossRef CAS PubMed.
- D. Argyris, D. R. Cole and A. Striolo, ACS Nano, 2010, 4, 2035 CrossRef CAS PubMed.
- B. Rotenberg, A. J. Patel and D. Chandler, J. Am. Chem. Soc., 2011, 133, 20521 CrossRef CAS PubMed.
- H. A. Lorentz, Ann. Phys. Chem., 1881, 248, 127 CrossRef.
- D. Berthelot and C. R. Hebd, Séanc. Acad. Sci., 1898, 126, 1703 Search PubMed.
- The lateral cell dimensions for the homogeneous simulations were obtained from a 0.01 K NPT simulation of a proton ordered configuration of hexagonal ice. In the case of the heterogeneous simulations, the lateral cell dimensions are constrained to be commensurate with the kaolinite slab. The kaolinite structure used was based upon the experimental structure of Bish,87 with the α and γ angles altered slightly to make the cell orthogonal.
- I. Yeh and M. Berkowitz, J. Chem. Phys., 1999, 111, 3155 CrossRef CAS.
- S. Miyamoto and P. A. Kollman, J. Comput. Chem., 1992, 13, 952 CrossRef CAS.
- B. Hess, H. Bekker, H. J. C. Berendsen and J. G. E. M. Fraaije, J. Comput. Chem., 1997, 18, 1463 CrossRef CAS.
- B. Hess, C. Kutzner, D. van der Spoel and E. Lindahl, J. Chem. Theory Comput., 2008, 4, 435 CrossRef CAS.
- T. L. Malkin, B. J. Murray, A. V. Brukhno, J. Anwar and C. G. Salzmann, Proc. Natl. Acad. Sci. U. S. A., 2012, 109, 1041 CrossRef CAS PubMed.
- W. F. Kuhs, C. Sippel, A. Falenty and T. C. Hansen, Proc. Natl. Acad. Sci. U. S. A., 2012, 109, 21259 CrossRef CAS PubMed.
- M. A. Carignano, J. Phys. Chem. C, 2007, 111, 501 CAS.
- This high density peak is also a feature of water at kaolinite at 300 K, which we show in the supporting information (ESI†), along with a density profile from a DFT-MD simulation at 330 K that also exhibits such a peak.
- D. Pan, L.-M. Liu, B. Slater, A. Michaelides and E. Wang, ACS Nano, 2011, 5, 4562 CrossRef CAS PubMed.
- C. L. Bishop, D. Pan, L. M. Liu, G. A. Tribello, A. Michaelides, E. G. Wang and B. Slater, Faraday Discuss., 2009, 141, 277 RSC.
- H. Nada and Y. Furukawa, J. Cryst. Growth, 1996, 169, 587 CrossRef CAS.
- D. Rozmanov and P. G. Kusalik, J. Chem. Phys., 2012, 137, 094702 CrossRef PubMed.
- E. B. Moore, E. de la Llave, K. Welke, D. A. Scherlis and V. Molinero, Phys. Chem. Chem. Phys., 2010, 12, 4124 RSC.
- The “H-up bilayer” structure was also tested, but this was always less stable than the “H-down” structure and so has been omitted for clarity.
- M. Salmeron, H. Bluhm, M. Tatarkhanov, G. Ketteler, T. K. Shimizu, A. Mugarza, X. Deng, T. Herranz, S. Yamamoto and A. Nilsson, Faraday Discuss., 2009, 141, 221–229 RSC.
- J. P. Perdew, K. Burke and M. Ernzerhof, Phys. Rev. Lett., 1996, 77, 3865–3868 CrossRef CAS.
- Water molecules are defined as being in the first layer if their oxygen atoms are within 5 Å of the average height of the kaolinite surface oxygen atoms. This corresponds to a cutoff that is approximately halfway between the first and second ice layers.
- We must emphasise that this is an analogy to the grand canonical ensemble and that the first water layer and the above liquid are strongly coupled.
- J. L. F. Abascal, E. Sanz, R. G. Fernández and C. Vega, J. Chem. Phys., 2005, 122, 234511 CrossRef CAS PubMed.
- A. Reinhardt, J. P. K. Doye, E. G. Noya and C. Vega, J. Chem. Phys., 2012, 137, 194504 CrossRef PubMed.
- P. G. Bolhuis, D. Chandler, C. Dellago and P. L. Geissler, Annu. Rev. Phys. Chem., 2002, 53, 291–318 CrossRef CAS PubMed.
- R. J. Allen, C. Valeriani and P. R. ten Wolde, J. Phys.: Condens. Matter, 2009, 21, 463102 CrossRef PubMed.
- E. B. Moore and V. Molinero, Nature, 2011, 479, 506 CrossRef CAS PubMed.
- T. Li, D. Donadio, G. Russo and G. Galli, Phys. Chem. Chem. Phys., 2011, 13, 19807 RSC.
- M. P. Bailey and J. Hallett, J. Atmos. Sci., 2009, 66, 2888 CrossRef.
- D. Pan, L.-M. Liu, G. A. Tribello, B. Slater, A. Michaelides and E. Wang, J. Phys.: Condens. Matter, 2010, 22, 074209 CrossRef PubMed.
- D. L. Bish, Clays Clay Miner., 1993, 41, 738 CAS.
Footnote |
| † Electronic supplementary information (ESI) available. See DOI: 10.1039/c3fd00059a |
| This journal is © The Royal Society of Chemistry 2013 |