 Open Access Article
Creative Commons Attribution 3.0 Unported Licence
Atmospheric aerosols in Amazonia and land use change: from natural biogenic to biomass burning conditions
Paulo
Artaxo
*a,
Luciana V.
Rizzo
b,
Joel F.
Brito
a,
Henrique M. J.
Barbosa
a,
Andrea
Arana
a,
Elisa T.
Sena
a,
Glauber G.
Cirino
c,
Wanderlei
Bastos
d,
Scot T.
Martin
e and
Meinrat O.
Andreae
f
aInstitute of Physics, University of São Paulo, Rua do Matão, Travessa R, 187. CEP 05508-090, São Paulo, S.P., Brazil. E-mail: artaxo@if.usp.br
bDepartment of Earth and Exact Sciences, Institute of Environmental, Chemical and Pharmaceutics Sciences, Federal University of São Paulo, UNIFESP - Campus Diadema, Rua Prof. Artur Riedel, 275, CEP 09972-270, Diadema – São Paulo, Brazil
cINPA - Instituto Nacional de Pesquisas da Amazônia, Av. André Araújo, 2.936 – CEP 69067-375, Manaus, Brazil
dLaboratório de Biogeoquímica Ambiental Wolfgang C. Pfeiffer, Universidade Federal de Rondônia - UNIR, Rondônia, Brazil
eSchool of Engineering and Applied Sciences and Department of Earth and Planetary Sciences, Harvard University, 29 Oxford St., Pierce Hall, Cambridge, Massachusetts 02138, USA
fBiogeochemistry Department, Max Planck Institute for Chemistry, P.O. Box 3060, 55020 Mainz, Germany
First published on 24th September 2013
Abstract
In the wet season, a large portion of the Amazon region constitutes one of the most pristine continental areas, with very low concentrations of atmospheric trace gases and aerosol particles. However, land use change modifies the biosphere–atmosphere interactions in such a way that key processes that maintain the functioning of Amazonia are substantially altered. This study presents a comparison between aerosol properties observed at a preserved forest site in Central Amazonia (TT34 North of Manaus) and at a heavily biomass burning impacted site in south-western Amazonia (PVH, close to Porto Velho). Amazonian aerosols were characterized in detail, including aerosol size distributions, aerosol light absorption and scattering, optical depth and aerosol inorganic and organic composition, among other properties. The central Amazonia site (TT34) showed low aerosol concentrations (PM2.5 of 1.3 ± 0.7 μg m−3 and 3.4 ± 2.0 μg m−3 in the wet and dry seasons, respectively), with a median particle number concentration of 220 cm−3 in the wet season and 2200 cm−3 in the dry season. At the impacted site (PVH), aerosol loadings were one order of magnitude higher (PM2.5 of 10.2 ± 9.0 μg m−3 and 33.0 ± 36.0 μg m−3 in the wet and dry seasons, respectively). The aerosol number concentration at the impacted site ranged from 680 cm−3 in the wet season up to 20![[thin space (1/6-em)]](https://www.rsc.org/images/entities/char_2009.gif) 000 cm−3 in the dry season. An aerosol chemical speciation monitor (ACSM) was deployed in 2013 at both sites, and it shows that organic aerosol account to 81% to the non-refractory PM1 aerosol loading at TT34, while biomass burning aerosols at PVH shows a 93% content of organic particles. Three years of filter-based elemental composition measurements shows that sulphate at the impacted site decreases, on average, from 12% of PM2.5 mass during the wet season to 5% in the dry season. This result corroborates the ACSM finding that the biomass burning contributed overwhelmingly to the organic fine mode aerosol during the dry season in this region. Aerosol light scattering and absorption coefficients at the TT34 site were low during the wet season, increasing by a factor of 5, approximately, in the dry season due to long range transport of biomass burning aerosols reaching the forest site in the dry season. Aerosol single scattering albedo (SSA) ranged from 0.84 in the wet season up to 0.91 in the dry. At the PVH site, aerosol scattering coefficients were 3–5 times higher in comparison to the TT34 site, an indication of strong regional background pollution, even in the wet season. Aerosol absorption coefficients at PVH were about 1.4 times higher than at the forest site. Ground-based SSA at PVH was around 0.92 year round, showing the dominance of scattering aerosol particles over absorption, even for biomass burning aerosols. Remote sensing observations from six AERONET sites and from MODIS since 1999, provide a regional and temporal overview. Aerosol Optical Depth (AOD) at 550 nm of less than 0.1 is characteristic of natural conditions over Amazonia. At the perturbed PVH site, AOD550 values greater than 4 were frequently observed in the dry season. Combined analysis of MODIS and CERES showed that the mean direct radiative forcing of aerosols at the top of the atmosphere (TOA) during the biomass burning season was −5.6 ± 1.7 W m−2, averaged over whole Amazon Basin. For high AOD (larger than 1) the maximum daily direct aerosol radiative forcing at the TOA was as high as −20 W m−2 locally. This change in the radiation balance caused increases in the diffuse radiation flux, with an increase of Net Ecosystem Exchange (NEE) of 18–29% for high AOD. From this analysis, it is clear that land use change in Amazonia shows alterations of many atmospheric properties, and these changes are affecting the functioning of the Amazonian ecosystem in significant ways.
000 cm−3 in the dry season. An aerosol chemical speciation monitor (ACSM) was deployed in 2013 at both sites, and it shows that organic aerosol account to 81% to the non-refractory PM1 aerosol loading at TT34, while biomass burning aerosols at PVH shows a 93% content of organic particles. Three years of filter-based elemental composition measurements shows that sulphate at the impacted site decreases, on average, from 12% of PM2.5 mass during the wet season to 5% in the dry season. This result corroborates the ACSM finding that the biomass burning contributed overwhelmingly to the organic fine mode aerosol during the dry season in this region. Aerosol light scattering and absorption coefficients at the TT34 site were low during the wet season, increasing by a factor of 5, approximately, in the dry season due to long range transport of biomass burning aerosols reaching the forest site in the dry season. Aerosol single scattering albedo (SSA) ranged from 0.84 in the wet season up to 0.91 in the dry. At the PVH site, aerosol scattering coefficients were 3–5 times higher in comparison to the TT34 site, an indication of strong regional background pollution, even in the wet season. Aerosol absorption coefficients at PVH were about 1.4 times higher than at the forest site. Ground-based SSA at PVH was around 0.92 year round, showing the dominance of scattering aerosol particles over absorption, even for biomass burning aerosols. Remote sensing observations from six AERONET sites and from MODIS since 1999, provide a regional and temporal overview. Aerosol Optical Depth (AOD) at 550 nm of less than 0.1 is characteristic of natural conditions over Amazonia. At the perturbed PVH site, AOD550 values greater than 4 were frequently observed in the dry season. Combined analysis of MODIS and CERES showed that the mean direct radiative forcing of aerosols at the top of the atmosphere (TOA) during the biomass burning season was −5.6 ± 1.7 W m−2, averaged over whole Amazon Basin. For high AOD (larger than 1) the maximum daily direct aerosol radiative forcing at the TOA was as high as −20 W m−2 locally. This change in the radiation balance caused increases in the diffuse radiation flux, with an increase of Net Ecosystem Exchange (NEE) of 18–29% for high AOD. From this analysis, it is clear that land use change in Amazonia shows alterations of many atmospheric properties, and these changes are affecting the functioning of the Amazonian ecosystem in significant ways.
1 Introduction
Amazonia is an excellent laboratory to study atmospheric processes that are characteristic of natural conditions, as they existed prior to the impact of industrialization on the regional and global atmosphere.1 The strong coupling between the atmosphere and the forest can be seen as characteristic of conditions before large-scale deforestation changed land use in Europe, North America, and other regions. Furthermore, the region sustained a strong hydrological cycle that is maintained by large water vapour emissions from the forest as well as cloud condensation nuclei (CCN) produced from forest emissions,2,3 and one important location of deep tropical convection. However, the vast forest–river system of Amazonia is changing due to expansion and intensification of agriculture, logging, and urban footprints.4 Indications that the hydrological cycle in Amazonia is being intensified in the last two decades add a key issue in the changes in Amazonia.5 Recently two strong droughts in 2005 and 2010 have received attention,6,7 as potential indicators of increase in climate extremes in Amazonia that feeds back into the forest carbon processing.8The Brazilian Amazon extends over about 5.5 million km2, corresponding to 61% of the area of the country of Brazil. Deforestation has changed about 18% of the original forest area, mostly in southern and western Amazonia.9 The forests and soils of the Amazon basin also store a large amount of organic carbon (around 200 Pg C), which may potentially be released to the atmosphere through forest to pasture conversion or logging or because of biome changes.10 The river system is responsible for about 20% of the world's freshwater discharge, and this forest–river system is vulnerable to climate change.11 In addition, responses and feedbacks of this biome to changes in climate and land-use could affect regional and global climate.12,13
Human activities in Amazonia over the last 50 years have had a significant impact on a considerable part of the region, especially along the southern perimeter.14 A recent steep decline in annual deforestation rates in the Brazilian Amazon from 27![[thin space (1/6-em)]](https://www.rsc.org/images/entities/char_2009.gif) 800 km2 yr−1 in 2004 to 4660 km2 yr−1 in 2012 is recorded in the time series shown in Fig. 1, as measured by the PRODES (Projeto de Monitoramento do Desflorestamento na Amazônia Legal) program from INPE (The Brazilian National Institute for Space Research) for the Brazilian Amazon. The reduction from 2004 to 2012 observed in Fig. 1 is an impressive achievement, but there are questions if these relatively recent low deforestation rates can be maintained over the next decades,12 because of socio-economic pressures as well as a result of a changing global climate.13,15 The dominant factors of public policies, climate, economic issues, and so forth that successfully contributed to the reduction of deforestation rates in recent years have not been fully dissected. There is also increased uncertainty over the sensitivity of carbon storage in the tropics to climate warming, increasing atmospheric CO2 concentrations, and tropical temperature anomalies.16
800 km2 yr−1 in 2004 to 4660 km2 yr−1 in 2012 is recorded in the time series shown in Fig. 1, as measured by the PRODES (Projeto de Monitoramento do Desflorestamento na Amazônia Legal) program from INPE (The Brazilian National Institute for Space Research) for the Brazilian Amazon. The reduction from 2004 to 2012 observed in Fig. 1 is an impressive achievement, but there are questions if these relatively recent low deforestation rates can be maintained over the next decades,12 because of socio-economic pressures as well as a result of a changing global climate.13,15 The dominant factors of public policies, climate, economic issues, and so forth that successfully contributed to the reduction of deforestation rates in recent years have not been fully dissected. There is also increased uncertainty over the sensitivity of carbon storage in the tropics to climate warming, increasing atmospheric CO2 concentrations, and tropical temperature anomalies.16
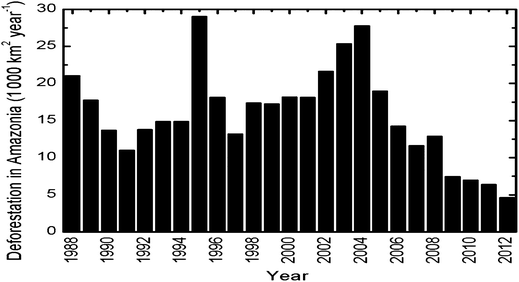 | ||
| Fig. 1 Annual deforestation rates in the Brazilian Amazonia from 1977 to 2012 measured by the PRODES (Projeto de Monitoramento do Desflorestamento na Amazônia Legal) program from INPE (The Brazilian National Institute for Space Research). | ||
The large carbon stock of Amazonia is sensitive to processes that alter precipitation and radiation. The two large droughts of 2005 and 20106,7 released large amounts of carbon to the atmosphere, indicating a high sensitivity of this system to altered conditions. High concentrations of aerosol particles in the atmosphere due to biomass burning decrease the amount of photosynthetically radiation to varying canopy levels, affecting sensible and latent heat fluxes at the surface.17 The changes in radiation flux due to aerosol and clouds and in the ratio of diffuse to direct radiation have a large impact on Net Ecosystem Exchange (NEE), with an enhancement in carbon uptake of 18–29%18 for AOD (Aerosol Optical Depth) changes from 0.1 to 1. At the Tapajos National Forest (FLONA-Tapajos, Santarem-PA), an increase in carbon uptake was mostly attributed to the increased diffuse radiation in the sub-canopy layer.19 On the other hand, for very large aerosol loadings (AOD > 2 at 550 nm), NEE decreases significantly, indicating the large impact of aerosols on ecosystem functioning.18 Studies of effects of aerosol particles on changes in cloud properties and precipitation were the focus of several previous studies in Amazonia.20–25
The Large-scale Biosphere-Atmosphere Experiment in Amazonia (LBA) is a long term multinational, interdisciplinary research program, led by Brazil through its Ministry of Science and Technology and operated by INPA (The Brazilian National Institute for Amazonian Research.8 The focus of LBA is to understand how Amazonia functions as a regional entity in the Earth system and how on-going changes in land use and climate are affecting the Amazonian ecosystem.11 LBA seeks to supply a scientific basis for addressing the sustainability of development in the region through an interdisciplinary scientific agenda, which spans the fields of physical climate, hydrology, biogeochemistry, ecology, economics, and human dimensions of land-use change. The integrated understanding of these complex issues requires understanding its underlying spatial and temporal heterogeneity, as related to climate, rivers, soils, vegetation, and land-use drivers across the Basin. The Amazon forest is heterogeneous and complex, and it is essential to have a comprehensive scientific understanding of the feedbacks among climate, atmospheric composition, land-use, fire, and the socio-economic drivers.12 Atmospheric studies over the Amazonian Basin started in the 1980's with the Brushfire experiment,26 and the ABLE-2A (Amazon Boundary Layer Experiment 2A) and 2B campaigns,27–29 followed by several integrated experiments, such as LBA-EUSTACH,30 LBA-CLAIRE,31 AMAZE-08,32 and others. In general, these studies addressed one or both topics: (1) biomass burning emissions and effects and (2) emissions and reactivity of natural trace gases and biogenic particles.
In the Amazon, fires are almost exclusively caused by humans, and occurrences of natural fires are rare events because of the high precipitation rates even in the dry season.33,34 Fires have been routinely used as a clearing tool during the dry season, in preparation for agricultural fields after a forested patch has been slashed down, or conversion from crops to pasture for cattle grazing. As the amount of precipitation is high, making it difficult to burn the forest, farmers cut down the forest in the end of the wet season (May–June) and let the wood and slash dry until September in order to clear the land for agricultural or pasture use. Every year from September to November, large amounts of smoke can be easily observed using remote sensing observations,35 mainly in the region called the “arc of deforestation” in the southern part of Amazonia, a region where the tropical rainforest is close to more densely populated areas.36 The smoke plume extends over millions of km2, ultimately covering large areas of South America, with significant impacts extending far from the Amazonian region.37–39 In particular, the effects of biomass-burning aerosol particles on human health, such as increased incidences of morbidity, mortality, and asthma, are significant in the region of the so-called deforestation arc.40 Many studies in the last few years have analysed the role of aerosol particles in cloud development and suppression in Amazonia,21,22,41 showing that as pristine conditions have quite low CCN concentrations and high water vapour, any increase in CCN numbers can significantly affect cloud development and invigoration.42
Aerosol mass spectrometry is a powerful tool for characterizing aerosols and their atmospheric processing. In AMAZE-08 (Amazonian Aerosol Characterization Experiment-2008), an Aerodyne high-resolution time-of-flight aerosol mass spectrometer (HR-ToF-AMS) was used for the first time in South America; it was applied to the characterization of Amazonian organic aerosols at a time resolution of better than 5 min.24,32,43 Prior to the AMAZE-08 campaign, the contribution of primary biogenic aerosols to the accumulation mode was less well characterized than that to the coarse mode.44,45 Given that Amazonian aerosols have primary and secondary contributions, marker signals were sought in the collected AMS data. The results showed that primary aerosols in Amazonia consist of carbohydrates, waxes, etc. from biogenic debris, whereas secondary aerosols are oxidation products of isoprene, terpenes, and other VOCs. Furthermore, the mass spectral data were also able to identify time periods influenced by African aerosol advection.46,47 During clean periods, the mass spectra showed the submicron aerosol composition to be dominated by 90% organic matter and 10% sulphate, at average mass concentrations of 0.6 μg m−3. The oxygen-to-carbon (O![[thin space (1/6-em)]](https://www.rsc.org/images/entities/char_2009.gif) :
:![[thin space (1/6-em)]](https://www.rsc.org/images/entities/char_2009.gif) C) ratio was 0.42. When influenced by African emissions, the average composition changed to 75% organic and 25% sulphate, with mass concentration of 0.9 μg m−3 and O
C) ratio was 0.42. When influenced by African emissions, the average composition changed to 75% organic and 25% sulphate, with mass concentration of 0.9 μg m−3 and O![[thin space (1/6-em)]](https://www.rsc.org/images/entities/char_2009.gif) :
:![[thin space (1/6-em)]](https://www.rsc.org/images/entities/char_2009.gif) C of 0.49. The study concluded that submicron aerosol in the wet season of Amazonia was largely dominated by secondary organic aerosol related to gaseous BVOC emissions from the forest flora. Furthermore, Pöhlker et al.,48 added the finding that potassium is present in more than 90% of particles larger than 20 nm, again showing the importance of biogenic forest emissions on SOA formation in the Amazonian atmosphere, and the strong coupling between the biology of the forest and atmospheric composition.24
C of 0.49. The study concluded that submicron aerosol in the wet season of Amazonia was largely dominated by secondary organic aerosol related to gaseous BVOC emissions from the forest flora. Furthermore, Pöhlker et al.,48 added the finding that potassium is present in more than 90% of particles larger than 20 nm, again showing the importance of biogenic forest emissions on SOA formation in the Amazonian atmosphere, and the strong coupling between the biology of the forest and atmospheric composition.24
In pristine regions of Amazonia, the biology of the forest has close links with atmospheric aerosol and trace gases.24,32,44,48,49 Ground based microorganisms could play a role in cloud process in Amazonia,50 since strong convection can transport biogenic particles to the altitudes of cloud formation. Fungi and other primary biological particles also play a role in aerosol organic components in Amazonia.45 Biomass burning and land use change interfere with the natural cycles and feedbacks. To better understand the effects of these changes, it is important to physically and chemically characterize the aerosol population in Amazonia, aiming to identify trends over time and landscape. Forest VOCs emissions51–53 through atmospheric photo-oxidation chemistry produce most of the secondary organic aerosol (SOA) in the fine mode over Amazonia.54–56 Primary biogenic aerosols dominate the coarse mode particles showing the very close relationship between emissions from the vegetation and aerosol concentrations and composition in Amazonia.49,57–59
This paper presents a perspective and analysis of the effects of land use change on atmospheric properties in Amazonia on a long-term basis. Sampling of trace gases and aerosols was performed for 3 years continuously in two locations: a preserved forest site in central Amazonia (TT34) and a biomass burning impacted site in Southwestern Amazonia (PVH), where land use change has been a strong process since the 1980s. Trace gases and aerosol properties were analysed at these two sites from 2008 to 2012. Large inter annual variability in climatic conditions in Amazonia makes long term studies necessary. Also, the effects of changing aerosol loading in the atmosphere were analysed in two aspects: changes in radiative forcing as well as changes in carbon uptake due to increases in diffuse radiation associated with increased aerosol loading.
2 Experimental
2.1 Sampling sites
Amazonia is a continental scale region, with most of the land use change occurring in the southern part of the Basin (Fig. 2). The in situ trace gas and aerosol measurements reported here were taken at two sites: one at a preserved forest area in central Amazonia (named TT34 site hereafter), and the other at a biomass burning impacted area in south western Amazonia (named PVH hereafter).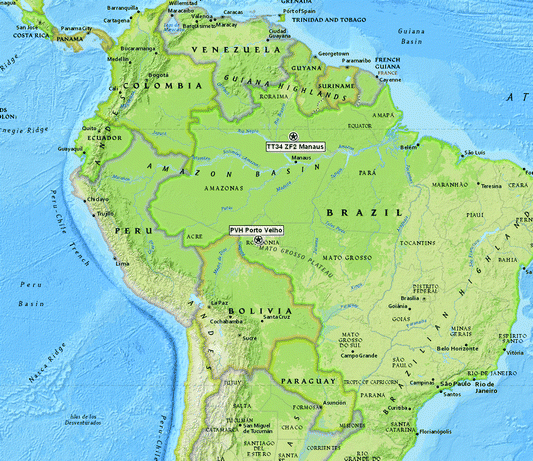 | ||
| Fig. 2 Map of Amazonia showing the locations of the two atmospheric sampling sites at Porto Velho (PVH), and Central Amazonia (TT34) (yellow markers). | ||
The first site (TT34) is representative of near-pristine conditions during the wet season. In this area, from the point of view of aerosol properties, the wet season corresponds to the period Jan–Jun, whereas the dry season corresponds to Jul–Dec.60 This forest site is located 60 km northwest to Manaus urban area, a fast developing city with a population of about 2 million people. Observations were taken at the TT34 tower located at the ZF2 Ecological Station (2.59°S, 60.21°W, 110 m asl), where aerosols and trace gases were measured almost continuously from February 2008 to June 2011. This site is within the INPA (Brazilian National Institute for Amazonian Research) Cuieiras forest reserve. No biomass burning occurs in the reservation or close to the site. Most of the time, the prevailing trade winds blow over vast expanses of intact tropical forest before reaching the measurement tower. However, as will be further discussed, the site was affected by regional transport of pollutants, most of it from long-range transported biomass burning emissions. All measurements were taken under dry conditions (RH 30–40%) by use of an automatic diffusion dryer in the sampling line.61 An inlet with 50% aerodynamic cut-off of 7 μm was used for sampling. Inlet lines ran from the measurement level (39 m agl, about 10 m above the canopy height) to an air-conditioned container at ground level. Housing for the researchers and a diesel generator that provided the power supply were located respectively 0.33 km and 0.72 km to the west of the sampling site (downwind). A detailed description of the ZF2 TT34 tower measurement site and surrounding area can be found in Martin et al.32
The second site (PVH) is located near Porto Velho city, the capital of the state of Rondônia. The sampling site was located in an area of mixed forest and open vegetation in an ecological reservation about 5 km NE (upwind) from the city (8.69°S, 63.87°W). The whole region of Rondônia has been under the effect of land use change since the 1980s. Most of the measurements were taken under relatively dry conditions (RH < 50%) by use of diffusion dryers. An inlet having a 50% aerodynamic cut-off of 10 μm was used for sampling. Inlet lines ran from the measurement level (5 m agl) to an air-conditioned house. This site represents large land use changes and associated regional biomass burning as characteristic of Amazonia in contact with human interferences. At the PVH site, the dry season is from June to December, and the wet season from January to May.
Adding to the ground based in situ measurements, remote sense data from the NASA/AERONET sunphotometers network and from the MODIS satellite sensor were also analysed. Reported AOD observations from AERONET are level 2.0, and data were taken from two sites in southern Amazonia (same region as the PVH site): Abracos Hill (10S; 62W) and Ji-Parana-SE (10S; 61W), and from two sites in central Amazonia (same forest reservation as the TT34 site): Balbina (1S; 59W), and Manaus-EMBRAPA (2S; 59W). AOD observations from MODIS were integrated for an area with 40 km radius around the AERONET measurement sites. MODIS and AERONET data between 1999 and 2012 are analysed in this paper.
2.2 Instrumentation
Measurements of aerosol particle number size distribution, number concentration, mass and elemental composition were made. Two fine mode mobility particle size spectrometers (10–500 nm) were used interchangeably: a TSI-3080 SMPS (Scanning Mobility Particle Sizer) and a custom-made SMPS designed at Lund University according to EUSAAR (European Supersites for Atmospheric Aerosol Research) standards.62 Particle number concentrations were measured using condensation particle counters (TSI CPC models 3010, 3785, 3772). Stacked Filter Units (SFU) fitted with PM10 inlets were used to collect fine mode (Dp < 2.0 μm) and coarse mode (2.0 < Dp < 10.0 μm) aerosols, with integrating periods ranging from 2 to 5 days depending on the aerosol loading. Fine and coarse mode Nuclepore filters were analysed for particulate mass, following the measurement protocol of the US Environmental Protection Agency for weighing filters, in a controlled atmosphere at 35% RH and 20 °C. Equivalent black carbon concentration (BCe) was measured in the fine and coarse mode from Nuclepore filters, using an optical reflectance method calibrated with Monarch black carbon standards. About 25 trace elements were measured using X-ray fluorescence analysis with a Pan Analytical Epsilon 5 X-ray spectrometer. Precision for elemental composition was 10% for most of the measured elements, increasing to 20% for elements close to the detection limits. Ozone mixing ratios were measured with Thermo Environment 49i ozone monitors, while CO was measured with a Picarro analyser model G2301. The zero point of the instruments was checked on a weekly basis.An Aerodyne Research Aerosol Chemical Speciation Monitor (ACSM)63 was deployed at the TT34 (central Amazonia) and PVH (Porto Velho) sites. The ACSM is a compact version of the Aerodyne's Aerosol Mass Spectrometer,64 designed to characterize and monitor, under routine stable operation, the mass and chemical composition of non-refractory submicron particulate matter. Under ambient conditions, mass concentrations of particulate organics, sulphate, nitrate, ammonium, and chloride were obtained with a detection limit < 0.2 μg m−3 for 30 min of signal averaging. Due to the high concentration of organics relative to sulphate, nitrate, chloride and ammonium, especially when sampling strongly biomass burning impacted air masses, corrections to the instrument chemical assignment were performed.65,66
Aerosol particle scattering coefficients were measured using three-wavelength integrating nephelometers (TSI-3563 and Ecotech Aurora 3000).67 The instruments were calibrated periodically using filtered air and CO2. Data were corrected for truncation errors.68 Aerosol particle absorption was measured using MAAP absorption photometers (MultiAngle Absorption Photometry – Thermo Inc., Model 5012).69 The MAAP reports equivalent black carbon (BCe) concentrations at 637 nm, which were converted to absorption coefficients assuming a mass absorption coefficient of 6.6 m2 g−1. A 5% correction was applied to the data to account for an adjustment of wavelength. Pressure and temperature measured inside the nephelometer were used for adjusting scattering and absorption coefficients to 1013 mbar and 0 °C.
3 Aerosol mass, black carbon and elemental composition in Amazonia
Long-term fine and coarse mode aerosol collection with filters allows obtaining mass concentration, black carbon and trace elements, indicating aerosol sources and processes. Fig. 3 shows the time series of fine and coarse mode aerosol mass concentrations at the TT34 forest site from 2008 to 2012. The fine mode concentration in the wet season is quite low (1.3 ± 0.7 μg m−3), and even dry season values with an average of 3.4 ± 2.0 μg m−3 are a low concentration for PM2.5. The mass concentration of coarse mode aerosols, essentially containing biogenic and soil dust aerosols, do not have a strong seasonal dependence, with an average mass concentration of 4.8 ± 2.3 μg m−3. These values are in agreement with previous observations in a location close to TT34 (Balbina, ZF2), between 1998 and 2005.44 No trends in aerosol mass concentrations can be observed in the preserved central Amazonia. The concentrations of equivalent black carbon at the TT34 site have a pronounced seasonal behaviour (Fig. 4), with increased concentrations from August to December due to long-range transport of biomass burning aerosol. There is also a small absorption component in the coarse mode aerosol (average 45 ± 21 ng m−3) due to the absorption characteristics of natural biogenic aerosol particles. The average equivalent BCe fraction in fine mode aerosol is about 7% in central Amazonia, constant for the dry and wet seasons. Table 1 summarizes the average values for aerosol mass and BCe concentrations for fine and coarse mode aerosols for the TT34 central Amazonia site.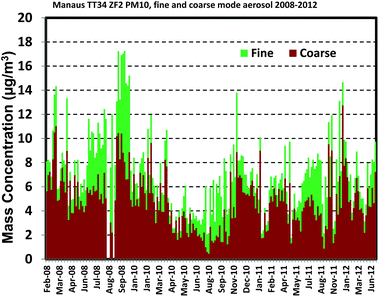 | ||
| Fig. 3 Time series of fine (PM2.5) and coarse mode aerosol mass concentrations at the central Amazonia TT34 forest site from 2008 to 2012. | ||
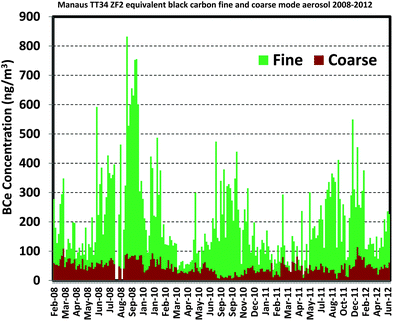 | ||
| Fig. 4 Time series of equivalent black carbon in fine and coarse mode aerosols at the TT34 forest site from 2008 to 2012. The increase in fine mode BC concentrations in the dry season is due to long-range transport of biomass burning aerosol. | ||
| Dry Season | Wet Season | |||||||
|---|---|---|---|---|---|---|---|---|
| Fine Mode | N | Coarse Mode | N | Fine Mode | N | Coarse Mode | N | |
| PM | 3400 ± 2000 | 94 | 4425 ± 2429 | 94 | 1300 ± 700 | 104 | 5000 ± 2000 | 104 |
| BCe | 235 ± 156 | 94 | 41 ± 22 | 94 | 98 ± 83 | 104 | 47 ± 20 | 104 |
| Na | 20 ± 18 | 64 | 28. ± 25 | 66 | 10.0 ± 8.3 | 65 | 26 ± 24 | 79 |
| Mg | 4.6 ± 6.2 | 84 | 8.1 ± 8.8 | 92 | 10 ± 13 | 87 | 13 ± 14 | 94 |
| Al | 18 ± 20 | 96 | 25 ± 25 | 97 | 42 ± 64 | 106 | 44 ± 63 | 100 |
| Si | 27 ± 34 | 95 | 37 ± 37 | 97 | 77 ± 116 | 107 | 85 ± 122 | 103 |
| P | 4.8 ± 3.3 | 97 | 17 ± 12 | 96 | 3.0 ± 1.9 | 110 | 23.0 ± 8.0 | 110 |
| S | 175 ± 114 | 97 | 38 ± 24 | 97 | 74 ± 45 | 110 | 35 ± 16 | 110 |
| Cl | 2.0 ± 1.9 | 46 | 20 ± 25 | 96 | 1.7 ± 1.7 | 70 | 46 ± 57 | 110 |
| K | 74 ± 66 | 97 | 54 ± 30 | 97 | 26 ± 21 | 110 | 68 ± 22 | 110 |
| Ca | 4.9 ± 7.0 | 97 | 13 ± 22 | 97 | 6.1 ± 7.6 | 110 | 14 ± 14 | 110 |
| Ti | 1.5 ± 1.4 | 82 | 2.7 ± 2.5 | 93 | 2.8 ± 4.1 | 100 | 3.4 ± 4.5 | 100 |
| V | 0.2 ± 0.3 | 73 | 0.2 ± 0.3 | 63 | 0.2 ± 0.4 | 73 | 0.1 ± 0.1 | 67 |
| Cr | 0.3 ± 0.4 | 52 | 0.3 ± 0.2 | 76 | 0.2 ± 0.2 | 67 | 0.2 ± 0.2 | 94 |
| Mn | 0.3 ± 0.3 | 83 | 0.4 ± 0.4 | 84 | 0.4 ± 0.5 | 92 | 0.6 ± 0.6 | 97 |
| Fe | 12 ± 12 | 97 | 21 ± 18 | 97 | 20 ± 27 | 105 | 23 ± 31 | 110 |
| Ni | 0.2 ± 0.2 | 74 | 0.1 ± 0.1 | 69 | 0.2 ± 0.3 | 88 | 0.1 ± 0.1 | 68 |
| Cu | 1.3 ± 4.5 | 75 | 0.3 ± 0.9 | 86 | 0.2 ± 0.5 | 89 | 0.2 ± 0.2 | 96 |
| Zn | 1.6 ± 3.6 | 97 | 1.0 ± 1.9 | 92 | 0.4 ± 0.4 | 103 | 0.6 ± 0.5 | 110 |
| Br | 0.7 ± 0.5 | 83 | 0.3 ± 0.3 | 75 | 0.3 ± 0.4 | 81 | 0.3 ± 0.4 | 84 |
| Rb | 0.2 ± 0.3 | 25 | 0.2 ± 0.2 | 26 | 0.2 ± 0.2 | 39 | 0.2 ± 0.1 | 52 |
| Sr | 1.3 ± 1.1 | 15 | 0.6 ± 0.8 | 7 | 1.1 ± 1.2 | 14 | 0.5 ± 0.5 | 14 |
| Sb | 1.5 ± 1.2 | 9 | 1.1 ± 1.1 | 13 | 1.4 ± 0.9 | 15 | 1.0 ± 0.9 | 14 |
| Pb | 0.4 ± 0.5 | 78 | 0.3 ± 0.5 | 63 | 0.4 ± 0.5 | 83 | 0.4 ± 0.6 | 75 |
| BCe/PM (%) | 6.9 ± 7.8 | 94 | 0.9 ± 0.9 | 94 | 7.5 ± 11.8 | 104 | 0.9 ± 1.0 | 104 |
| SO4/PM (%) | 15.4 ± 17.1 | 94 | 2.6 ± 2.9 | 94 | 17.1 ± 19.3 | 104 | 2.1 ± 2.4 | 104 |
Fig. 5 shows the time series of fine and coarse mode aerosol mass concentrations at the PVH site from 2009 to 2012. In 2010, a strong drought in Amazonia significantly increased the smoke emissions from biomass burning (Fig. 5).70 The increase in BCe concentrations in 2010 was likewise significant, as can be seen in Fig. 6, showing the time series of BCe concentrations at the PVH site from 2009 to 2012. BCe concentrations as high as 22 μg m−3 were observed in the fine mode. This plot shows the effects of strong droughts in changing atmospheric properties in Amazonia. The years of 2009, 2011, and 2012, with usual amounts of precipitation in the region, had BCe fine mode concentrations of 2–4 μg m−3. As a matter of comparison, Artaxo et al.39 reported an average fine BCe concentration of 1.8 μg m−3 at a nearby site (Jaru ecological reserve, in the Rondônia state) in the dry season of 1999. Table 2 shows the average fine and coarse mode mass and BCe concentrations at the PVH site. Compared to the TT34 site, we observe that the average fine mode concentration increases by a factor of 10 in the dry season and by a factor of 3 in the wet season, indicating that even in the absence of large scale biomass burning, land use change increases fine mode aerosol concentrations at the impacted southern Amazonia site.
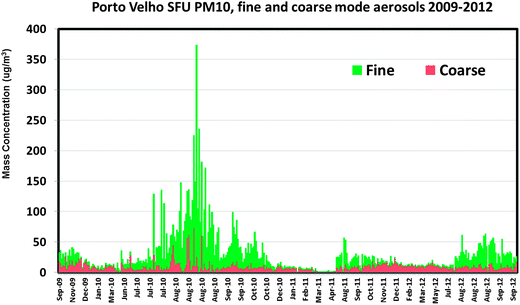 | ||
| Fig. 5 Time series of fine and coarse mode aerosol mass concentrations at the PVH anthropogenic impacted site, from 2009 to 2012. | ||
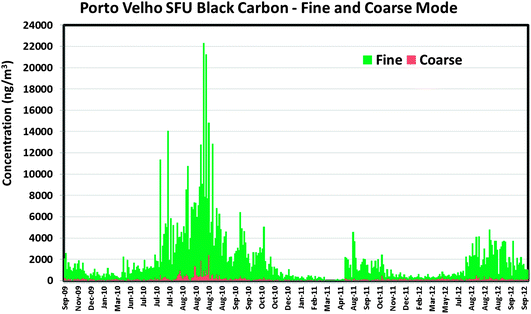 | ||
| Fig. 6 Average aerosol equivalent black carbon BCe concentrations for fine and coarse mode at the PVH impacted site from 2009 to 2012. | ||
| Dry Season | Wet Season | |||||||
|---|---|---|---|---|---|---|---|---|
| Fine Mode | N | Coarse Mode | N | Fine Mode | N | Coarse Mode | N | |
| PM | 33000 ± 36000 | 209 | 10200 ± 9000 | 209 | 3600 ± 4500 | 150 | 8800 ± 5300 | 150 |
| BCe | 2801 ± 2922 | 209 | 222 ± 230 | 209 | 405 ± 369 | 150 | 102 ± 58 | 150 |
| Na | 48 ± 54 | 124 | 44 ± 47 | 120 | 14 ± 22 | 102 | 16 ± 25 | 106 |
| Mg | 32 ± 30 | 67 | 69 ± 144 | 87 | 6.5 ± 6.8 | 61 | 10 ± 17 | 81 |
| Al | 194 ± 166 | 209 | 351 ± 312 | 201 | 29 ± 49 | 150 | 63 ± 94 | 142 |
| Si | 198 ± 166 | 209 | 418 ± 370 | 207 | 38 ± 59 | 150 | 88 ± 118 | 145 |
| P | 19 ± 12 | 209 | 19 ± 17 | 180 | 7.3 ± 6.1 | 150 | 45 ± 31 | 150 |
| S | 568 ± 469 | 209 | 120 ± 138 | 163 | 146 ± 172 | 150 | 55 ± 40 | 150 |
| Cl | 13 ± 18 | 87 | 9.0 ± 10 | 128 | 1.6 ± 2.3 | 20 | 13 ± 13 | 147 |
| K | 506 ± 418 | 209 | 130 ± 124 | 209 | 71 ± 88 | 150 | 121 ± 70 | 150 |
| Ca | 17 ± 14 | 209 | 43 ± 42 | 204 | 4.5 ± 5.6 | 150 | 16 ± 23 | 149 |
| Ti | 15 ± 13 | 209 | 30 ± 26 | 205 | 1.9 ± 3.0 | 150 | 6.0 ± 8.3 | 144 |
| V | 1.5 ± 2.0 | 67 | 1.8 ± 2.6 | 88 | 0.3 ± 0.4 | 82 | 0.2 ± 0.4 | 84 |
| Cr | 4.0 ± 5.1 | 78 | 3.1 ± 4.6 | 124 | 0.8 ± 1.1 | 54 | 0.6 ± 0.9 | 91 |
| Mn | 2.7 ± 3.4 | 119 | 3.1 ± 4.0 | 123 | 0.4 ± 0.6 | 119 | 0.7 ± 0.5 | 127 |
| Fe | 178 ± 150 | 209 | 340 ± 286 | 209 | 27 ± 41 | 150 | 79 ± 95 | 150 |
| Ni | 1.4 ± 2.6 | 75 | 1.2 ± 2.0 | 30 | 0.2 ± 0.2 | 46 | 0.2 ± 0.4 | 27 |
| Cu | 1.8 ± 2.7 | 133 | 1.5 ± 2.2 | 95 | 0.7 ± 2.3 | 129 | 0.4 ± 0.4 | 128 |
| Zn | 3.3 ± 2.5 | 170 | 2.0 ± 2.0 | 139 | 1.0 ± 1.5 | 143 | 1.3 ± 1.8 | 147 |
| Br | 5.9 ± 7.4 | 180 | 3.2 ± 4.0 | 122 | 0.7 ± 0.9 | 115 | 0.5 ± 0.4 | 105 |
| Rb | 2.7 ± 2.9 | 133 | 2.2 ± 3.2 | 139 | 0.3 ± 0.5 | 98 | 0.4 ± 0.4 | 99 |
| Sr | 8.6 ± 14 | 64 | 10 ± 15 | 77 | 1.9 ± 2.5 | 47 | 1.6 ± 1.9 | 52 |
| Sb | 8.5 ± 6.0 | 15 | 20 ± 26 | 27 | 1.6 ± 1.5 | 28 | 2.2 ± 2.8 | 42 |
| Pb | 6.2 ± 9.4 | 142 | 5.9 ± 8.9 | 147 | 1.1 ± 1.2 | 105 | 0.9 ± 1.0 | 93 |
| BCe/PM (%) | 8.5 ± 8.1 | 209 | 2.2 ± 2.6 | 209 | 11.3 ± 8.2 | 150 | 1.2 ± 1.1 | 150 |
| SO4/PM (%) | 5.2 ± 3.9 | 209 | 3.5 ± 4.6 | 163 | 12.2 ± 11.5 | 150 | 1.9 ± 2.3 | 150 |
Sources and atmospheric processes influence the aerosol elemental composition. Therefore, it is expected to observe significant differences in aerosol composition depending on land use change and season. In Amazonia, the inorganic component typically constitutes 10–20% of the fine mode mass, and about 10% of the coarse fraction mass (e.g., Martin et al.44). Tables 1 and 2 show the average aerosol elemental concentrations, respectively, for TT34 and PVH sites, for dry and wet seasons. In the wet season at the TT34 forest site, fine mode sulphur concentrations averaged at a low 74 ± 45 ng m−3, increasing by a factor of 2 in the dry season (Table 1). At the PVH site in the dry season, fine mode sulphur is 8 times higher in comparison to the TT34 site (Table 2). Fine mode sulphur levels observed at the PVH site in the dry season agree with previously reported values for the dry season of 1999 at a nearby site in the state of Rondônia (529 ng m−3, ref. 39). Increased sulphur loading in the dry season is associated with biomass burning emissions. Among inorganic ions, sulphate is the most prominent compound in biomass burning aerosols in Amazonia, according to Yamasoe et al.71 Nevertheless, average PVH sulphate contribution to fine mode mass is greater in the wet season (11.5%) in comparison to the dry season (5.2%). This is associated with the fact that fine biomass burning aerosols show a significantly enhanced organic content, as will be discussed on Section 5.
Concentrations of elements associated with industrial and fossil fuel emissions (Cr, V, Mn, Ni, Pb, and others) were typically very low at <1 ng m−3 at the TT34 site. At the PVH impacted site, these elements are a bit more abundant, particularly in the dry season. Soil dust associated elements, such as Al, Si, Ti, Fe, had relatively low concentrations at the TT34 forest site (<300 ng m−3). This can be explained by the fact that forest soil is covered with a thick layer of plant debris that suppresses local soil dust emission.38,39 The TT34 site receives episodic Sahara dust events during January–May that significantly enhances ground based soil dust elements.46,47 At the PVH site in the dry season, soil dust elements in the fine mode are about 8 times higher in comparison to the TT34 site. A combination of surrounding pasture landscapes, dryer climate and enhanced convection during the biomass burning season explains the increased mineral dust concentrations observed at the impacted PVH site. In the coarse mode, biological trace elements K, P and Zn49,72 were detected in significant concentrations at both sites. No significant seasonal variation was observed in the concentration of inorganic biogenic tracers, suggesting a rather constant biogenic aerosol contribution along the year. The concentration of biogenic tracers in the coarse mode are increased by a factor of 2 at PVH in comparison to TT34, but the proportion of these elements to the coarse mode mass is similar at both sites.
As expected, differences between the two sites regarding aerosol mass and composition is most significant during the dry season, since the PVH site receives greater influence from biomass burning emissions. In the wet season, differences in aerosol properties between the sites are smaller. Even though, aerosol total mass and most element concentrations are increased by a factor of about 2 at PVH in comparison to TT34 during the wet season, indicating the presence of a regional pollution background in southern Amazonia, even in the absence of biomass burning fires.
4 Aerosol number concentrations and submicrometer size distributions
Aerosols occur in the atmosphere with diameters ranging through several orders of magnitude: from nanometres to tenths of micrometres. Characterization of aerosol size distributions is important because the particle size influence aerosol light scattering and absorption as well as cloud droplet activation and impacts on human health. In Fig. 7, we present medians of submicrometer aerosol number size distributions measured at PVH and TT34 sites in 2012 and 2008, respectively, for the dry and wet seasons. The integral of the number size distribution curve provides the aerosol number concentration, which increased by a factor of four at both sites from the wet to the dry season. At the TT34 preserved forest site, the median number concentration was 220 cm−3, almost a factor of three lower than the wet season at the PVH site (680 cm−3). This difference can be explained by the increased regional aerosol loading in southern Amazonia, in agreement with the aerosol scattering (cf. Section 6) and mass (cf. Section 3). In the dry season, aerosol number concentrations reached up to 20![[thin space (1/6-em)]](https://www.rsc.org/images/entities/char_2009.gif) 000 cm−3 at PVH, compared to 2200 cm−3 at TT34.
000 cm−3 at PVH, compared to 2200 cm−3 at TT34.
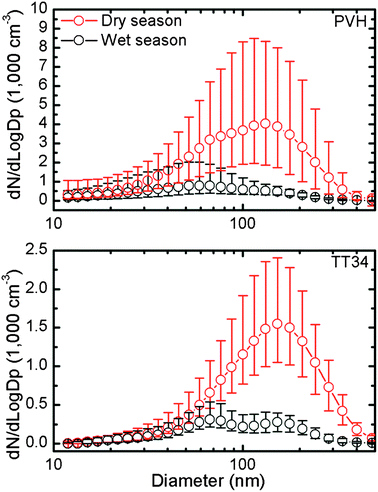 | ||
| Fig. 7 Median of aerosol number size distributions measured at southern Amazonia (PVH) and central Amazonia (TT34). Circles represent median values, and bars represent 10 and 90 percentiles. | ||
In the dry season, the aerosol number size distribution was dominated by the accumulation mode at both sites, corresponding to aged biomass burning aerosols and having mean geometric diameters of 90 nm at PVH and 130 nm at TT34. In the wet season, the accumulation mode and Aitken mode were often separated, showing the so-called Hoppel minimum, separating particles that have been subjected to in-cloud processing from those that have not.32,44 New particle formation and subsequent growth of ultrafine particles were rarely observed. Nevertheless, bursts of ultrafine particles with diameters in the range 10–40 nm were frequently observed at the TT34 site during the wet season, associated with low aerosol absorption coefficients (<4 Mm−1), lower temperatures (<30 °C), and relative humidity above 70%. This result suggests that processes of new particle formation in Amazonia differ from those in coniferous forests of northern Europe.73,74 The coarse mode primary biogenic particles size distribution is centred around 6 micrometres, which is a typical size for primary biological particles, such as fungal spores.24,59
Aerosol size distribution retrievals from AERONET CIMEL sunphotometers operated in the last 10 years in Amazonia presents a bimodal size distribution shown in Fig. 8 for both sites (PVH and TT34) and dry and wet seasons. The accumulation mode median diameter from ground based measurements agree quite well with column integrated values, possibly because strong convection enhances vertical mixing. The coarse mode AERONET size distribution retrievals peak at about 2–3 micrometres (Fig. 8). This value is consistent with fluorescent biological aerosol particles (FBAP) number size distribution measurements using UV-APS fluorescence techniques that peaks at 2.3 μm at TT34 site.59
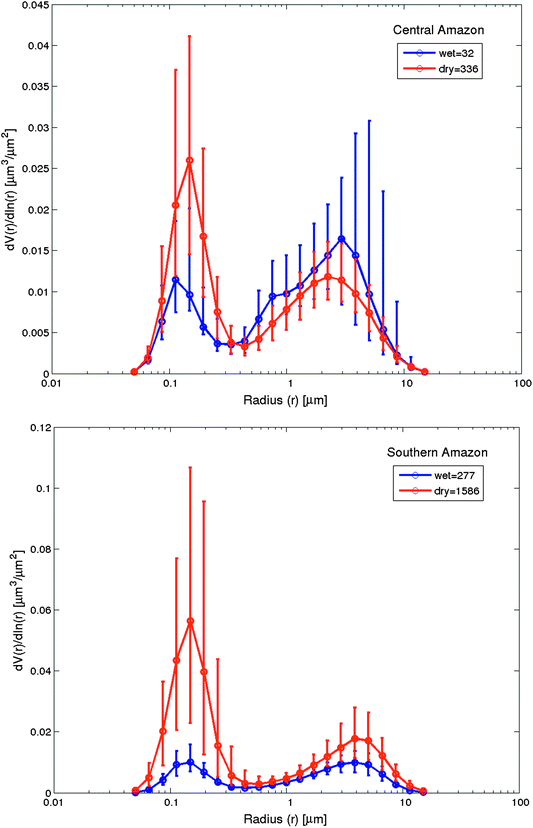 | ||
| Fig. 8 Aerosol size distributions from TT34 (Central Amazonia) (top) and PVH (Southern Amazonia) (bottom) AERONET sites are shown for wet (Jul–Nov, blue) and dry (Dec–Jun, red) seasons. Error bars indicate the 25% and 75% quartiles. The legends show the number of level 2.0 almucantar retrievals. | ||
5 Aerosol mass spectrometry measurements in Amazonia
Aerosol mass spectrometry (AMS) is a valuable tool to measure aerosol composition in real time. ACSMs were recently deployed at the sites in Porto Velho (PVH) and central Amazonia (TT34), with the intention that they begin a multiyear record of data. At the PVH site, the system collected data from 6 to 30 September 2012 during the SAMBBA (South American Biomass Burning Analysis) campaign. This period comprised the transition between the end of the dry season, hereafter named intense biomass burning (BB) period, and the beginning of the wet season for that year (moderate BB period). Based on meteorological data, aerosol composition and optical properties, the date of 25 September was chosen to divide the measurements into distinct periods.An important parameter retrieved using the AMS/ACSM system is the fraction f60 of the organic signal at m/z 60. Given the fragmentation pattern of levoglucosan, mannosan, galactosan, and other pyrolysis by-products of cellulose in the AMS systems, the intensity of f60 is used as a surrogate for regional biomass burning influence.74 An f60 of 0.3% is usually chosen as the threshold value to indicate air masses influenced by BB emissions.75 The aerosol composition for the PVH site is shown in Fig. 9. The f60 value during the intense BB period is on average almost twice the value measured during the moderate BB period (1.0% versus 0.6%). During the intense BB period, the PM1 non-refractory aerosol composition is largely dominated by organic substances (92.9%), with sulphate accounting for only 2.5% of aerosol mass. During the moderate BB period, organic substances accounted for 86% and sulphate for 5.9%, at an average concentration of 4.7 μg m−3. At the central Amazonia TT34 site, the first deployment of the ACSM collected data from 21 February to 1 March 2013 (wet season). Submicron aerosol composition at the TT34 site is shown in Fig. 10. For the studied period, organic substances comprised 81% of mass and sulphate 8.6%, with an average concentration of 0.4 μg m−3, consistent with values obtained during AMAZE-08.43 The f60 parameter was on average 0.2% during the studied period, indicating the absence of an effect of regional biomass burning. Chen et al.43 noted that African biomass burning aerosols are extensively oxidized in long-range transport such that f60 no longer serves as a marker signal in this case.
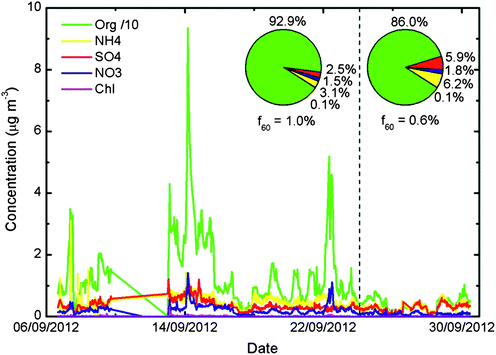 | ||
| Fig. 9 Submicron non-refractory aerosol composition at the PVH site. The studied period of time comprises the end of the dry season, here chosen at 25th September and indicated using a dashed line. The parameter f60 is a surrogate for the contribution of biomass burning on OA (see text for details). The aerosol composition shows a significant enhancement of organics relative to other species due to biomass burning. Average concentration of monitored species prior 25th September 2012 is 13.9 μg m−3, 0.46 μg m−3, 0.37 μg m−3, 0.22 μg m−3 and 0.01 μg m−3 for Org, NH4, SO4, NO3, and Chl, respectively. The non-refractory PM1 aerosol concentration after 25th September yields 4.0 μg m−3, 0.29 μg m−3, 0.27 μg m−3, 0.08 μg m−3 and 0.005 μg m−3 for Org, NH4, SO4, NO3, and Chl, respectively. | ||
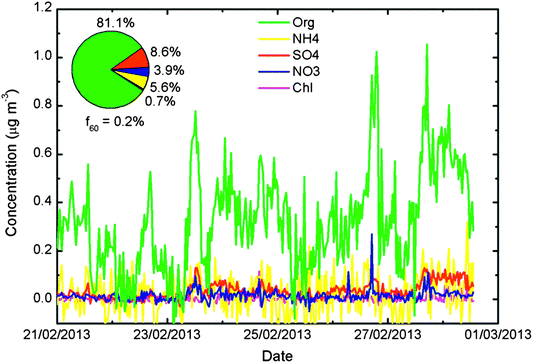 | ||
| Fig. 10 Submicron non-refractory aerosol composition at the TT34 site (central Amazonia) during the wet season. The parameter f60 is a surrogate for the contribution of biomass burning on OA (see text for details). The non-refractory PM1 aerosol concentration after 25th September yields 0.33 μg m−3, 0.02 μg m−3, 0.03 μg m−3, 0.02 μg m−3 and 0.002 μg m−3 for Org, NH4, SO4, NO3, and Chl, respectively. | ||
Previously reported organic contributions to submicron non-refractory PM1 composition of biomass/wood burning emissions range from 97.8% (Pinus ponderosa smoke76), 85% (aircraft measurements over West Africa),74 83% (aircraft measurements over boreal forest in North America,77 60% (aircraft measurements intercepting biomass burning plumes from Russia and Kazakhstan),77 to 42.8% (Serenoa repens smoke76). Considering only ambient measurements, organic substances range from 85% to 60% of PM1, with sulphate as high as 30% in the latter case. At the PVH site, biomass burning significantly enhanced the organic content of the fine aerosol to above 90%. The elemental composition results discussed in Section 3 corroborate this high contribution of organic substances and the corresponding relatively low contribution from sulphate for biomass burning in Amazonia. Results listed in Table 2 indicate a contribution of 11.5% by sulphate in PM2.5 during the wet season and 5.2% on average during the dry season. These changes in aerosol composition have important consequences in many aspects, including the optical properties, as discussed in the following subsection.
6 Aerosol optical properties
Knowledge of aerosol optical properties is important to quantify the direct and indirect effects of aerosols on the radiation balance.78,79 In addition to the light scattering σs(λ) and absorption σa(λ) coefficients, single scattering albedo (SSA) is a critical parameter in the aerosol effects on climate. SSA(λ) is calculated as the scattering coefficient divided by the extinction coefficient (σe(λ) = σs(λ) + σa(λ)); being an intensive aerosol property, it does not depend on particle amount. Fig. 11a and b show the median diurnal cycles of particle scattering and absorption coefficients at PVH and TT34 sites, distinguishing between dry and wet seasons. At the PVH site, the diurnal variability was dominated by the boundary layer dynamics: higher coefficients at night when the atmosphere is stable and thin and lower coefficients during the day when the atmosphere is well mixed and dispersion is favoured. This behaviour was similar in both seasons as a result of the regional pollution background observed at the PVH site all through the year. At the preserved TT34 forest site during the wet season, a different behaviour was observed: the scattering diurnal variability was modulated by the biogenic production of secondary organic aerosols during the day. As discussed in detail by Rizzo et al.,60 a daytime 20% increase in submicrometer particle diameter was observed, which may cause an increase of 50–70% in the scattering coefficients between 9:00 and 12:00 local time. This feature cannot be seen during the dry season, since the regional transport of biomass burning particles overwhelms the biogenic processes.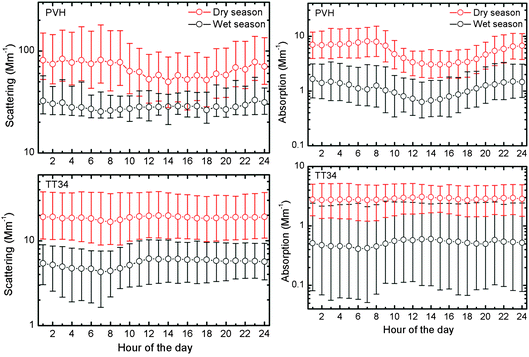 | ||
| Fig. 11 (a) Diurnal cycle of light scattering coefficient σs at 637 nm in Mm−1 in Porto Velho (PVH – top) and Central Amazonia (TT34 – bottom) for the dry (red) and wet (black) seasons from 2009 to 2012. Circles represent median values, and bars represent 10 and 90 percentiles. (b) Diurnal cycle of light absorption coefficient σa at 637 nm in Mm−1 in Porto Velho (PVH – top) and central Amazonia (TT34 – bottom) for the dry (red) and wet (black) seasons from 2009 to 2012. Circles represent median values, and bars represent 10 and 90 percentiles. | ||
Fig. 12 shows monthly statistics for aerosol light scattering (550 nm), absorption (637 nm), and SSA (637 nm). There is an enhancement by a factor of 10 in σs at PVH compared to TT34 for both dry and wet season. This enhancement is another indication that land use change in southern Amazonia is increasing the regional aerosol loading, even in the wet season when biomass burning is suppressed. Concerning aerosol absorption, the difference between Porto Velho and central Amazonia is much smaller throughout the year. In January and February (wet season at both sites), σa was around 1.0 Mm−1. Since there are no biomass burning activities in this period, the observed absorption coefficients at that time are attributed to the so-called “brown carbon”,80i.e., light absorbing biogenic particles.24,60,81 The dry season starts earlier at PVH (May) in comparison to TT34 (July), as depicted in Fig. 12 (absorption in the middle panel). In the wet season, SSA values (Fig. 12 lower panel) are significantly lower at TT34 (SSA = 0.83) compared to PVH (SSA = 0.93). This difference is a result of low aerosol scattering coefficients (driven by low aerosol loadings) combined with relatively high absorption coefficients (driven by the presence of light absorbing biogenic aerosols) at the forest site during the wet season. Low SSA values do not occur in the wet season at PVH because of the higher scattering particle loading in that region. At PVH, a decrease in SSA was observed from September to October, coincident with the decrease of the aerosol organic fraction and an increase of sulphate, as discussed in section 4. This behaviour is at first unexpected, because sulphate aerosols are efficient light scatterers, meaning that increased sulphate content should be associated with higher SSA values. In spite of the fact that some organic compounds may absorb light at shorter wavelengths (<500 nm), acting as brown carbon, they are efficient scatterers with little absorption at longer wavelengths. Since SSA was calculated at 637 nm, higher SSA values in September may be explained by increased light scattering due to organic aerosols released by biomass burning activities.
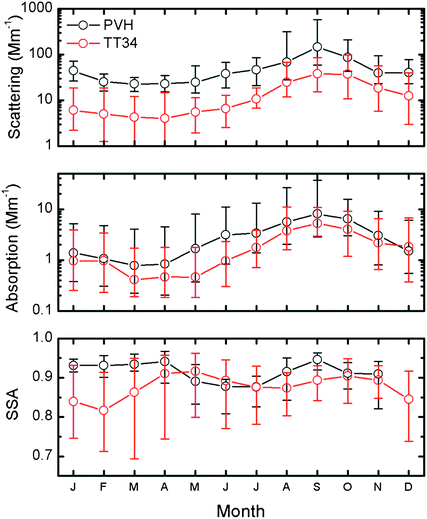 | ||
| Fig. 12 Monthly statistics (2009–2012) for light scattering coefficient σs at 637 nm and light absorption coefficient σa at 637 nm in Mm−1 for Porto Velho (PVH, in black) and central Amazonia (TT34, in red). The bottom plot shows the monthly statistics for the single scattering albedo (SSA) at 637 nm. Circles represent median values, and bars represent 10 and 90 percentiles. | ||
Fig. 13a and b shows the time series of AOD500–550 in central Amazonia (TT34 site) and in southern Amazonia (PVH site) between 1999 and 2012, from both AERONET and MODIS observations. There is an excellent agreement between the AERONET and MODIS datasets, in spite of the different methods used in each AOD retrieval. A strong seasonal variation is evident at both regions. In the preserved central Amazonia, AOD reached up to 1.0 in the dry season, whereas in the impacted southern Amazonia it reached very high values up to 5.0 at 500 nm. These long-term time series plots give an overview of the variable aerosol loading in Amazonia, both from wet to dry seasons and also the large annual variability due to climatic conditions. It is possible to observe that after the deforestation started to get reduced (see Fig. 1) AOD at the PVH site was reduced, but at the strong drought of 2010, smoke has increase significantly compared to 2008 and 2009.
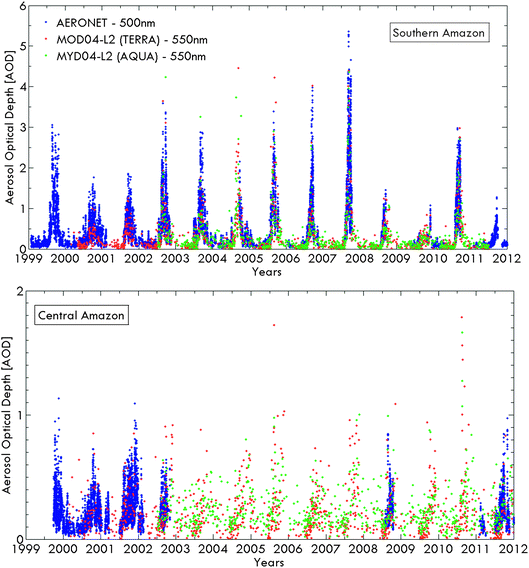 | ||
| Fig. 13 (a) Time series of aerosol optical depth at the PVH site with MODIS (550 nm) and AERONET (500 nm) retrievals from 1999 to 2012. (b) Time series of aerosol optical depth from the central Amazonia TT34 site with MODIS retrievals at 550 nm from 2000 to 2012. | ||
Overall, the seasonal variability of the aerosol optical properties indicates that in the dry season biomass burning particle emissions overwhelm biogenic emissions, significantly changing the physical properties of the natural aerosol population. This increase in particles affects the regional radiation budget, cloud microphysics, and CO2 uptake by the vegetation.18,19,82–84
7 Land use changing trace gas concentrations
Ozone is an important trace gas in Amazonia because it can damage vegetation at high concentrations and is an indicator of photochemical activity. Fig. 14 shows the seasonal variability of median monthly ozone mixing ratios between 13:00 and 16:00 LT in central Amazonia (TT34) and PVH. Ozone mixing ratios are elevated in the dry season of both sites because of biomass burning emissions of precursors (nitrogen oxides and VOCs) and the larger radiation flux and photochemical activity caused by reduced cloud cover. The higher values at mid-day in PVH compared to TT34 are the effect of larger impact of ozone precursors emitted by biomass burning. Fig. 15 shows the diurnal cycle of ozone mixing ratios in Central Amazonia (TT34) for the dry and wet seasons. The ozone mixing ratio goes to low values at nighttime (3 ppb in the wet season and 7 ppb in the dry season), being consumed by vegetation uptake and reaction with NO and VOC from soils and vegetation.85 The dry-season ozone values and diel cycles measured at TT34 are very similar to results obtained in July 1985 in a closed forest at Reserva Ducke and in July 2001 in an open area near the Balbina Reservoir, both in the region north of Manaus.86,87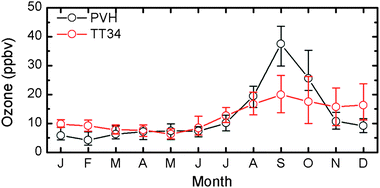 | ||
| Fig. 14 Seasonal variability (2009–2012) of ozone volume mixing ratios in Porto Velho (PVH) and central Amazonia (Manaus TT34 tower). Circles represent median values, and bars represent 10 and 90 percentiles. | ||
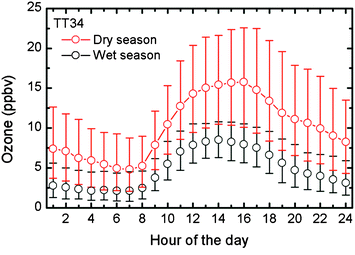 | ||
| Fig. 15 Diurnal cycle of ozone volume mixing ratios in central Amazonia (TT34) for the dry (red curve) and wet seasons (black curves) from 2009 to 2012. Circles represent median values, and bars represent 10 and 90 percentiles. | ||
Ozone measurements in Rondônia have been made previously at sites in a closed rainforest and on a cattle pasture about 250 km SE of Porto Velho.30,85 Midday maxima above the canopy were about 15 ppb in the wet season and 50 ppb in the dry season at both sites. At night, ozone decreased to around 6 ppb at the forest site and 10 ppb at the pasture site. The elevated values of ozone over Rondônia as compared to those over the Central Amazon are the result of much higher pollution levels resulting from land use change in the arc of deforestation at the southern perimeter of the Amazon Basin.
These elevated pollution burdens can readily be seen by comparing the levels of carbon monoxide, which is one of the best tracers for biomass burning emissions.88Fig. 16 shows the carbon monoxide monthly medians for central Amazonia (TT34) and Porto Velho (PVH). Unfortunately, there is no continuous CO data for the two sites. The average CO mixing ratio in central Amazonia is about 130 ppb. This can be compared to about 400 ppb CO in Porto Velho during the dry season due to biomass burning emissions. The lower plot in Fig. 16 shows the diurnal variability of CO mixing ratios at PVH, clearly dominated by the atmospheric boundary layer dynamics: CO accumulation at night due to lower boundary layer height and minimum CO mixing ratios at 15:00 LT when the boundary layer is well mixed.
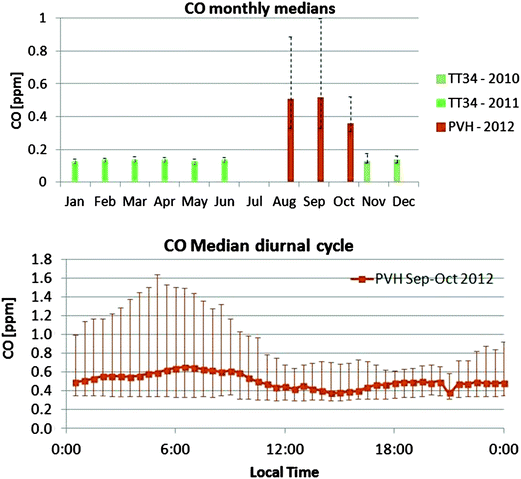 | ||
| Fig. 16 Carbon monoxide monthly medians for central Amazonia (TT34) and Porto Velho (PVH), together with diurnal variability of CO in PVH during the dry season. | ||
8 Interactions between carbon cycle and aerosols
Amazonia is a large reservoir of carbon that can be quickly mobilized to the atmosphere through deforestation, changes in the radiation balance, in precipitation patterns, or in climate.9 The increase in atmospheric aerosol loading increases the ratio of diffuse to direct radiation.18,89 Forests show an increase in carbon uptake with an increase in diffuse radiation due to the larger canopy penetration of the scattered solar radiation.17,19 In order to quantify this effect, AOD measurements from the MODIS (Moderate Resolution Imaging Spectroradiometer) sensor (on board the TERRA and AQUA satellites), were validated with AOD measurements from the NASA/AERONET network of sun photometers, and compared to Net Ecosystem Exchange (NEE) variations. Daily averages of AOD were taken based on the MODIS MOD/MYD_04_L2 product. Two forest sites were studied during the dry season (Aug–Sep): the Jaru biological reservation site in southern Amazonia (corresponding to the same region as the PVH site), between 1999 and 2002, and the Cuieiras reservation K34 tower in central Amazonia (1 km away from the TT34 tower site), between 1999 and 2009. Carbon fluxes were measured using eddy-correlation techniques.90 NEE was calculated according to the relationship NEE = Fc + Stg,90,91 where Fc is the turbulent flux of CO2 above the canopy, and Stg is the non-turbulent storage term, defined as the temporal variation of the CO2 concentration measured in a vertical profile from the soil surface to the height of eddy correlation measurements.Fig. 17 shows the effects of aerosols on carbon uptake expressed as NEE in central Amazonia and in southern Amazonia. In southern Amazonia, a 29% increase in carbon uptake (NEE) was observed when the AOD increased from 0.10 to 1.5. In central Amazonia, the effect is smaller, being approximately an increase of 20% of the NEE compared to clean conditions. The increase of 29% and 20% in NEE is attributed mainly to an increase (50%) in the PAR (photosynthetically active radiation) diffuse radiation flux. Oliveira et al.18 observed a similar increase in NEE of about 18% at the southern Amazonian site for a reduction of 70% of clear-sky irradiance. For even higher aerosol loadings in the atmosphere (AOD > 2), leading to strong reductions of solar radiation flux, Oliveira et al.18 reported that the photosynthetic process is almost shut down, with NEE values close to zero. Considering long-range transport of biomass burning aerosols in Amazonia, changes in NEE may occur over large areas in Amazonia, modifying the potential for forest ecosystems to absorb atmospheric CO2. Previous studies at other sites in Amazonia19 have shown similar NEE enhancements, but the use of MODIS to obtain AOD allows for the determination of NEE changes in regions where AERONET sun photometers measurements are not available.
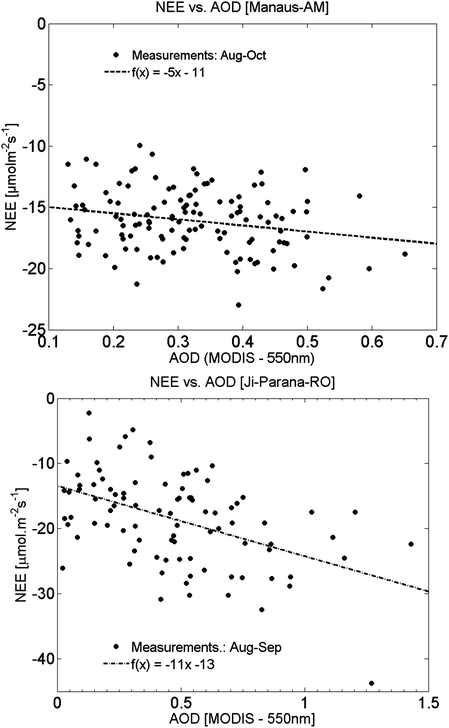 | ||
| Fig. 17 Effects of aerosols on carbon uptake expressed as Net Ecosystem Exchange (NEE) at central Amazonia (nearby the TT34 forest preserved site), and at southern Amazonia (same region as the PVH impacted site). Data points refer to daily averages in the dry season (Aug–Sep), between 1999–2009 (TT34) and between 1999–2002 (PVH). | ||
9 Large scale radiative forcing of aerosols and surface albedo change
Aerosol particles scatter and absorb solar radiation directly, affecting the Earth's radiation budget and modifying the atmospheric temperature profile.78 Because aerosol particles act as cloud condensation nuclei, aerosols and clouds are intrinsically coupled through processes that control cloud formation and development, spatial coverage, lifetime, and precipitation efficiency.92–95 Anthropogenic increases in aerosol particles modify cloud microphysical properties by decreasing the average cloud droplet size, because more particles are sharing the same amount of liquid water. This reduction affects the atmospheric energy balance since the larger number of smaller droplets reflects more incoming solar radiation back to space than fewer, larger droplets.96 The radiative forcing due to the indirect effect of aerosols on cloud albedo presents the highest uncertainty of all climate-forcing mechanisms reported in the Fourth IPCC assessment.78 Furthermore, the impact of aerosol particles on the precipitation rate remains a topic of much debate. Some studies suggest that increases in aerosol loading decrease the rain rate from convective clouds,94,97,98 while others claim the opposite.84,99,100 The actual response of convective clouds to increasing aerosol loadings is most likely a non-monotonic function with a maximum at intermediate aerosol concentrations.95The presence of absorbing aerosols in the atmosphere can enhance dissipation of cloud droplets, decreasing cloud cover, an effect called the semi-indirect effect of aerosols. It has been observed21,23 and simulated41 for clouds over the Amazon forest in the presence of smoke aerosols. Koren et al.23 showed that there is a competing effect between the microphysical effects and aerosol absorption in the Amazonia: smoke aerosols can either invigorate clouds, increasing cloud fraction and height due to an increase in the cloud droplet concentration, or alternatively inhibit cloud development due to aerosol absorption within the cloud.
The direct radiative forcing (DRF) of biomass burning aerosols over Amazonia has been assessed using ground-based instruments, airborne measurements or satellite remote sensing.79,101,102 Biomass burning aerosols can be transported over long distances and therefore have a large-scale impact on the radiative balance over the Amazon Basin. Simultaneous retrievals of the flux at the top of the atmosphere (TOA) and AOD, obtained by the CERES (Clouds and the Earth's Radiant Energy System) and MODIS (Moderate Resolution Imaging Spectro Radiometer) sensors aboard the Terra and Aqua satellites, have been used to assess the DRF at the TOA with high spatial coverage.79,102 A similar approach was used to evaluate the spatial distribution of the 24 h-average direct radiative forcing (DRF) of biomass burning aerosols at the TOA during the Amazonian dry season (August to October) of 2010, a year during which a severe drought affected the whole region (Fig. 18).
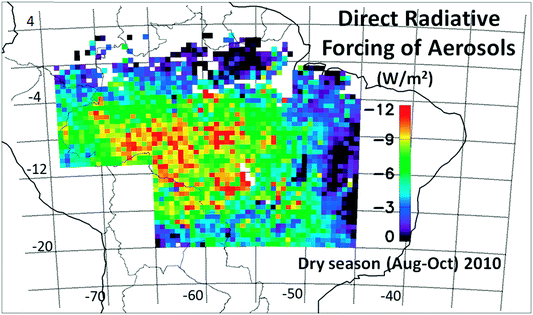 | ||
| Fig. 18 Average spatial distribution of the direct radiative forcing (DRF) of biomass burning aerosols in Amazonia during the dry season (August to October) of 2010. Forcing derived from calculations using a combination of MODIS and CERES sensors data. During this three-month period, the daily-average radiative forcing of aerosols for the whole area was on average −5.3 ± 0.1 W m−2. | ||
Fig. 18 indicates that during the dry season the aerosol DRF presents high spatial variability, with significant impacts over central and south-western Amazonia, where the aerosol DRF reached average values down to −12 W m−2. In the region of the PVH site, the DRF was on average −10 W m−2. Central Amazonia shows much lower DRF absolute values, varying from about 0 to −3 W m−2 near the TT34 forest site. Several factors contribute to these heterogeneities in the DRF spatial distribution, such as the location of fire sources in the arc of deforestation (southern Amazonia), the predominantly east–west wind pattern during the period, and the high cloudiness and precipitation rate in central Amazonia. During this three-month period, the daily-average radiative forcing of aerosols for the whole area was on average −5.3 ± 0.1 W m−2.
The replacement of tropical forests by croplands and pastures also increases the broadband surface albedo, modifying the radiative balance over the deforested area. In a recent paper, Sena et al.79 reported the first estimate for the clear-sky land-use change radiative forcing (LURF) due to deforestation in Amazonia. Using remote sensing, the authors obtained a value of −7.3 ± 0.9 W m−2 for the annual average LURF over Rondônia, the state in which the PVH site is located. This finding is very important because changes in surface albedo affect the radiative budget throughout the year, while the impact of aerosols in Amazonia is most significant only during the biomass-burning season, which lasts about two to three months. Therefore, the impact of surface albedo change is about 6–7 times higher than the impact of aerosols in the annual energy balance in Amazonia. Deforestation also reduces evapotranspiration, decreasing the column water vapour (CWV) by about 6–10%.79,103 As water vapour is a greenhouse gas, this decrease in CWV over the deforested area further contributes to cooling, with a reduction at the radiative flux at the TOA of the order of −0.4 to −1.2 W m−2.79
10 Conclusions
Aerosol physical and chemical properties were monitored along 4 years of measurements in two different regions in the Amazon Basin: central Amazonia, enclosing the TT34 preserved forest site, and southern Amazonia, enclosing the PVH site highly impacted by biomass burning and land use change. Significant seasonal variations were observed on aerosol mass and number concentrations at both regions, as well as in black carbon equivalent concentration. Seasonal variations were attributed to biomass burning emissions, which are long range transported and widespread in the Amazon Basin during the dry season. Reduction on precipitation and on aerosol deposition rates during the dry season also plays an important role on changing the atmospheric properties across Amazonia.Significant differences were observed between the TT34 and PVH sites. Central Amazonia during the wet season showed to be one of the cleanest continental areas worldwide, with aerosol number concentrations in the range of 300–500 cm−3. In contrast, we observed that the southern Amazonian region shows important changes in atmospheric composition and aerosol loading even in the wet season, indicating the existence of a regional pollution haze associated with land use changes that have been taking place in the last decades.
New findings were provided by the recently deployed ACSM (Aerosol Chemical Speciation Monitor), indicating that biomass burning emissions significantly enhanced the organic content of the fine aerosol to above 90%, reducing the contribution of inorganic species like sulphate to the fine mode aerosol mass (from 11.5% in the wet season to 5.2% in the dry season at the PVH site). Long term measurements of aerosol mass spectra in high time resolution are planned for the next years in Amazonia, and will help to fill gaps related to sources and dynamical processes of aerosols in the Amazon Basin.
Remotely sensed aerosol properties in the Amazon Basin indicated that land use change in Amazonia significantly alters aerosol loading as well as radiation balance and carbon uptake by the forest. The observed changes in the radiation balance were significant, with radiation flux reductions of down to −20 W m−2 over large regions. The increase in diffuse radiation resulting from moderate increases in aerosol loading (AOD from 0.1 to 1.2 at 550 nm) affects the carbon balance in tropical regions by increasing NEE. A further increase (AOD > 1.3) produces a sharp decrease in carbon uptake due to the reduction in solar radiation flux at the surface, according to Oliveira et al.18
In addition to biomass burning, urbanization is on the rise in Amazonia. The GoAmazon 2014–2015 experiment will analyse the impacts of the urban plume of Manaus on the atmospheric chemistry downwind of the city.104 Changes in cloud properties and precipitation will also be analysed in the GoAmazon experiment. A very clean site, the Amazon Tall Tower Observatory (ATTO) is being constructed north of Manaus in a very remote region, and will be a long-term observatory for trace gases and aerosols, as well as a platform to study biosphere–atmosphere interactions in pristine central Amazonia.
Acknowledgements
We would like to thank the INPA LBA central office in Manaus for logistical support for the operation of the TT34 site. This research was funded by the FAPESP projects 2008/58100-2, 2010/52658-1, 2011/50170-4, 2012/14437-9 and CNPq project 475735-2012-9, INCT Amazonia, the FP6 project EUCAARI (Contract 34684), and the Max Planck Society. We thank Eric Swietlicki, Alfred Wiedensohler and Markku Kulmala for support at the central Amazonia ZF2 site. We thank Sandra Hacon (FIOCRUZ), Fernando Morais (IFUSP), Alcides C. Ribeiro (IFUSP), Ana L. Loureiro (IFUSP), Fábio de Oliveira Jorge (IFUSP), Lívia Oliveira (INPA) and Joiada Silva (UNIR-Porto Velho) for technical support and help in keeping the sites fully operational.References
- M. O. Andreae, Aerosols before pollution, Science, 2007, 315, 50–51 CrossRef CAS PubMed.
- M. A. F. Silva Dias, S. Rutledge, P. Kabat, P. L. Silva Dias, C. Nobre, G. Fisch, A. J. Dolman, E. Zipser, M. Garstang, A. Manzi, J. D. Fuentes, H. Rocha, J. Marengo, A. Plana-Fattori, L. Sá, R. Alvalá, M. O. Andreae, P. Artaxo, R. Gielow and L. V. Gatti, Clouds and rain processes in a biosphere atmosphere interaction context in the Amazon Region, J. Geophys. Res., 2002, 107(D20), 8072–8092 CrossRef.
- R. A. Betts, P. M. Cox, M. Collins, P. P. Harris, C. Huntingford and C. D. Jones, The role of ecosystem-atmosphere interactions in simulated Amazonian precipitation decrease and forest dieback under global climate warming, Theo. Appl. Clim., 2004, 78, 157–175 Search PubMed.
- B. S. Soares-Filho, D. C. Nepstad, L. M. Curran, G. C. Cerqueira, R. A. Garcia, C. A. Ramos, E. Voll, A. McDonald, P. Lefebvre and P. Schlesinger, Modeling conservation in the Amazon Basin, Nature, 2006, 440, 520–523 CrossRef CAS PubMed.
- M. Gloor, R. J. W. Brienen, D. Galbraith, T. R. Feldpausch, J. Schöngart, J.-L. Guyot, J. C. Espinoza, J. Lloyd and O. L. Phillips, Intensification of the Amazon hydrological cycle over the last two decades, Geophys. Res. Lett., 2013, 40, 1–5, DOI:10.1002/grl.50377.
- J. A. Marengo, C. A. Nobre, J. Tomasella, M. F. Cardoso and M. D. Oyama, Hydro-climatic and ecological behaviour of the drought of Amazonia in 2005, Philos. Trans. R. Soc. London, Ser. B, 2008, 363, 1773–1778 CrossRef CAS PubMed.
- J. A. Marengo, J. Tomasella, L. M. Alves, W. R. Soares and D. A. Rodriguez, The drought of 2010 in the context of historical droughts in the Amazon region, Geophys. Res. Lett., 2011, 38, L12703 CrossRef.
- E. A. Davidson and P. Artaxo, Globally significant changes in biological processes of the Amazon Basin: results of the Large-scale Biosphere-Atmosphere Experiment, Global Change Biol., 2004, 10, 519–529 CrossRef.
- J. P. Ometto, A. D. Nobre, H. R. Rocha, P. Artaxo and L. A. Martinelli, Amazonia and the modern carbon cycle: lessons learned, Oecologia, 2005, 143(4), 483–500 CrossRef PubMed.
- Y. Malhi, J. T. Roberts, R. A. Betts, T. J. Killeen, W. H. Li and C. A. Nobre, Climate change, deforestation, and the fate of the Amazon, Science, 2008, 319, 169–172 CrossRef CAS PubMed.
- C. Nobre, J. Marengo and P. Artaxo, Understanding the climate of Amazonia: Progress from LBA, in: Amazonia and Global Change, ed. M. Keller, M. Bustamante, J. Gash and P. S. Dias, American Geophysical Union, Geophysical Monograph, 2009, vol. 186, pp. 147–150, ISBN: 978-0-87590-449-8 Search PubMed.
- E. A. Davidson, A. C. de Araújo, P. Artaxo, J. K. Balch, I. F. Brown, M. M. da C. Bustamante, M. T. Coe, R. S. DeFries, M. Keller, M. Longo, J. W. Munger, W. Schroeder, B. S. Soares-Filho, C. M. Souza Jr. and S. C. Wofsy, The Amazon Basin in Transition, Nature, 2012, 481, 321–328 CrossRef CAS PubMed.
- C. Huntingford, P. Zelazowski, D. Galbraith, L. M. Mercado, S. Sitch, R. Fisher, M. Lomas, A. P.Walker, C. D. Jones, B. B. B. Booth, Y. Malhi, D. Hemming, G. Kay, P. Good, S. L. Lewis, O. L. Phillips, O. K. Atkin, J. Lloyd, E. Gloor, J. Zaragoza-Castells, P. Meir, R. Betts, P. P. Harris, C. Nobre, J. Marengo and P. M. Cox, Simulated resilience of tropical rainforests to CO2-induced climate change, Nat. Geosci., 2013, 6, 268–273 CrossRef CAS.
- P. Artaxo, W. Maenhaut, H. Storms and R. Van Grieken, Aerosol characteristics and sources for the Amazon basin during the wet season, J. Geophys. Res., 1990, 95(D10), 16971–16985 CrossRef.
- P. Artaxo, Reductions in deforestation rates in Amazonia, Global Atmospheric Pollution Forum Newsletter, 2010, 8, 2–3 Search PubMed.
- P. M. Cox, D. Pearson, B. B. Booth, P. Friedlingstein, C. Huntingford, C. D. Jones and C. M. Luke, Sensitivity of tropical carbon to climate change constrained by carbon dioxide variability, Nature, 2013, 494, 341–344 CrossRef CAS PubMed.
- M. A. Yamasoe, C. von Randow, A. O. Manzi, J. S. Schafer, T. F. Eck and B. N. Holben, Effect of smoke and clouds on the transmissivity of photosynthetically active radiation inside the canopy, Atmos. Chem. Phys., 2006, 6, 1645–1656 CrossRef CAS.
- P. H. F. Oliveira, P. Artaxo, C. Pires Jr, S. de Lucca, A. Procópio, B. Holben, J. Schafer, L. F. Cardoso, S. C. Wofsy and H. R. Rocha, The effects of biomass burning aerosols and clouds on the CO2 flux in Amazonia, Tellus, Ser. B, 2007, 59B(3), 338–349 CrossRef CAS.
- C. E. Doughty, M. G. Flanner and M. L. Goulden, Effect of smoke on subcanopy shaded light, canopy temperature, and carbon dioxide uptake in an Amazon rainforest, Global Biogeochem. Cycles, 2010, 24, GB3015 CrossRef.
- M. O. Andreae, D. Rosenfeld, P. Artaxo, A. A. Costa, G. P. Frank, K. M. Longo and M. A. F. Silva-Dias, Smoking rain clouds over the Amazon, Science, 2004, 303(5662), 1337–1342 CrossRef CAS PubMed.
- I. Koren, Y. J. Kaufman, L. A. Remer and J. V. Martins, Measurement of the effect of Amazon smoke on inhibition of cloud formation, Science, 2004, 303, 1342–1345 CrossRef CAS PubMed.
- I. Koren, Y. J. Kaufman, D. Rosenfeld, L. A. Remer and Y. Rudich, Aerosol invigoration and restructuring of Atlantic convective clouds, Geophys. Res. Lett., 2005, 32, L14828 CrossRef.
- I. Koren, J. V. Martins, L. A. Remer and H. Afargan, Smoke invigoration versus inhibition of clouds over the Amazon, Science, 2008, 321, 946–949 CrossRef CAS PubMed.
- U. Pöschl, S. T. Martin, B. Sinha, Q. Chen, S. S. Gunthe, J. A. Huffman, S. Borrmann, D. K. Farmer, R. M. Garland, G. Helas, J. L. Jimenez, S. M. King, A. Manzi, E. Mikhailov, T. Pauliquevis, M. D. Petters, A. J. Prenni, P. Roldin, D. Rose, J. Schneider, H. Su, S. R. Zorn, P. Artaxo and M. O. Andreae, Rainforest aerosols as biogenic nuclei of clouds and precipitation in the Amazon, Science, 2010, 329, 1513–1516 CrossRef PubMed.
- A. J. Prenni, M. D. Petters, S. M. Kreidenweis, C. L. Heald, S. T. Martin, P. Artaxo, R. M. Garland, A. G. Wollny and U. Poeschl, Relative roles of biogenic emissions and Saharan dust as ice nuclei in the Amazon basin, Nat. Geosci., 2009, 2, 402–405 CrossRef CAS.
- P. J. Crutzen, A. C. Delany, J. P. Greenberg, P. Haagenson, L. Heidt, R. Lueb, W. Pollock, W. Seiler, A. F. Wartburg and P. R. Zimmerman, Tropospheric chemical composition measurements in Brazil during the dry season, J. Atmos. Chem., 1985, 2, 233–256 CrossRef CAS.
- R. C. Harriss, S. C. Wofsy, M. Garstang, E. V. Browell, L. C. B. Molion, R. J. McNeal, J. M. Hoell, R. J. Bendura, S. M. Beck, R. L. Navarro, J. T. Riley and R. L. Snell, The Amazon Boundary-Layer Experiment (ABLE-2A) - dry season 1985, J. Geophys. Res., 1988, 93, 1351–1360 CrossRef.
- R. C. Harriss, M. Garstang, S. C. Wofsy, S. M. Beck, R. J. Bendura, J. R. B. Coelho, J. W. Drewry, J. M. Hoell, P. A. Matson, R. J. McNeal, L. C. B. Molion, R. L. Navarro, V. Rabine and R. L. Snell, The Amazon Boundary-Layer Experiment - Wet Season 1987, J. Geophys. Res., 1990, 95, 16721–16736 CrossRef.
- M. O. Andreae, E. V. Browell, M. Garstang, G. L. Gregory, R. C. Harriss, G. F. Hill, D. J. Jacob, M. C. Pereira, G. W. Sachse, A. W. Setzer, P. L. S. Dias, R. W. Talbot, A. L. Torres and S. C. Wofsy, Biomass-burning emissions and associated haze layers over Amazonia, J. Geophys. Res, 1988, 93, 1509–1527 CrossRef CAS.
- M. O. Andreae, S. S. de Almeida, P. Artaxo, C. Brandão, F. E. Carswell, P. Ciccioli, A. Culf, J. L. Esteves, J. Gash, J. Grace, P. Kabat, J. Lelieveld, Y. Malhi, A. O. Manzi, F. X. Meixner, A. Nobre, C. Nobre, M. A. L. Ruivo, M. A. Silva-Dias, P. Stefani, R. Valentini, J. von Jouanne and M. Waterloo, Biogeochemical cycling of carbon, water, energy, trace gases and aerosols in Amazonia: The LBA-EUSTACH experiments, J. Geophys. Res., 2002, 107(D20), 8066–8091 CrossRef.
- P. Formenti, M. O. Andreae, L. Lange, G. Roberts, J. Cafmeyer, I. Rajta, W. Maenhaut, B. N. Holben, P. Artaxo and J. Lelieveld, Saharan dust in Brazil and Suriname during the Large-Scale Biosphere-Atmosphere Experiment in Amazonia (LBA) - Cooperative LBA Regional Experiment (CLAIRE) in March 1998, J. Geophys. Res., 2001, 106, 14919–14934 CrossRef CAS.
- S. T. Martin, M. O. Andreae, D. Althausen, P. Artaxo, H. Baars, S. Borrmann, Q. Chen, D. K. Farmer, A. Guenther, S. S. Gunthe, J. L. Jimenez, T. Karl, K. Longo, A. Manzi, T. Pauliquevis, M. D. Petters, A. J. Prenni, U. Pöschl, L. V. Rizzo, J. Schneider, J. N. Smith, E. Swietlicki, J. Tota, J. Wang, A. Wiedensohler and S. R. Zorn, An overview of the Amazonian Aerosol Characterization Experiment 2008 (AMAZE-08), Atmos. Chem. Phys. Discuss., 2010b, 10, 18139–18195 Search PubMed.
- P. J. Crutzen and M. O. Andreae, Biomass burning in the tropics: Impact on atmospheric chemistry and biogeochemical cycles, Science, 1990, 250, 1669–1678 CAS.
- D. Bowman, J. Balch, P. Artaxo, W. Bond, M. Cochrane, C. D'Antonio, R. DeFries, F. Johnston, J. Keeley, M. Krawchuk, C. Kull, M. Mack, M. Moritz, S. Pyne, C. Roos, A. Scott, N. Sodhi and T. Swetnam, The human dimension of fire regimes on Earth, J. Biogeogr., 2011, 38, 2223–2236 CrossRef PubMed.
- M. O. Andreae, Global distribution of fires seen from space, EOS, Trans. Am. Geophys. Union, 1993, 74(12), 129–144 CrossRef.
- S. Fuzzi, S. Decesari, M. C. Facchini, F. Cavalli, L. Emblico, M. Mircea, M. O. Andreae, I. Trebs, A. Hoffer, P. Guyon, P. Artaxo, L. V. Rizzo, L. L. Lara, T. Pauliquevis, W. Maenhaut, N. Raes, X. G. Chi, O. L. Mayol-Bracero, L. L. Soto-Garcia, M. Claeys, I. Kourtchev, J. Rissler, E. Swietlicki, E. Tagliavini, G. Schkolnik, A. H. Falkovich, Y. Rudich, G. Fisch and L. V. Gatti, Overview of the inorganic and organic composition of size-segregated aerosol in Rondonia, Brazil, from the biomass-burning period to the onset of the wet season, J. Geophys. Res., 2007, 112, D01201 CrossRef.
- M. O. Andreae, P. Artaxo, H. Fischer, S. R. Freitas, J. M. Gregoire, A. Hansel, P. Hoor, R. Kormann, R. Krejci, L. Lange, J. Lelieveld, W. Lindinger, K. Longo, W. Peters, M. de Reus, B. Scheeren, M. Dias, J. Strom, P. F. J. van Velthoven and J. Williams, Transport of biomass burning smoke to the upper troposphere by deep convection in the equatorial region, Geophys. Res. Lett., 2001, 28, 951–954 CrossRef CAS.
- P. Artaxo, H. Storms, F. Bruynseels, R. Van Grieken and W. Maenhaut, Composition and sources of aerosols from the Amazon Basin, J. Geophys. Res., 1988, 93, 1605–1615 CrossRef CAS.
- P. Artaxo, J. V. Martins, M. A. Yamasoe, A. S. Procópio, T. M. Pauliquevis, M. O. Andreae, P. Guyon, L. V. Gatti and A. M. C. Leal, Physical and chemical properties of aerosols in the wet and dry season in Rondônia, Amazonia, J. Geophys. Res., 2002, 107(D20), 8081–8095 CrossRef.
- E. Ignotti, J. G. Valente, K. M. Longo, S. R. Freitas, S. S. Hacon and P. Artaxo, Impact on human health of particulate matter emitted from burnings in the Brazilian Amazon region, Rev. Saúde Pública, 2010, 44(1), 121–130 CrossRef PubMed.
- G. Feingold, H. L. Jiang and J. Y. Harrington, On smoke suppression of clouds in Amazonia, Geophys. Res. Lett., 2005, 32, L02804 CrossRef.
- G. McFiggans, P. Artaxo, U. Baltensperger, H. Coe, C. Facchini, G. Feingold, S. Fuzzi, M. Gysel, A. Laaksonen, U. Lohmann, T. Mentel, D. Murphy, C. O'Dowd and J. Snider, The Effect of Physical & Chemical Aerosol Properties on Warm Cloud Droplet Activation, Atmos Chem Phys, 2006, 6, 2593–2649 CrossRef CAS.
- Q. Chen, D. K. Farmer, J. Schneider, S. R. Zorn, C. L. Heald, T. G. Karl, A. Guenther, J. D. Allan, N. Robinson, H. Coe, J. R. Kimmel, T. Pauliquevis, S. Borrmann, U. Poschl, M. O. Andreae, P. Artaxo, J. L. Jimenez and S. T. Martin, Mass spectral characterization of submicron biogenic organic particles in the Amazon Basin, Geophys. Res. Lett., 2009, 36(1–5), L20806 CrossRef.
- S. T. Martin, M. O. Andreae, P. Artaxo, D. Baumgardner, Qi Chen, A. H. Goldstein, A. B. Guenther, C. L. Heald, O. L. Mayol-Bracero, P. H. McMurry, T. Pauliquevis, U. Pöschl, K. A. Prather, G. C. Roberts, S. R. Saleska, M. A. Silva Dias, D. V. Spracklen, E. Swietlicki and I. Trebs, Sources and Properties of Amazonian Aerosol Particles, Rev. Geophys., 2010, 48, RG2002 CrossRef.
- W. Elbert, P. E. Taylor, M. O. Andreae and U. Pöschl, Contribution of fungi to primary biogenic aerosols in the atmosphere: wet and dry discharged spores, carbohydrates, and inorganic ions, Atmos. Chem. Phys., 2007, 7, 4569–4588 CrossRef CAS.
- H. Baars, A. Ansmann, D. Althausen, R. Engelmann, P. Artaxo, T. Pauliquevis and R. Souza, Further evidence for significant smoke transport from Africa to Amazonia, Geophys. Res. Lett., 2011, 38, 1–6, DOI:10.1029/2011GL049200.
- A. Ansmann, H. Baars, M. Tesche, D. Muller, D. Althausen, R. Engelmann, T. Pauliquevis and P. Artaxo, Dust and smoke transport from Africa to South America: Lidar profiling over Cape Verde and the Amazon rainforest, Geophys. Res. Lett., 2009, 36, L11802 CrossRef.
- C. Pöhlker, K. T. Wiedemann, B. Sinha, M. Shiraiwa, S. S. Gunthe, M. Smith, H. Su, P. Artaxo, Q. Chen, Y. Cheng, W. Elbert, M. K. Gilles, A. L. D. Kilcoyne, R. C. Moffet, M. Weigand, S. T. Martin, U. Pöschl and M. O. Andreae, Biogenic potassium salt particles as seeds for secondary organic aerosol in the Amazon, Science, 2012, 337, 1075–1078 CrossRef PubMed.
- P. Artaxo and H.-C. Hansson, Size distribution of biogenic aerosol particles from the Amazon basin, Atmos. Environ., 1995, 29(3), 393–402 CrossRef CAS.
- S. Ekström, B. Nozière, M. Hultberg, T. Alsberg, J. Magnér, E. D. Nilsson and P. Artaxo, A possible role of ground-based microorganisms on cloud formation in the atmosphere, Biogeosciences, 2010, 7, 387–394 CrossRef.
- M. Claeys, B. Graham, G. Vas, W. Wang, R. Vermeylen, V. Pashynska, J. Cafmeyer, P. Guyon, M. O. Andreae, P. Artaxo and W. Maenhaut, Formation of secondary organic aerosols through photooxidation of isoprene, Science, 2004, 303, 1173–1176 CrossRef CAS PubMed.
- T. Karl, A. B. Guenther, A. Turnipseed, G. Tyndall, P. Artaxo and S. T. Martin, Rapid Formation of Isoprene Photo-oxidation Products Observed in Amazonia, Atmos. Chem. Phys., 2009, 9, 7753–7767 CrossRef CAS.
- T. Karl, A. Guenther, R. J. Yokelson, J. Greenberg, M. Potosnak, D. R. Blake and P. Artaxo, The tropical forest and fire emissions experiment: Emission, chemistry, and transport of biogenic volatile organic compounds in the lower atmosphere over Amazonia, J. Geophys. Res., 2007, 112, D18302 CrossRef.
- U. Kuhn, M. O. Andreae, C. Ammann, A. C. Araujo, E. Brancaleoni, P. Ciccioli, T. Dindorf, M. Frattoni, L. V. Gatti, L. Ganzeveld, B. Kruijt, J. Lelieveld, J. Lloyd, F. X. Meixner, A. D. Nobre, U. Poschl, C. Spirig, P. Stefani, A. Thielmann, R. Valentini and J. Kesselmeier, Isoprene and monoterpene fluxes from Central Amazonian rainforest inferred from tower-based and airborne measurements, and implications on the atmospheric chemistry and the local carbon budget, Atmos. Chem. Phys., 2007, 7, 2855–2879 CrossRef CAS.
- C. J. Ebben, I. S. Martinez, M. Shrestha, A. M. Buchbinder, A. L. Corrigan, A. Guenther, T. Karl, T. Petaja, W. W. Song, S. R. Zorn, P. Artaxo, M. Kulmala, S. T. Martin, L. M. Russell, J. Williams and F. M. Geiger, Contrasting organic aerosol particles from boreal and tropical forests during HUMPPA-COPEC-2010 and AMAZE-08 using coherent vibrational spectroscopy, Atmos. Chem. Phys., 2011, 11, 10327–10329 CrossRef.
- C. J. Ebben, M. Shrestha, I. S. Martinez, A. L. Corrigan, A. A. Frossard, W. W. Song, D. R. Worton, T. Petäjä, J. Williams, L. M. Russell, M. Kulmala, A. H. Goldstein, P. Artaxo, S. T. Martin, R. J. Thomson and F. M. Geiger, Secondary Organic Aerosol Particles from Southern Finland, Amazonia, and California Studied by Coherent Vibrational Spectroscopy, J. Phys. Chem. A, 2012, 116, 8271–8290 CrossRef CAS PubMed.
- P. Artaxo, E. T. Fernandes, J. V. Martins, M. A. Yamasoe, P. V. Hobbs, W. Maenhaut, K. M. Longo and A. Castanho, Large Scale Aerosol Source Apportionment in Amazonia, J. Geophys. Res., 1998, 103(D24), 31837–31848 CrossRef.
- P. Artaxo, F. Gerab, M. A. Yamasoe and J. V. Martins, Fine Mode Aerosol Composition in Three Long Term Atmospheric Monitoring Sampling Stations in the Amazon Basin, J. Geophys. Res., 1994, 99(D11), 22.857–22.868 CrossRef.
- J. A. Huffman, B. Sinha, R. M. Garland, A. Snee-Pollmann, S. S. Gunthe, P. Artaxo, S. T. Martin, M. O. Andreae and U. Pöschl, Size distributions and temporal variations of biological aerosol particles in the Amazon rainforest characterized by microscopy and real-time UV-APS fluorescence techniques during AMAZE-08, Atmos. Chem. Phys., 2012, 12, 11997–12019 CAS.
- L. V. Rizzo, P. Artaxo, T. Muller, A. Wiedensohler, M. Paixão, G. G. Cirino, A. Arana, E. Swietlicki, P. Roldin, E. O. Fors, K. T. Wiedemann, L. S. M. Leal and M. Kulmala, Long term measurements of aerosol optical properties at a primary forest site in Amazonia, Atmos. Chem. Phys., 2013, 13, 1–23 Search PubMed.
- T. M. Tuch, A. Haudek, T. Muller, A. Nowak, H. Wex and A. Wiedensohler, Design and performance of an automatic regenerating adsorption aerosol dryer for continuous operation at monitoring sites, Atmos. Meas. Tech., 2009, 2, 417–422 CrossRef CAS.
- A. Wiedensohler, W. Birmili, A. Nowak, A. Sonntag, K. Weinhold, M. Merkel, B. Wehner, T. Tuch, S. Pfeifer, M. Fiebig, A. M. Fjäraa, E. Asmi, K. Sellegri, R. Depuy, H. Venzac, P. Villani, P. Laj, P. Aalto, J. A. Ogren, E. Swietlicki, P. Williams, P. Roldin, P. Quincey, C. Hüglin, R. Fierz-Schmidhauser, M. Gysel, E. Weingartner, F. Riccobono, S. Santos, C. Grüning, K. Faloon, D. Beddows, R. Harrison, C. Monahan, S. G. Jennings, C. D. O'Dowd, A. Marinoni, H.-G. Horn, L. Keck, J. Jiang, J. Scheckman, P. H. McMurry, Z. Deng, C. S. Zhao, M. Moerman, B. Henzing, G. de Leeuw, G. Löschau and S. Bastian, Mobility particle size spectrometers: harmonization of technical standards and data structure to facilitate high quality long-term observations of atmospheric particle number size distributions, Atmos. Meas. Tech., 2012, 5, 657–685 CrossRef CAS.
- N. L. Ng, S. C. Herndon, A. Trimborn, M. R. Canagaratna, P. L. Croteau, T. B. Onasch, D. Sueper, D. R. Worsnop, Q. Zhang, Y. L. Sun and J. T. Jayne, An Aerosol Chemical Speciation Monitor (ACSM) for Routine Monitoring of the Composition and Mass Concentrations of Ambient Aerosol, Aerosol Sci. Technol., 2011, 45, 780–794 CrossRef CAS.
- J. T. Jayne, D. C. Leard, X. Zhang, P. Davidovits, K. A. Smith, C. E. Kolb and D. R. Worsnop, Development of an Aerosol Mass Spectrometer for Size and Composition Analysis of Submicron Particles, Aerosol Sci. Technol., 2000, 33, 49–70 CrossRef CAS.
- M.-S. Bae, J. J. Schwab, Q. Zhang, O. Hogrefe, K. L. Demerjian, S. Weimer, K. Rhoads, D. Orsini, P. Venkatachari and P. K. Hopke, Interference of organic signals in highly time resolved nitrate measurements by low mass resolution aerosol mass spectrometry, J. Geophys. Res., 2007, 112, D22305 CrossRef.
- S. K. Akagi, J. S. Craven, J. W. Taylor, G. R. McMeeking, R. J. Yokelson, I. R. Burling, S. P. Urbanski, C. E. Wold, J. H. Seinfeld, H. Coe, M. J. Alvarado and D. R. Weise, Evolution of trace gases and particles emitted by a chaparral fire in California, Atmos. Chem. Phys., 2012, 12, 1397–1421 CAS.
- T. L. Anderson, D. S. Covert, S. F. Marshall, M. L. Laucks, R. J. Charlson, A. P. Waggoner, J. A. Ogren, R. Caldow, R. L. Holm, F. R. Quant, G. J. Sem, A. Wiedensohler, N. A. Ahlquist and T. S. Bates, Performance characteristics of a high-sensitivity, three-wavelength, total scatter/backscatter nephelometer, Am. Meteorol. Soc., 1996, 13, 967–986 Search PubMed.
- T. L. Anderson and J. A. Ogren, Determining Aerosol Radiative Properties Using the TSI 3563 Integrating Nephelometer, Aerosol Sci. Technol., 1998, 29, 57–69 CrossRef CAS.
- A. Petzold, H. Schloesser, P. Sheridan, W. P. Arnott, J. Ogren and A. Virkkula, Evaluation of Multiangle Absorption Photometry for Measuring Aerosol Light Absorption, Aerosol Sci. Technol., 2005, 39, 40–51 CrossRef CAS.
- S. L. Lewis, P. M. Brando, O. L. Phillips, G. M. F. van der Heijden and D. Nepstad, The 2010 Amazon Drought, Science Brevia, 2011, 331(6017), 554, DOI:10.1126/science.1200807.
- M. A. Yamasoe, P. Artaxo, A. H. Miguel and A. G. Allen, Chemical composition of aerosol particles from direct emissions of biomass burning in the Amazon Basin: Water-soluble species and trace elements, Atmos. Environ., 2000, 34, 1641–1652 CrossRef CAS.
- L. V. Rizzo, P. Artaxo, T. Karl, A. B. Guenther and J. P. Greenberg, Aerosol properties, in-canopy gradients, turbulent fluxes and VOC concentrations at a pristine forest site in Amazonia, Atmos. Environ., 2010, 44(4), 503–511 CrossRef CAS.
- M. Kulmala, et al., General overview: European Integrated project on Aerosol Cloud Climate and Air Quality interactions (EUCAARI) – integrating aerosol research from nano to global scales, Atmos. Chem. Phys., 2011, 11, 13061–13143 CrossRef CAS.
- G. Capes, B. Johnson, G. McFiggans, P. I. Williams, J. Haywood and H. Coe, Aging of biomass burning aerosols over West Africa: Aircraft measurements of chemical composition, microphysical properties, and emission ratios, J. Geophys. Res., 2008, 113, D00C15 CrossRef CAS; M. Kulmala, H. Vehkamaki, T. Petaja, M. Dal Maso, A. Lauria, V.-M. Kerminen, W. Birmili and P. H. McMurry, Formation and growth rates of ultrafine atmospheric particles: a review of observations, J. Aerosol Sci., 2004, 35, 143–176 CrossRef.
- M. J. Cubison, A. M. Ortega, P. L. Hayes, D. K. Farmer, D. Day, M. J. Lechner, W. H. Brune, E. Apel, G. S. Diskin, J. A. Fisher, H. E. Fuelberg, A. Hecobian, D. J. Knapp, T. Mikoviny, D. Riemer, G. W. Sachse, W. Sessions, R. J. Weber, A. J. Weinheimer, A. Wisthaler and J. L. Jimenez, Effects of aging on organic aerosol from open biomass burning smoke in aircraft and laboratory studies, Atmos. Chem. Phys., 2011, 11, 12049–12064 Search PubMed.
- K. A. Lewis, W. P. Arnott, H. Moosmüller, R. K. Chakrabarty, C. M. Carrico, S. M. Kreidenweis, D. E. Day, W. C. Malm, A. Laskin, J. L. Jimenez, I. M. Ulbrich, J. A. Huffman, T. B. Onasch, A. Trimborn, L. Liu and M. I. Mishchenko, Reduction in biomass burning aerosol light absorption upon humidification: roles of inorganically-induced hygroscopicity, particle collapse, and photoacoustic heat and mass transfer, Atmos. Chem. Phys., 2009, 9, 8949–8966 CrossRef CAS.
- Y. Kondo, H. Matsui, N. Moteki, L. Sahu, N. Takegawa, M. Kajino, Y. Zhao, M. J. Cubison, J. L. Jimenez, S. Vay, G. S. Diskin, B. Anderson, A. Wisthaler, T. Mikoviny, H. E. Fuelberg, D. R. Blake, G. Huey, A. J. Weinheimer, D. J. Knapp and W. H. Brune, Emissions of black carbon, organic, and inorganic aerosols from biomass burning in North America and Asia in 2008, J. Geophys. Res., 2011, 116, D08204 Search PubMed.
- P. Forster, V. Ramaswamy, P. Artaxo, T. Berntsen, R. Betts, D. W. Fahey, J. Haywood, J. Lean, D. C. Lowe, G. Myhre, J. Nganga, R. Prinn, G. Raga, M. Schulz and R. Van Dorland, 2007: Changes in Atmospheric Constituents and Radiative Forcing, in: Climate Change 2007: The Physical Science Basis, Contribution of Working Group I to the Fourth Assessment Report of the Intergovernmental Panel on Climate Change [S. Solomon, D. Qin, M. Manning, Z. Chen, M. Marquis, K. B. Averyt, M. Tignor and H. L. Miller (eds.)], Cambridge University Press, Cambridge, UK and New York, NY, USA Search PubMed.
- E. T. Sena, P. Artaxo and A. L. Correia, Spatial variability of the direct radiative forcing of biomass burning aerosols and the effects of land use change in Amazonia, Atmos. Chem. Phys., 2013, 13, 1261–1275 CrossRef CAS.
- M. O. Andreae and A. Gelencser, Black carbon or brown carbon? The nature of light-absorbing carbonaceous aerosols, Atmos. Chem. Phys., 2006, 6, 3131–3148 CrossRef CAS.
- L. V. Rizzo, A. L. Correia, P. Artaxo, A. S. Procópio and M. O. Andreae, Spectral dependence of aerosol light absorption over the Amazon Basin, Atmos. Chem. Phys., 2011, 11, 8899–8912 CrossRef CAS.
- A. S. Procópio, L. A. Remer, P. Artaxo, Y. J. Kaufman and B. N. Holben, Modeled spectral optical properties for smoke aerosols in Amazonia, Geophys. Res. Lett., 2003, 30, 2265–2270 CrossRef.
- A. S. Procópio, P. Artaxo, Y. J. Kaufman, L. A. Remer, J. S. Schafer and B. N. Holben, Multiyear analysis of Amazonian biomass burning smoke radiative forcing of climate, Geophys. Res. Lett., 2004, 31, L03108–L03112 CrossRef.
- I. Koren, O. Altaratz, L. A. Remer, G. Feingold, J. V. Martins and R. H. Heiblum, Aerosol-induced intensification of rain from the tropics to mid-latitudes, Nat. Geosci., 2012, 5, 118–122 CrossRef CAS.
- U. Rummel, C. Ammann, G. A. Kirkman, M. A. L. Moura, T. Foken, M. O. Andreae and F. X. Meixner, Seasonal variation of ozone deposition to a tropical rainforest in southwest Amazonia, Atmos. Chem. Phys., 2007, 7, 5415–5435 CrossRef CAS.
- V. W. J. H. Kirchhoff, Surface ozone measurements in Amazonia, J. Geophys. Res., 1988, 93, 1469–1476 CrossRef CAS.
- M. A. L. Moura, F. X. Meixner, I. Trebs, L. C. B. Molion and M. F. do Nascimento, Filho, Medições de NO–NO2–O3 na Amazônia Central durante o experimento LBA/CLAIRE-2001, Rev. Bras. Meteorol., 2004, 19, 49–58 Search PubMed.
- M. O. Andreae, P. Artaxo, V. Beck, M. Bela, C. Gerbig, K. Longo, J. W. Munger, K. T. Wiedemann and S. C. Wofsy, Carbon monoxide and related trace gases and aerosols over the Amazon Basin during the wet and dry seasons, Atmos. Chem. Phys., 2012, 12, 6041–6065 CrossRef CAS.
- L. M. Mercado, N. Bellouin, S. Sitch, O. Boucher, C. Huntingford, M. Wild and P. M. Cox, Impact of changes in diffuse radiation on the global land carbon sink, Nature, 2009, 458, 1014–1018 CrossRef CAS PubMed.
- A. C. Araujo, A. J. Dolman, M. J. Waterloo, J. H. C. Gash, B. Kruijt, F. B. Zanchi, J. M. E. De Lange, R. Stoevelaar, A. O. Manzi, A. D. Nobre, R. N. Lootens and J. Backer, The spatial variability of CO2 storage and the interpretation of eddy covariance fluxes in central Amazonia, Agric. Forest Meteorol., 2010, 150, 226–237 CrossRef.
- C. Von Randow, A. O. Manzi, B. Kruijt, P. J. Oliveira, F. B. Zanchi, R. L. Silva, M. G. Hodnett, J. H. C. Gash, J. A. Elbers, M. J. Waterloo, F. L. Cardoso and P. Kabat, Comparative measurements and seasonal variations in energy and carbon exchange over forest and pasture in Southwest Amazonia, Theor. Appl. Climatol., 2004, 78, 5–26 CrossRef.
- J. Haywood, Estimates of the direct and indirect radiative forcing due to tropospheric aerosols: A review, Rev. Geophys., 2000, 38, 513–543 CrossRef CAS.
- D. Rosenfeld and I. M. Lensky, Satellite-based insights into precipitation formation processes in continental and maritime convective clouds, Bull. Am. Meteorol. Soc., 1998, 79, 2457–2476 CrossRef.
- D. Rosenfeld, Suppression of rain and snow by urban and industrial air pollution, Science, 2000, 287, 1793–1796 CrossRef CAS PubMed.
- D. Rosenfeld, U. Lohmann, G. B. Raga, C. D. O'Dowd, M. Kulmala, S. Fuzzi, A. Reissell and M. O. Andreae, Flood or drought: How do aerosols affect precipitation?, Science, 2008, 321, 1309–1313 CrossRef CAS PubMed.
- S. Twomey, Pollution and the planetary albedo, Atmos. Environ., 1974, 8, 1251–1256 CrossRef.
- J. Huang, C. Zhang and J. M. Prospero, Large-scale effect of aerosols on precipitation in the West African Monsoon region, Q. J. R. Meteorol. Soc., 2009, 135, 581–594 CrossRef.
- J. H. Iang, H. Su, M. R. Schoeberl, S. T. Massie, P. Colarco, S. Platnick and N. J. Livesey, Clean and polluted clouds: Relationships among pollution, ice clouds, and precipitation in South America, Geophys. Res. Lett., 2008, 35, L14804 CrossRef.
- J. C. Lin, T. Matsui, R. A. Pielke Sr and C. Kummerow, Effects of biomass-burning-derived aerosols on precipitation and clouds in the Amazon Basin: A satellite-based empirical study, J. Geophys. Res., 2006, 111, D19204 CrossRef.
- J. A. Martins, M. A. F. Silva Dias and F. L. T. Gonçalves, Impact of biomass burning aerosols on precipitation in the Amazon: A modelling case study, J. Geophys. Res., 2009, 114, D02207 CrossRef.
- S. A. Christopher, X. Li, R. M. Welch, J. S. Reid, P. V. Hobbs, T. F. Eck and B. Holben, Estimation of surface and top-of-atmosphere shortwave irradiance in biomass-burning regions during SCAR-B, J. Appl. Meteorol., 2000, 39, 1742–1753 CrossRef.
- F. Patadia, P. Gupta, S. A. Christopher and J. S. Reid, A multisensor satellite-based assessment of biomass burning aerosol radiative impact over Amazonia, J. Geophys. Res., 2008, 113, D12214 CrossRef.
- J. E. Ten Hoeve, L. A. Remer and M. Z. Jacobson, Microphysical and radiative effects of aerosols on warm clouds during the Amazon biomass burning season as observed by MODIS: impacts of water vapour and land cover, Atmos. Chem. Phys., 2011, 11, 3021–3036 CAS.
- U. Kuhn, L. Ganzeveld, A. Thielmann, T. Dindorf, G. Schebeske, M. Welling, J. Sciare, G. Roberts, F. X. Meixner, J. Kesselmeier, J. Lelieveld, O. Kolle, P. Ciccioli, J. Lloyd, J. Trentmann, P. Artaxo and M. O. Andreae, Impact of Manaus City on the Amazon Green Ocean atmosphere: ozone production, precursor sensitivity and aerosol load, Atmos. Chem. Phys., 2010, 10, 9251–9282 CrossRef CAS.
| This journal is © The Royal Society of Chemistry 2013 |
