 Open Access Article
 This Open Access Article is licensed under a
 Creative Commons Attribution 3.0 Unported Licence
Kinetic limitations in gas-particle reactions arising from slow diffusion in secondary organic aerosol
Shouming
Zhou
*a,
Manabu
Shiraiwa
bc,
Robert D.
McWhinney
a,
Ulrich
Pöschl
c and
Jonathan P. D.
Abbatt
a
aDepartment of Chemistry, University of Toronto, Ontario, ON M5S 3H6, Canada. E-mail: szhou@chem.utoronto.ca; Fax: +1 416 946 7359; Tel: +1 416 946 7359
bDivision of Chemistry and Chemical Engineering, California Institute of Technology, Pasadena, CA91125, USA
cMultiphase Chemistry Department, Max Plank Institute for Chemistry, Mainz, D-55128, Germany
First published on 17th May 2013
Abstract
The potential for aerosol physical properties, such as phase, morphology and viscosity/diffusivity, to affect particle reactivity remains highly uncertain. We report here a study of the effect of bulk diffusivity of polycyclic aromatic hydrocarbons (PAHs) in secondary organic aerosol (SOA) on the kinetics of the heterogeneous reaction of particle-borne benzo[a]pyrene (BaP) with ozone. The experiments were performed by coating BaP-ammonium sulfate particles with multilayers of SOA formed from ozonolysis of α-pinene, and by subsequently investigating the kinetics of BaP loss via reaction with excess ozone using an aerosol flow tube coupled to an Aerodyne Aerosol Mass Spectrometer (AMS). All reactions exhibit pseudo-first order kinetics and are empirically well described by a Langmuir–Hinshelwood (L-H) mechanism. The results show that under dry conditions (RH < 5%) diffusion through the SOA coating can lead to significant mass transfer constraints on the kinetics, with behavior between that previously observed by our group for solid and liquid organic coats. The reactivity of BaP was enhanced at ∼50% relative humidity (RH) suggesting that water uptake lowers the viscosity of the SOA, hence lifting the mass transfer constraint to some degree. The kinetics for ∼70% RH were similar to results obtained without SOA coats, indicating that the SOA had sufficiently low viscosity and was sufficiently liquid-like that reactants could rapidly diffuse through the coat. A kinetic multi-layer model for aerosol surface and bulk chemistry was applied to simulate the kinetics, yielding estimates for the diffusion coefficients (in cm2 s−1) for BaP in α-pinene SOA of 2 × 10⁻¹⁴, 8 × 10⁻¹⁴ and >1 × 10⁻¹² for dry (RH < 5%), 50% RH and 70% RH conditions, respectively. These results clearly indicate that slow diffusion of reactants through SOA coats under specific conditions can provide shielding from gas-phase oxidants, enabling the long-range atmospheric transport of toxic trace species, such as PAHs and persistent organic pollutants.
1 Introduction
The question we address in this paper is whether coatings of secondary organic aerosol (SOA) can provide a kinetic barrier to the rates of aerosol chemistry. In particular, while it is known that SOA frequently contributes the majority of the sub-micron aerosol mass,1 the physical properties of atmospheric SOA and their impacts remain poorly understood.Based on an equilibrium gas/particle partitioning theory,2,3 SOA has generally been treated as a well-mixed liquid in atmospheric models3–5 in which the gas-phase oxidation products are assumed to quickly adopt gas-particle equilibrium. However, a number of recent studies have shown that SOA behaves as a highly viscous, amorphous solid or semi-solid. In this case the equilibration timescale of SOA partitioning can be longer and the assumption of equilibrium partitioning may be in question.6
Virtanen et al.7 investigated the bounce behavior of biogenic SOA formed from ozone reaction with plant-emitted VOCs on smooth and hard surfaces and demonstrated that the organic-rich atmospheric aerosol can exist in the amorphous solid state. Later work of Vaden et al.8 and Abramson et al.9 studied evaporation of α-pinene SOA at room temperature and found evaporation kinetics were orders of magnitude slower than those expected from well-mixed liquid droplets. As well, Cappa and Wilson10 observed that the volatility of organic aerosol was significantly lower than that of liquid aerosols by studying the thermal desorption properties of α-pinene SOA. Finally, Perraud et al.11 reported that the partitioning of organic nitrates formed from the reaction of α-pinene with NO3 radicals to α-pinene ozonolysis SOA can only be explained by a non-equilibrium, kinetically limited condensation mechanism rather than the equilibrium partitioning commonly assumed to occur between gas- and liquid-particles.
If SOA exists in an amorphous, semi-solid state, then its properties are expected to be affected by environmental conditions. Saukko et al.12 showed that α-pinene SOA remains solid or semi-solid at RH < 50% and a transition to more liquid-like behavior was seen when RH is higher than 50%. Recent work of Kuwata and Martin13 reported that gas-phase ammonia uptake by α-pinene SOA under dry conditions (RH < 5%) was consistent with adsorption on highly viscous semi-solid particles, whereas the adsorption/absorption of ammonia on SOA particles was significantly increased at RHs close to saturation, suggesting that the SOA had become liquid.
As evidence accumulates showing that SOA possesses solid or semi-solid properties,14 it is important to understand how the fundamental physical properties of SOA-containing particles affect heterogeneous reactivity. In particular, are all reactants available for surfaces reactions, implying rapid diffusion through the particle? Or, does semi-solid SOA provide shielding from gas-phase oxidants? Through the analysis of the kinetics of multi-component heterogeneous reactions, we should be able to derive estimates for the diffusivity of reactants through SOA, noting these are largely lacking for this hard-to-measure quantity. In particular, to the best of our knowledge, only one value of a bulk diffusion coefficient of 2.5 × 10⁻¹⁷ cm2 s−1 for pyrene diffusion in α-pinene SOA has been estimated to date.9
To this end, we present a study on the effect of α-pinene SOA viscosity/diffusivity on the kinetics of gas-phase ozone reacting heterogeneously with particle-borne benzo[a]pyrene (BaP) that was initially buried under the SOA coat. The effects of water-uptake induced changes in SOA on the heterogeneous reactivity were also investigated. As a model heterogeneous reaction system, the kinetics of particle-borne BaP reacting with gas-phase ozone have been studied previously.15–17 In particular, our group has demonstrated that this reaction can be effectively shut down when a solid organic coating is deposited on top of adsorbed-BaP, whereas liquid coatings impose no mass transfer limitations on the kinetics.17 Kinetic models for aerosol surface and bulk chemistry (K2-SURF18 and KM-SUB19) are applied to simulate the BaP degradation kinetics and to estimate the diffusivity of BaP in α-pinene SOA at room temperature and interpret the effect of changing RH on the kinetics.
2 Experimental
2.1 Particle generation, particle coating, and aerosol kinetics
A schematic representation of the experimental set-up is shown in Fig. 1. The particles were generated by nebulizing a ∼1 mM ammonium sulfate (AS) (solid, ≥99.5%, Fluka) aqueous solution using an atomizer (TSI model 3076). A fraction of the poly-disperse AS particles (∼300 sccm) was coated with sub-monolayer benzo[a]pyrene (BaP) (solid, ≥98%, Sigma-Aldrich) in a manner analogous to our previous work, by passing through a heated tube containing BaP.17 The BaP-coated AS particles (AS-BaP) were then mixed with gas-phase α-pinene in a mixing flow tube (Fig. 1). The gas-phase α-pinene was introduced into the tube by passing 0.5–1 sccm nitrogen over the headspace of α-pinene liquid (≥99%, liquid) which had been placed in a bubbler. The bubbler was cooled to −15 °C and the α-pinene mixing ratio varied between 250–500 ppb, as measured by a proton-transfer-reaction mass spectrometer. The AS-BaP particles and the gas-phase α-pinene were then sent to a second coating tube, where ozone was added and the AS-BaP particles were coated with SOA from the ozonolysis reaction with α-pinene. Ozone (∼100 sccm, 2–3 ppm) was generated by ultraviolet irradiation of a mixed flow of N2/O2 in a Pyrex glass chamber with a mercury pen-ray lamp (UVP Inc.). The SOA coated AS-BaP particles (AS-BaP-SOA) then passed through two charcoal denuders to remove the gas-phase reactants and products before entering a humidifying tube. Using a scanning mobility particle sizer (SMPS) consisting of a differential mobility analyzer (DMA, model 3080, TSI Inc.) and a condensation particle counter (CPC 3025, TSI Inc.), no SOA formation was observed with only ozone and α-pinene present in the coating flow tube, confirming that the SOA measured in this work all arises from the condensation of low volatility products from ozonolysis of α-pinene onto AS-BaP particles, with negligible new particle formation.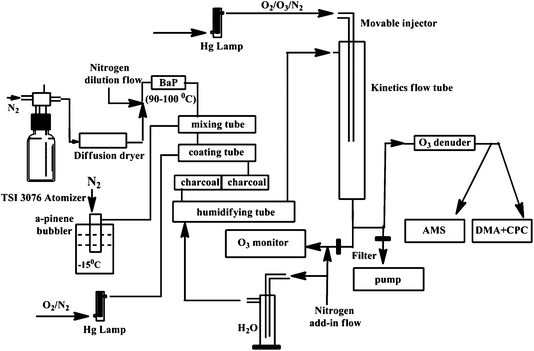 | ||
| Fig. 1 A schematic representation of the experimental set-up. | ||
A 1000 sccm dry nitrogen flow was added into a horizontally oriented humidifying tube making a total particle flow of ∼1.9 slpm in the kinetics flow tube (RH < 5%). A ∼50% RH in the kinetics flow tube was achieved by passing the dry nitrogen flow through a bubbler containing deionized water, whereas ∼70% RH was achieved by also adding ∼50 ml deionized water into the horizontally oriented humidifying tube. The residence time for the particles and water vapor in the humidifying tube was ∼60s. The dry or humidified AS-BaP-SOA particles were then introduced into a vertically oriented kinetics flow tube (Fig. 1), where a flow (∼100 sccm) containing ozone was added through a movable stainless steel injector.
The kinetics flow tube (6 cm i.d. and 96 cm in length) was operated at room temperature and atmospheric pressure (296 ± 3 K and 1 atm) under laminar flow conditions. The reaction time (up to 66 s) between BaP and ozone was varied by setting the injector to different positions along the flow tube. The total flow exiting the kinetics flow tube was divided into three: 1) ∼100 sccm was introduced into a UV photometric O3 analyzer (Thermo Model 49i) with a dilution flow of 1.3 slpm dry nitrogen; 2) ∼400 sccm passing through an ozone denuder, which can remove more than 90% of ozone, was sampled by the SMPS and an Aerodyne Aerosol Mass Spectrometer (C-ToF AMS) to measure particle mobility size distributions and chemical composition, respectively; and 3) the remaining aerosol flow was removed by a diaphragm pump (Fig. 1). The ozone was in large excess to BaP in the kinetics flow tube and its mixing ratio was controlled by varying the ratio of O2 to N2 passing the pen-ray lamp.
2.2 Aerosol composition measurement
The aerosol chemical composition was measured by Aerodyne AMS. The instrument operation and sample analysis have been detailed in our previous work.17 Briefly, the C-ToF AMS was operated in either mass spectrum (MS) mode or particle time-of-flight (PTOF) mode, with the former producing the mass spectra of non-refractory components of submicron particles and the latter providing size-resolved mass spectra. The molecular ion of m/z 252 was used to detect particle-borne BaP and was normalized by the sulfate mass loading in the kinetics studies. Test experiments showed that the SOA contributed between 5–20% to the total m/z 252 signal intensities of the AS-BaP-SOA particles. This contribution is found to be proportional to the total organic mass loadings and was unaffected by the presence of ozone in the flow tube. Therefore, the contribution of the SOA to the m/z 252 signal is easily accounted for. In addition, as has been pointed out in our previous work,17 a small amount of organics, arising either from the deionized milli-Q water or laboratory contamination, have always been observed by the AMS in the AS particles. However, the background organics can only account for a maximum of 10% and 2% of the total organic mass loadings after ‘thin’ and ‘thick’ SOA coatings, respectively, were applied. The amount of BaP coated onto the AS particles was very small, representing well less than a monolayer coverage, assuming uniform coverage.3 Results and discussion
3.1 Particle characterization
Fig. 2 provides an example of the particle-size-resolved measurements from the AMS before (a) and after (b) the SOA coating is applied. The size distributions of the three materials, i.e. organic, sulfate and m/z 252, are all shifted to larger sizes after the AS-BaP particles are coated with SOA, with the mass loadings for organic and sulfate increased while that for m/z 252 decreased (note the different scales for organic mass loadings in Fig. 1 before (a) and after (b) SOA is coated). The increase in sulfate mass loading is likely due to the enhanced collection efficiency of the AMS with SOA coated AS-BaP particles, implying that the SOA formed from ozonolysis of α-pinene is not as rigid as solid AS-BaP particles. The decrease in m/z 252 mass loading is because of a small degree of reaction of surface-bound BaP with ozone in the SOA coating tube. In addition, we note that the size distributions for these three materials are qualitatively similar before SOA is coated. However, after the SOA coating is applied, sulfate and m/z 252 remain with generally similar size distributions, whereas the larger particles are more organic rich than the smaller particles.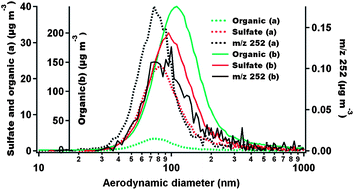 | ||
| Fig. 2 Size-resolved mass distributions for chemical species obtained from the PTOF mode of the AMS for the AS-BaP particles before (a) and after (b) SOA coating is applied. | ||
The SOA coating thickness is estimated using a method detailed in our previous work (in supplementary information of Zhou et al.17) to be 5–10 nm and 20–80 nm in thickness for ‘thin’ and ‘thick’ coatings, respectively. In particular, we use the AMS data for these estimates, assuming uniform spherical coats. The estimated absolute thickness of the coated organic is almost independent of particle size for the ‘thin’ coating experiments; for the ‘thick’ coats, however, the coating thickness increased to some degree with particle size, consistent with the observation above that the larger particles are more organic rich.
3.2 Kinetics of reaction of the SOA coated BaP particles with ozone
Fig. 3 gives an example of the BaP concentrations plotted against reaction time for thin SOA coating experiments. The uncertainty in each data point was taken as the standard error of the measurement. Control experiments were conducted in a manner analogous to the kinetic measurements without ozone present. The small changes in the BaP concentrations as a function of reaction time have been accounted for in the data analysis.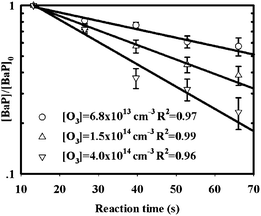 | ||
| Fig. 3 Examples of the kinetic plots for the reaction of gas-phase ozone with BaP-AS particles with thin SOA coats. Symbols represent different ozone concentrations in the kinetics flow tube. | ||
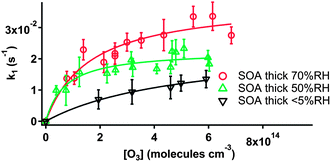
The good linearity of the kinetic plots in Fig. 3 demonstrates that the reaction of particle-borne BaP with ozone exhibits pseudo-first order kinetics in terms of BaP loss. The linear least-squares fit of the data in Fig. 3 yields the first-order rate constant (k1) at a specific ozone concentration. All the k1 obtained in this work are summarized in Table 1. The uncertainties in k1 are given as a combination of the least-squares 1-σ uncertainties in the kinetic measurements and control experiments. The k1 in Table 1 are plotted as a function of the corresponding ozone concentrations and presented in Fig. 4 and 5 for dry (<5% RH) and high RH experiments, respectively.
| Thin SOA dry | Thick SOA dry | Thick SOA 50% RH | Thick SOA 70% RH | ||||
|---|---|---|---|---|---|---|---|
| [O3] | k 1 (s−1) | [O3] | k 1 (s−1) | [O3] | k 1 (s−1) | [O3] | k 1 (s−1) |
| 0.37 | 0.008 ± 0.002 | 1.94 | 0.007 ± 0.003 | 0.74 | 0.010 ± 0.004 | 0.77 | 0.013 ± 0.003 |
| 0.68 | 0.010 ± 0.003 | 3.18 | 0.009 ± 0.003 | 1.24 | 0.016 ± 0.005 | 1.05 | 0.014 ± 0.002 |
| 1.52 | 0.018 ± 0.003 | 4.60 | 0.013 ± 0.003 | 2.26 | 0.015 ± 0.003 | 1.38 | 0.023 ± 0.003 |
| 2.95 | 0.024 ± 0.004 | 4.98 | 0.012 ± 0.004 | 2.57 | 0.016 ± 0.002 | 2.13 | 0.019 ± 0.004 |
| 3.22 | 0.028 ± 0.005 | 5.91 | 0.014 ± 0.004 | 3.20 | 0.017 ± 0.003 | 2.55 | 0.021 ± 0.003 |
| 3.98 | 0.028 ± 0.004 | 4.09 | 0.017 ± 0.002 | 2.55 | 0.022 ± 0.003 | ||
| 4.60 | 0.017 ± 0.002 | 4.34 | 0.028 ± 0.005 | ||||
| 4.65 | 0.022 ± 0.004 | 5.44 | 0.034 ± 0.004 | ||||
| 4.79 | 0.022 ± 0.004 | 6.15 | 0.034 ± 0.005 | ||||
| 5.09 | 0.023 ± 0.003 | 6.83 | 0.028 ± 0.003 | ||||
| 5.98 | 0.021 ± 0.003 | ||||||
| 6.03 | 0.019 ± 0.004 | ||||||
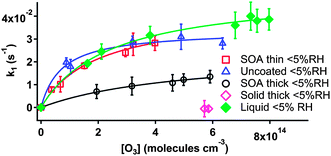 | ||
| Fig. 4 Pseudo-first-order rate constants k1 as a function of gas-phase ozone concentrations for the reaction of particle-borne BaP and ozone with different organic coatings under dry conditions. Note that the “Solid thick” and “Liquid” coating data come from Zhou et al.,17 where a thick coating of a solid alkane was deposited onto BaP-AS particles. | ||
 | ||
| Fig. 5 Pseudo-first-order rate constants k1 as a function of gas-phase ozone concentrations for the reaction of particle-borne BaP and ozone with thick SOA coatings under different RH. | ||
All the plots in Fig. 4 and 5 (except for the thick solid organic coating in Fig. 4 taken from our previous work17) show saturation of the kinetics at high ozone concentrations. This is consistent with a Langmuir–Hinshelwood (L-H) mechanism, indicating a surface reaction between particle-borne BaP and ozone (or a reactive intermediate).
Using the following L-H equation, two parameters, i.e. kmax and KO3, can be obtained by fitting the data given in Fig. 4 and 5:
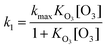
Table 2 summarizes the best-fit kmax and KO3 values obtained in this work with associated standard deviations and those from previous studies on the heterogeneous reaction of ozone with BaP or anthracene. The kmax values obtained in this work for the thin SOA dry and thick SOA ∼70% RH of 0.042 s−1 and 0.039 s−1 (Table 2), respectively, are in good agreement with those for uncoated and liquid-organic coated BaP particles, as well as most of the literature data (Table 2).
| PAH | Aerosol substrate | K O3 (10−15 cm3) | k max (s−1) | References |
|---|---|---|---|---|
| BaP | Soot | 280 ± 20 | 0.015 ± 0.001 | 15 |
| BaP | Azelaic acid | 1.2 ± 0.4 | 0.048 ± 0.008 | 16 |
| Anthracene | TTTS | 100 ± 40 | 0.010 ± 0.003 | 20 |
| Anthracene | Azelaic acid | 2.2 ± 0.9 | 0.057 ± 0.009 | 20 |
| BaP | AS | 14 ± 4 | 0.034 ± 0.002 | 17 |
| BaP | AS-BES | 4.1 ± 0.1 | 0.051 ± 0.001 | 17 |
| BaP | AS-PSO | 13 ± 4 | 0.047 ± 0.004 | 17 |
| BaP | AS-thin SOA dry | 5.1 ± 0.9 | 0.042 ± 0.004 | This work |
| BaP | AS-thick SOA dry | 2.3 ± 0.4 | 0.022 ± 0.003 | This work |
| BaP | AS-SOA 50% RH | 14 ± 4.4 | 0.023 ± 0.004 | This work |
| BaP | AS-SOA 70% RH | 6.2 ± 1.1 | 0.039 ± 0.004 | This work |
3.3 Effect of SOA phase on the kinetics
From Fig. 4 it is clear that under dry conditions (RH < 5%) a thin SOA coating provides little-to-no mass transfer limitation on the kinetics of particle-borne BaP with ozone compared to the uncoated AS-BaP particles, whereas the reactivity of BaP towards ozone is substantially reduced by a thick SOA coating. In our previous work,17 where we investigated the effects of organic coatings of different physical states, we found that the reactivity of BaP towards ozone was unaffected by liquid oil coatings regardless of whether the coating was thin or thick (Fig. 4). By contrast, the reactivity of BaP was reduced significantly when a thin solid alkane coating was applied and the reaction was effectively shut off with a thick solid coating (Fig. 4).17These observations were explained by the different diffusivity of the reactants through the organic coats. For liquid organic coatings, the diffusion of the BaP through the coated materials was estimated to be fast, on a timescale of nano- to microseconds.17 As a result, the kinetics were not limited by mass transfer. For the solid organic, the reactant diffusivity was likely to be orders of magnitude lower so kinetics were controlled by solid phase diffusion.17
We interpret the present results in a similar manner. The negligible effect of the thin SOA coating may arise because diffusion is sufficiently fast to replace BaP being lost at the surface of the particle through an interfacial process. Note that we cannot rule out the possibility that the BaP may not be fully buried under the SOA material, leaving the BaP directly exposed to gas-phase ozone. However, in a similar coating procedure of SOA onto ammonium bisulfate particles, we observed that equally thin coats provided a dramatic reduction in the reactivity of N2O5.21
Compared to the kinetic plots for the uncoated and liquid-organic-coated (Fig. 4) particles,17 the reduction in BaP reactivity by a thick SOA coating under dry conditions (<5% RH) is likely a result of the mass transfer constraints that the SOA coats place on the kinetics, indicating that the α-pinene SOA is not a low viscosity liquid under these conditions. This is consistent with previous studies suggesting that SOA can be solid or semi-solid.7,10,14 Moreover, the difference in the kinetic plots for the thick SOA and solid organic coatings (Fig. 4), with the latter entirely shutting off the reaction, implies that the SOA under dry conditions is less viscous than a rigid solid, allowing the reactants to diffuse through the organic coats to some extent over the experimental timescale of the order of minutes. This is consistent with previous work showing that the SOA particles possess some degree of fluidity.8,13,22,23
The effects of organic coatings on heterogeneous reactions have been investigated by a number of research groups. For example, studies on the reactive uptake of N2O5 on different surfaces, such as AS particles,24 aqueous H2SO4 solution/particles25–28 and sea salt aerosols,29–32 and the uptake of ozone on deliquesced potassium iodide (KI) particles33 and aqueous pyrene solutions,34 have shown a decrease in reactivity in the presence of a monolayer surfactant coating. A decrease of the uptake of N2O5 on ammonium bisulfate particles coated with SOA has also been reported.21,35 We note, however, that this is a reaction with a substantial bulk-phase component, so the results are interpreted by the effects of the organic coating on the ability of N2O5 to access water in the bulk of the particle. By contrast, several studies have shown an enhancement of PAH uptake at air–water interface,34 gas-phase HCl uptake on aqueous H2SO4 solutions36–38 as well as O3 reactivity on aqueous pyrene solutions39 in the presence of soluble organic surfactants. These are likely related to the changes in mass accommodation coefficients. Thus, there is a complexity that can arise in the effects of coatings on heterogeneous reactions beyond that which is explored in this paper, likely related to the phase states of the organic coats and their specific interactions with the reactants.
3.4 Effect of humidity-induced viscosity/diffusivity changes
It can be seen from Fig. 5 that the heterogeneous reactivity of BaP towards ozone is enhanced when RH increases. The higher reactivity is likely due to water uptake by SOA resulting in a lower viscosity of the SOA materials and hence increased diffusivity of the reactants through the coats. The similarities in the kinetic plots for ∼70% RH and uncoated BaP, as well as those for liquid organic coats (Fig. 4, 5 and Table 2), suggest a transition of the SOA from semi-solid to lower viscosity, more-liquid-like particles between 50 to 70% RH. We note that the RH in the flow tube was kept lower than the AS deliquescence RH (DRH) of 80%40 to maintain a uniform aerosol substrate; it has been reported that AS mixed with α-pinene ozonolysis SOA has a DRH which is only 4% lower than pure AS.41 This lends confidence that the AS in the particles remains in the solid state at ∼70% RH.These results are in accord with previous studies. As mentioned above, humidity-induced modification of biogenic SOA particles has been investigated by Saukko et al.12 by studying particle bounce, where it was concluded that α-pinene photooxidation SOA remains solid or semi-solid at RH < 50%. A phase change from solid to liquid-like substances was suggested in the RH range of 50–64% RH.12 A similar observation was made in previous work on the multiphase oxidation kinetics of protein substrates with ozone,42 where the increased ozone uptake with RH was explained by hygroscopic water uptake of amorphous organics leading to an increase of the diffusivity of the reactants through the organic matrix.
While a number of laboratory and modeling studies have reported that the multi-component organic/inorganic particles may undergo liquid–liquid phase separation at high RH conditions,43–47 it is impossible for us to determine if this is the case for the high RH experiments in the present work. Nevertheless, the kinetic results indicate that the enhanced RH lowers the viscosity of the SOA, lifting the mass transfer constraint on the heterogeneous reactivity of BaP with ozone. Also, we note that the results that have been observed in this work are specific to the form of SOA studied. Subsequent studies of other SOA types are required to determine the extent to which the results are generalizable.
3.5 Kinetic model for degradation kinetics of BaP with ozone
| O3 (g) ↔ O3 (s) | (R1) |
| O3 (s) ↔ O (s) + O2 (s) | (R2) |
| O (s) + PAH (ss) → O–PAH (ss) | (R3) |
 | ||
| Fig. 6 Kinetic modeling of ozonolysis of BaP on ammonium sulfate aerosol particles. (a) Schematics of kinetic double-layer model (K2-SURF)18 applied for ozonolysis of uncoated BaP (experimental data taken from our previous work17). (b) Schematics of kinetic multi-layer model (KM-SUB)19 applied for ozonolysis of BaP coated by α-pinene SOA. It consists of a sorption layer, a surface layer, and a number of n bulk layers. Red arrows show chemical reactions and green arrows show mass transport. (c) Pseudo first-order decay rate coefficient (k1) for uncoated BaP as a function of gas-phase O3 concentration. The red line is from a model with ROI formation using a desorption lifetime for O3 (τd,O3) of 3 ns. The black dotted line is modeled using a simple L-H formalism without ROI formation with τd,O3 of 0.9 s. (d) k1 for BaP coated by α-pinene SOA thinly and thickly under dry conditions. The red lines are modeled by KM-SUB. (e) k1 for BaP with thick α-pinene SOA coats at different RH (dry, ∼50% and ∼70% RH). The lines are modeled by KM-SUB. (f) Bulk diffusion coefficient (cm2 s−1) of BaP in α-pinene SOA as a function of RH derived by KM-SUB. | ||
| Parameter | Description | Value |
|---|---|---|
| a * The values are shown in Fig. 6f depending on RH. | ||
| α s,0,O3 | surface accommodation coefficient of O3 | 1 |
| τ d,O3 (s) | desorption lifetime of O3 | 3.2 × 10⁻⁹ |
| D b,O3 (cm2 s−1) | bulk diffusivity of O3 in SOA | 10−10 |
| D b,PAH (cm2 s−1) | bulk diffusivity of PAH in SOA | * |
| E a,pc (kJ mol−1) | activation energy from physisorbed O3 to ROI | 42 |
| E a,ox (kJ mol−1) | activation energy from ROI to oxidized PAH | 80 |
| k BR (cm3 s−1) | second-order bulk reaction rate coefficient between PAH and O3 | 5 × 10⁻¹⁸ |
| K sol,cc (mol cm−3 atm−1) | Henry's law coefficient of O3 | 6 × 10⁻⁴ |
![[double bond, length as m-dash]](https://www.rsc.org/images/entities/char_e001.gif) C should have been consumed by the gas-phase ozonolysis reaction, forming oxygenated products that then adsorb/condense to form the SOA.52,53 Before particles are exposed to O3, they are humidified for ∼60 s during which diffusion of BaP commences. To make the most direct comparison between the measurements and the models, the ozone exposure is turned on after a delay period of 60 s. This time matches the residence time in the humidifying tube in the experimental system. Kinetics simulations without this delay time yield essentially the same results.
C should have been consumed by the gas-phase ozonolysis reaction, forming oxygenated products that then adsorb/condense to form the SOA.52,53 Before particles are exposed to O3, they are humidified for ∼60 s during which diffusion of BaP commences. To make the most direct comparison between the measurements and the models, the ozone exposure is turned on after a delay period of 60 s. This time matches the residence time in the humidifying tube in the experimental system. Kinetics simulations without this delay time yield essentially the same results.
The kinetic parameters required for simulations are listed in Table 3. αs,0,O3, τd,O3 and the activation energies are kept the same as in the uncoated PAH case. The Henry's law coefficient of ozone (Ksol,cc) in α-pinene SOA matrix is not known. Ksol,cc in organics generally lies in the range of 10−4–10−3 mol cm−3 atm−1.48,54,55 Thus, Ksol,cc are varied in this range and other parameters are also varied systematically and iteratively to fit to the experimental data. The sensitivity studies revealed that the bulk diffusivity of PAH in SOA (Db,PAH) is the most sensitive parameter and other parameters are not as critical. Db,O3 is assumed to be 10−10 cm2 s−1 which is a typical value of small oxidants in amorphous solids, as percolation theory would predict only a slight increase of Db,O3 up to ∼80% RH.42kBR is estimated to have a low value of 5 × 10⁻¹⁸ cm3 s−1, which is in line with previous studies reporting that the bulk reaction between O3 and PAH proceeds slower than surface reaction whose reaction rate coefficient ranges from 10−17–10−16 cm3 s−1.20,56–58 It is important to note that if a larger value of kBR is used, the modeled k1 do not show saturation behavior with increasing ozone concentrations but rather exhibit a linear increase trend.
Fig. 6d shows experimentally observed k1 values for BaP when coated by α-pinene SOA under dry conditions. The SOA coating thicknesses are taken as 8 nm and 40 nm for thin and thick coatings, respectively. KM-SUB successfully fits to both data sets by a single parameter set listed in Table 3. Db,PAH is estimated to be 2 × 10⁻¹⁴ cm2 s−1 under dry conditions. k1 for BaP coated thickly at ∼50% and ∼70% RH were also well fit with Db,PAH of 8 × 10⁻¹⁴ cm2 s−1 and 10−11 cm2 s−1, respectively (Fig. 6e). Note that at ∼70% RH KM-SUB is not sensitive enough to constrain Db,PAH well but gives more accurately a lower limit of 10−12 cm2 s−1, as k1 is suppressed only slightly by SOA coating. The obtained Db,PAH are summarized in Fig. 6f, showing the clear increasing trend as RH increases. As discussed previously, this trend corresponds to humidity-induced changes in viscosity/diffusivity of α-pinene SOA.14,40,59 Note that Abramson et al.9 estimated the bulk diffusivity of pyrene in α-pinene SOA to be 2.5 × 10⁻¹⁷ cm2 s−1 under dry conditions (<5% RH) based on measurements of evaporation kinetics, which is three orders of magnitude lower than our estimate.
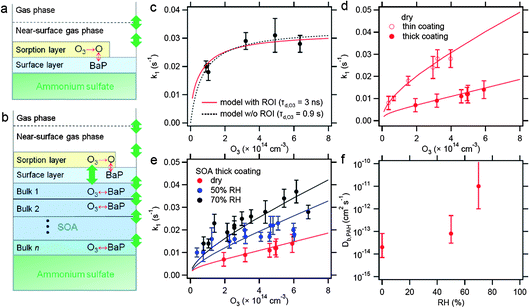
Fig. 7 shows the radial distribution and temporal evolution of the bulk concentration of (a) O3 and (b) BaP with thick SOA coatings under dry conditions with a gas phase O3 concentration of 2.5 × 1014 cm−3. The left axis indicates the radial distance from the ammonium sulfate core. Due to low diffusivity and reactive consumption both O3 and BaP exhibit a steep concentration gradient; the O3 concentration is higher near the surface and the BaP concentration is higher in the inner bulk. The profile of the degradation rate of BaP (cm−3 s−1) is shown in Fig. 7c. The highest reaction rate is observed at the surface (>1018 cm−3 s−1), clearly showing that reaction proceeds faster at the surface than in the bulk. The slight radial gradient of reaction rate in the bulk reflects the concentration gradient of O3 and PAH.
 | ||
| Fig. 7 Radial profile of bulk concentration (cm−3) of (a) ozone and (b) BaP and (c) BaP degradation rate (cm−3 s−1) simulated by KM-SUB with dry conditions and a gas phase ozone concentration of 2.5 × 1014 cm−3. The left axis is radial position in SOA coating (0 nm = ammonium sulfate; 40 nm = particle surface). | ||
We note that these modeling estimates of the diffusion coefficient are dependent upon the assumed mechanism whereby BaP diffuses to the surface to react with ozone at the interface. Other mechanisms cannot be fully ruled out but we note that if we assume a faster bulk phase reaction, whereby ozone diffusivity could end up being rate limiting, the model results yielded a linear dependence of the BaP loss rate constant on ozone concentration. As well, there will be uncertainty arising in our inferred values from the thickness of the SOA coats, which we assume to be uniform.
4 Conclusions and atmospheric implications
This paper illustrates that mass transfer limitations can arise in atmospheric heterogeneous reactions involving SOA. In particular, the effects of viscosity/diffusivity of α-pinene ozonolysis SOA on the heterogeneous reactivity of particle-borne BaP towards gas-phase ozone were investigated. The results show that under dry conditions the SOA coating can lead to mass transfer constraints on the kinetics, with behavior between that of solids and liquids, i.e. a semi-solid. The BaP kinetics were enhanced with RH indicating that the water uptake by SOA organics lowers the viscosity and lifts the mass transfer constraint. By application of a kinetic multi-layer model for aerosol surface and bulk chemistry(KM-SUB), the diffusivity (in cm2 s−1) of BaP in SOA was estimated to be 2 × 10⁻¹⁴, 8 × 10⁻¹⁴ and >1 × 10⁻¹² for dry (RH < 5%), ∼50% RH and ∼70% RH, respectively.It is expected that PAHs, such as BaP, will become coated with SOA after their formation from combustion sources. Both modeling studies and other experimental studies suggest that PAHs buried under multi-layer organic films could be protected from heterogeneous oxidation.17,60–62 It is quite likely that this provides a mechanism for long range transport of such species to occur in the atmosphere to remote environments such as the Arctic.63,64 The diffusion coefficients obtained in this work, even at low RH, still imply quite rapid diffusion within the particle, i.e. longer than the experimental timescale but shorter than an atmospheric residence time of a week or so. However, this estimate is for one type of SOA only. As well it is not for oxidatively aged SOA, and it has been reported that the viscosity of aged α-pinene SOA is higher than fresh SOA by a factor of three.9 As well, it is expected that the diffusivity will be markedly lower at lower temperatures, e.g. after a particle is lofted out of the boundary layer. Mapping out these dependencies may allow for a more accurate modeling of the lifetime of such species in the atmosphere.
Acknowledgements
Financial support of this work by NSERC (Canada) is gratefully acknowledged.References
- M. Hallquist, J. C. Wenger, U. Baltensperger, Y. Rudich, D. Simpson, M. Claeys, J. Dommen, N. M. Donahue, C. George, A. H. Goldstein, J. F. Hamilton, H. Herrmann, T. Hoffmann, Y. Iinuma, M. Jang, M. Jenkin, J. L. Jimenez, A. Kiendler-Scharr, W. Maenhaut, G. McFiggans, Th. F. Mentel, A. Monod, A. S. H. Prévôt, J. H. Seinfeld, J. D. Surratt, R. Szmigielski and J. Wildt, Atmos. Chem. Phys., 2009, 9, 5155–5236 CrossRef CAS.
- J. F. Pankow and T. F. Bidleman, Atmos. Environ., Part A, 1991, 25, 2241–2249 CrossRef.
- J. F. Pankow, Atmos. Environ., 1994, 28, 189–193 CrossRef CAS.
- J. R. Odum, T. Hoffmann, F. Bowman, D. Collins, R. C. Flagan and J. H. Seinfeld, Environ. Sci. Technol., 1996, 30, 2580–2585 CrossRef CAS.
- N. M. Donahue, A. L. Robinson, C. O. Stanier and S. N. Pandis, Environ. Sci. Technol., 2006, 40, 2635–2643 CrossRef CAS.
- M. Shiraiwa and J. H. Seinfeld, Geophys. Res. Lett., 2012, 39, L24801 CrossRef CAS.
- A. Virtanen, J. Joutsensaari, T. Koop, J. Kannosto, P. Yli-Pirila, J. Leskinen, J. M. Makela, J. K. Holopainen, U. Pöschl, M. Kulmala, D. R. Worsnop and A. Laaksonen, Nature, 2010, 467, 824–827 CrossRef CAS.
- T. D. Vaden, D. Imre, J. Beranek, M. Shrivastava and A. Zelenyuk, Proc. Natl. Acad. Sci. U. S. A., 2011, 108, 2190–2195 CrossRef CAS.
- E. Abramson, D. Imre, J. Beránek, J. Wilson and A. Zelenyuk, Phys. Chem. Chem. Phys., 2013, 15, 2983–2991 RSC.
- C. D. Cappa and K. R. Wilson, Atmos. Chem. Phys., 2011, 11, 1895–1911 CrossRef CAS.
- V. Perraud, E. A. Bruns, M. J. Ezell, S. N. Johnson, Y. Yu, M. L. Alexander, A. Zelenyuk, D. Imre, W. L. Chang, D. Dabdub, J. F. Pankow and B. J. Finlayson-Pitts, Proc. Natl. Acad. Sci. U. S. A., 2012, 109, 2836–2841 CrossRef CAS.
- E. Saukko, A. T. Lambe, P. Massoli, T. Koop, J. P. Wright, D. R. Croasdale, D. A. Pedernera, T. B. Onasch, A. Laaksonen, P. Davidovits, D. R. Worsnop and A. Virtanen, Atmos. Chem. Phys., 2012, 12, 7517–7529 CrossRef CAS.
- M. Kuwata and S. T. Martin, Proc. Natl. Acad. Sci. U. S. A., 2012, 109, 17354–17359 CrossRef CAS.
- T. Koop, J. Bookhold, M. Shiraiwa and U. Pöschl, Phys. Chem. Chem. Phys., 2011, 13, 19238–19255 RSC.
- U. Pöschl, T. Letzel, C. Schauer and R. Niessner, J. Phys. Chem. A, 2001, 105, 4029–4041 CrossRef.
- N.-O. A. Kwamena, J. A. Thornton and J. P. D. Abbatt, J. Phys. Chem. A, 2004, 108, 11626–11634 CrossRef CAS.
- S. Zhou, A. Lee, R. D. McWhinney and J. P. D. Abbatt, J. Phys. Chem. A, 2012, 116, 7050–7056 CrossRef CAS.
- M. Shiraiwa, R. M. Garland and U. Pöschl, Atmos. Chem. Phys., 2009, 9, 9571–9586 CrossRef CAS.
- M. Shiraiwa, C. Pfrang and U. Pöschl, Atmos. Chem. Phys., 2010, 10, 3673–3691 CrossRef CAS.
- N.-O. A. Kwamena, M. G. Staikova, D. J. Donaldson, I. J. George and J. P. D. Abbatt, J. Phys. Chem. A, 2007, 111, 11050–11058 CrossRef CAS.
- E. N. Escorcia, S. J. Sjostedt and J. P. D. Abbatt, J. Phys. Chem. A, 2010, 114, 13113–13121 CrossRef CAS.
- A. Zelenyuk, J. Yang, C. Song, R. A. Zaveri and D. Imre, Environ. Sci. Technol., 2008, 42, 8033–8038 CrossRef CAS.
- T. D. Vaden, C. Song, R. A. Zaveri, D. Imre and A. Zelenyuk, Proc. Natl. Acad. Sci. U. S. A., 2010, 107, 6658–6663 CrossRef CAS.
- C. L. Badger, P. T. Griffiths, I. George, J. P. D. Abbatt and R. A. Cox, J. Phys. Chem. A, 2006, 110, 6986–6994 CrossRef CAS.
- S. C. Park, D. K. Burden and G. M. Nathanson, J. Phys. Chem. A, 2007, 111, 2921–2929 CrossRef CAS.
- D. A. Knopf, L. M. Cosman, P. Mousavi, S. Mokamati and A. K. Bertram, J. Phys. Chem. A, 2007, 111, 11021–11032 CrossRef CAS.
- L. M. Cosman and A. K. Bertram, J. Phys. Chem. A, 2008, 112, 4625–4635 CrossRef CAS.
- L. M. Cosman, D. A. Knopf and A. K. Bertram, J. Phys. Chem. A, 2008, 112, 2386–2396 CrossRef CAS.
- D. J. Stewart, P. T. Griffiths and R. A. Cox, Atmos. Chem. Phys., 2004, 4, 1381–1388 CrossRef CAS.
- J. A. Thornton and J. P. D. Abbatt, J. Phys. Chem. A, 2005, 109, 10004–10012 CrossRef CAS.
- V. F. McNeill, J. Patterson, G. M. Wolfe and J. A. Thornton, Atmos. Chem. Phys., 2006, 6, 1635–1644 CrossRef CAS.
- V. F. McNeill, G. M. Wolfe and J. A. Thornton, J. Phys. Chem. A, 2007, 111, 1073–1083 CrossRef CAS.
- A. Rouviere and M. Ammann, Atmos. Chem. Phys., 2010, 10, 11489–11500 CrossRef CAS.
- B. T. Mmereki and D. J. Donaldson, Phys. Chem. Chem. Phys., 2002, 4, 4186–4191 RSC.
- M. Folkers, T. F. Mentel and A. Wahner, Geophys. Res. Lett., 2003, 30, 1644, DOI:10.1029/2003GL017168.
- S. V. Glass, S.-C. Park and G. M. Nathanson, J. Phys. Chem. A, 2006, 110, 7593–7601 CrossRef CAS.
- D. K. Burden, A. M. Johnson and G. M. Nathanson, J. Phys. Chem. A, 2009, 113, 14131–14140 CrossRef CAS.
- S. C. Park, D. K. Burden and G. M. Nathanson, Acc. Chem. Res., 2009, 42, 379–387 CrossRef CAS.
- S. N. Henderson and D. J. Donaldson, J. Phys. Chem. A, 2012, 116, 423–429 CrossRef.
- S. T. Martin, Chem. Rev., 2000, 100, 3403–3453 CrossRef CAS.
- M. L. Smith, M. Kuwata and S. T. Martin, Aerosol Sci. Technol., 2011, 45, 244–261 CrossRef CAS.
- M. Shiraiwa, M. Ammann, T. Koop and U. Pöschl, Proc. Natl. Acad. Sci. U. S. A., 2011, 108, 11003–11008 CrossRef CAS.
- C. Marcolli and U. K. Krieger, J. Phys. Chem. A, 2006, 110, 1881–1893 CrossRef CAS.
- V. G. Ciobanu, C. Marcolli, U. K. Krieger, U. Weers and T. Peter, J. Phys. Chem. A, 2009, 113, 10966–10978 CrossRef CAS.
- A. K. Bertram, S. T. Martin, S. J. Hanna, M. L. Smith, A. Bodsworth, Q. Chen, M. Kuwata, A. Liu, Y. You and S. R. Zorn, Atmos. Chem. Phys., 2012, 11, 10995–11006 CrossRef.
- M. Song, C. Macolli, U. K. Krieger, A. Zuend and T. Peter, Atmos. Chem. Phys., 2012, 12, 2691–2712 CrossRef CAS.
- A. Zuend and J. H. Seinfeld, Atmos. Chem. Phys., 2012, 12, 3857–3882 CrossRef CAS.
- M. Ammann, U. Pöschl and Y. Rudich, Phys. Chem. Chem. Phys., 2003, 5, 351–356 RSC.
- A. Maranzana, G. Serra, A. Giordana, G. Tonachini, G. Barco and M. Causa, J. Phys. Chem. A, 2005, 109, 10929–10939 CrossRef CAS.
- A. Giordana, A. Maranzana, G. Ghigo, M. Causa and G. Tonachini, J. Phys. Chem. A, 2008, 112, 973–982 CrossRef CAS.
- M. Shiraiwa, Y. Sosedova, A. Rouviere, H. Yang, Y. Zhang, J. P. D. Abbatt, M. Ammann and U. Pöschl, Nat. Chem., 2011, 3, 291–295 CrossRef CAS.
- M. Kanakidou, J. H. Seinfeld, S. N. Pandis, I. Barnes, F. J. Dentener, M. C. Facchini, R. Van Dingenen, B. Ervens, A. Nenes, C. J. Nielsen, E. Swietlicki, J. P. Putaud, Y. Balkanski, S. Fuzzi, J. Horth, G. K. Moortgat, R. Winterhalter, C. E. L. Myhre, K. Tsigaridis, E. Vignati, E. G. Stephanou and J. Wilson, Atmos. Chem. Phys., 2005, 5, 1053–1123 CrossRef CAS.
- J. H. Kroll and J. H. Seinfeld, Atmos. Environ., 2008, 42, 3593–3624 CrossRef CAS.
- G. D. Smith, E. Woods, C. L. DeForest, T. Baer and R. E. Miller, J. Phys. Chem. A, 2002, 106, 8085–5095 CrossRef CAS.
- M. D. King, A. R. Rennie, K. C. Thompson, F. N. Fisher, C. C. Dong, R. K. Thomas, C. Pfrang and A. V. Hughes, Phys. Chem. Chem. Phys., 2009, 11, 7699–7707 RSC.
- T. F. Kahan, N. O. A. Kwamena and D. J. Donaldson, Atmos. Environ., 2006, 40, 3448–3459 CrossRef CAS.
- C. Liu, P. Zhang, B. Yang, Y. Wang and J. Shu, Environ. Sci. Technol., 2012, 46, 7575–7580 CrossRef CAS.
- J. McCabe and J. P. D. Abbatt, J. Phys. Chem. C, 2009, 113, 2120–2127 CAS.
- E. Mikhailov, S. Vlasenko, S. T. Martin, T. Koop and U. Pöschl, Atmos. Chem. Phys., 2009, 9, 9491–9522 CrossRef CAS.
- V. S. Semeena, J. Feichter and G. Lammel, Atmos. Chem. Phys., 2006, 6, 1231–1248 CrossRef CAS.
- G. Lammel, A. M. Sehili, T. C. Bond, J. Feichter and H. Grassl, Chemosphere, 2009, 76, 98–106 CrossRef CAS.
- A. Zelenyuk, D. Imre, J. Beránek, E. Abramson, A. Wilson and M. Shrivastava, Environ. Sci. Technol., 2012, 46, 12459–12466 CrossRef CAS.
- R. W. MacDonald, L. A. Barrie, T. F. Bidleman, M. L. Diamond, D. J. Gregor, R. G. Semkin, W. M. J. Strachan, Y. F. Li, F. Wania, M. Alaee, L. B. Alexeeva, S. M. Backus, R. Bailey, J. M. Bewers, C. Gobeil, C. J. Halsall, T. Harner, J. T. Hoff, L. M. M. Jantunen, W. L. Lockhart, D. Mackay, D. C. G. Muir, J. Pudykiewicz, K. J. Reimer, J. N. Smith, G. A. Stern, W. H. Schroeder, R. Wagemann and M. B. Yunker, Sci. Total Environ., 2000, 254, 93–234 CrossRef CAS.
- R. Lohmann and G. Lammel, Environ. Sci. Technol., 2004, 38, 3793–3803 CrossRef CAS.
| This journal is © The Royal Society of Chemistry 2013 |