 Open Access Article
Creative Commons Attribution 3.0 Unported Licence
Ultrafast excited state dynamics of the green fluorescent protein chromophore and its kindling fluorescent protein analogue
Kiri
Addison
,
Ismael A.
Heisler
,
Jamie
Conyard
,
Tara
Dixon
,
Philip C.
Bulman Page
and
Stephen R.
Meech
*
School of Chemistry, University of East Anglia, Norwich Research Park, Norwich NR4 7TJ. E-mail: s.meech@uea.ac.uk
First published on 1st March 2013
Abstract
Fluorescent proteins exhibit a very diverse range of photochemical behaviour, from efficient fluorescence through photochromism to photochemical reactivity. Remarkably this diverse behaviour arises from chromophores which have very similar structures. Here we describe measurements and modelling of the excited state dynamics in the chromophores of GFP (HBDI) and the kindling fluorescent protein, KFP (FHBMI). The methods are ultrafast fluorescence spectroscopy with sub 50 fs time resolution and the modelling is based on the Smoluchowski equation. The excited state decays of both chromophores are very fast, longer for their anions than for the neutral form and independent of wavelength. Detailed studies show the mean fluorescence wavelength to be independent of time. The excited state decay times are also observed to be a very weak function of solvent polarity and viscosity. These results are modelled utilising recently calculated potential energy surfaces for the ground and excited states as a function of the twist coordinates about the two bridging bonds of the chromophore. For FHBMI and the scarce data on the neutral HBDI the calculations are not successful suggesting the need for refinement of these potential energy surfaces. For HBDI in methanol the simulation is successful provided a strong dependence of the radiationless decay rate on the coordinate is assumed. Such dependence should be included in future calculations of excited state dynamics. When the simulations are extended to more viscous solvents they fail to reproduce the observed weak viscosity dependence. The implications of these results for the nature of the coordinate leading to radiationless decay in the chromophore and for the photodynamics of fluorescent proteins are discussed.
Introduction
Soon after it was first isolated and expressed, the green fluorescent protein (GFP) became established as a key tool in cell biology.1–4 GFP, and its more photostable and fluorescent mutants,5 are readily cloned and expressed attached to a target protein, making the expression and subsequent location of that protein in the living cell visible to fluorescence imaging. This new technology sparked a revolution in bioimaging which continues to the present time. The chromophore responsible for the green fluorescence, 4-hydroxybenzylidene-2,3-dimethylimidazolinone (HBDI, Fig. 1) was characterized and isolated by Niwa and co-workers.6,7 The chromophore is formed in vivo in an intramolecular reaction between three adjacent amino acids.8 Mutations in GFP can modify either the chromophore or its immediate environment in a way that tunes the spectrum across the entire visible range, facilitating multicolour imaging and the imaging of protein-protein interactions through fluorescence resonance energy transfer.5 Recent advances in protein engineering mean that the chromophore can be modified with unnatural amino acids, expanding the range of possible colours.9 It has been shown that some relatively minor changes to the chromophore (such as methylation in the phenyl group, the location of the OH group) can have a dramatic effect on the electronic spectrum.10,11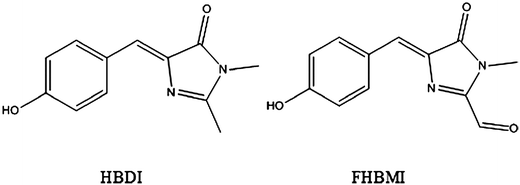 | ||
| Fig. 1 The chemical structures of HBDI and FBHMI in their neutral states. The anion states are deprotonated at the phenol OH. | ||
This remarkable advance in bioimaging stimulated a search for other fluorescent proteins (FPs) and a broad family has now been identified.5,12–14 Intriguingly, HBDI (or chromophores very similar to it) demonstrate an extraordinarily diverse range of photophysical behaviour in these different protein environments. While the anionic state of the chromophore in wild type GFP is strongly fluorescent, the same state in other FPs is only weakly fluorescent (such proteins being better labelled as chromoproteins). In other FPs the chromophore undergoes a photochemical reaction with an adjacent amino acid to generate a new chromophore with a different emission spectrum.15,16 Such proteins (e.g. kaede) have been used as ‘optical highlighters’ to label specific populations of proteins in situ. Other proteins, such as dronpa and its relatives, exhibit photochromism, where the protein can be reversibly and repeatedly photochemically switched between two optical states.17–19 These photochromic FPs have proven extremely valuable in the development of novel ultra-resolution fluorescence microscopies with a sub-Rayleigh limit spatial resolution of a few tens of nanometres.20–22
This unexpectedly diverse behaviour has fuelled interest in the photophysics of HBDI itself. It was established that the strong fluorescence of GFP is quenched when the protein is denatured, and that HBDI in fluid solution is very weakly fluorescent (quantum yield of ca 0.2 × 10⁻⁴). However, fluorescence is recovered by freezing the solution to the glass transition temperature.6,7,23,24 It was demonstrated through ultrafast spectroscopy that the mechanism of rapid radiationless decay was internal conversion on the picosecond timescale, and that this is a property exhibited by all three readily accessible charge states (neutral, anion and cation) of the chromophore.25–27 A number of derivatives of HBDI have been prepared that modify, in some cases quite dramatically, the electronic spectra of the chromophore. However, in most cases radiationless decay remains ultrafast.11,28 One feature these derivatives have in common is the methine bridge linking the two aromatic rings, so it appears likely that the radiationless decay coordinate involves reorganization about this group. Consistent with this, illumination of HBDI in its stable cis state was found to lead to formation of the metastable trans form.29 The spectra of the two isomers are similar and their excited state decays are indistinguishable.30 Further evidence for the importance of structural reorganization in the methine bonds comes from the observed suppression of radiationless decay when motion about these bonds is restricted,31,32 and from the observation that a sterically crowded derivative of HBDI, with a twisted ground state, exhibits enhanced radiationless relaxation.11
Detailed experimental studies of the excited state decay of HBDI showed that the decay rate is only moderately sensitive to solvent viscosity and solvent polarity, although fluorescence is recovered as the glass transition temperature is approached, i.e. in very viscous media.26,27,33 The observed temperature dependence and weak dependence on viscosity suggested that a volume-conserving coordinate couples the excited state to the ground state over a small or zero energy barrier. The weak dependence on solvent polarity suggests that the radiationless decay does not require stabilization of a charge transfer state.
Early theoretical calculations suggested that the most likely volume-conserving coordinate associated with the methine bridge, the “hula twist”, is energetically up-hill, and so incompatible with the observed near barrierless ultrafast relaxation.34,35 Thus, the details of the radiationless decay mechanism and the mechanism by which the protein matrix renders the chromophore strongly fluorescent are incompletely understood. There have been a number of high quality theoretical calculations concerning the excited state dynamics of HBDI.36–46 In a number of cases these calculations (which mainly refer to the gas phase) have investigated excited state dynamics, and two possible pathways leading to radiationless decay to the ground state have been suggested. These involve rotations about either of the two methine bridge bonds. In both cases the coordinates are barrierless or nearly so, consistent with the observed ultrafast decay in fluid solution. These calculations are also in good agreement with recent experimental observation of the ultrafast dynamics of HBDI in the gas phase, where the initially excited Franck–Condon state relaxed to a twisted intermediate in a few hundred femtoseconds, and from the twisted state to the ground state in about 1 ps.47 The success of these calculations in the gas phase is important, but does not address the mechanism of fluorescence enhancement in the protein. There have been a number of attempts to incorporate some representation of the medium into the calculations, either as a continuum or using the actual structure of the protein.44,48 However, none of these include dynamics associated with the environment.
In this work we extend our time-resolved studies of HBDI fluorescence to include a detailed analysis of the time-dependent emission spectrum. We also compare data on HBDI with measurements on a newly synthesised derivative of HBDI related to the chromophore of the kindling fluorescent protein (KFP), specifically 2-formyl-4-hydroxybenzylidene-3-methylimidazolinone, FHBMI, Fig. 1. KFP is one of the photoactive proteins in which a fluorescent state can be photochemically generated;49,50 the excited state potential energy surface of the KFP chromophore (2-acetyl-4-hydroxybenzylidene-3-methylimidazolinone, FHBMI) was investigated by Olsen.37 The time-dependent spectra observed here are modelled using a generalized Smoluchowski equation. Similar models have previously been applied to probe excited state dynamics, initially for electron transfer reactions by Barbara and co-workers and extended to excited state structural dynamics by Glasbeek and co-workers.51–54 This approach has since found wide application in studies of excited state reactions in a variety of solutes and environments, but usually relying on a model potential energy surface generated from coupling neutral reactant and charge separated (product) harmonic surfaces.55–61 Here we replace the model PES with one determined from theoretical calculations, specifically the calculations of Olsen for both HBDI and AHBMI in their anion states.36,37 We then incorporate realistic models of the solvent friction experienced by the assumed reaction coordinate for the FP chromophore. We further extend these calculations using the model PESs generated from the much more limited calculations on the neutral chromophore,45 and thus discuss the neutral chromophore dynamics. In this way we endeavour to combine realistic calculated potential energy surfaces with a realistic model of the medium.
Experimental
The experimental arrangement for fluorescence upconversion has been described in detail elsewhere, and is based on a 1 W 100 MHz titanium sapphire laser generating sub 20 fs pulses centered at 800 nm.55 The excitation wavelength was usually the second harmonic at 400 nm with power up to 9 mW. Fluorescence was detected by a reflective microscope objective and focused into a thin nonlinear crystal where it was mixed with the residual 800 nm pulses, which were routed via a delay stage that controls the timing with femtosecond accuracy. The resulting sum frequency intensity samples the instantaneous fluorescence intensity at the arrival time of the 800 nm pulse. Thus the temporal resolution is limited only by the pulsewidths of the 400 and 800 nm pulses. Careful control of the dispersion in each beam yields a time resolution of 45 fs, determined by measuring the upconverted Raman scattering of heptane. An example of one time-resolved measurement on neutral HBDI in methanol is shown in Fig. 2. As has been noted previously the decay is ultrafast and departs somewhat from a simple single exponential.27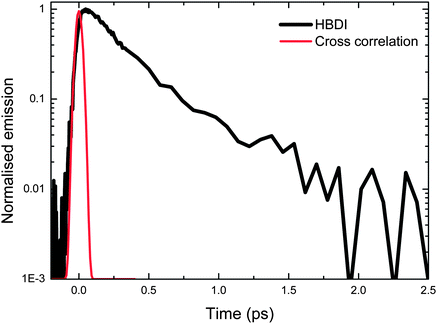 | ||
| Fig. 2 Example of the measured fluorescence decay of neutral HBDI (black). The up-conversion of the solvent Raman signal scattered from the pump pulse is shown (red). This determines the time resolution of the experiment. | ||
HBDI was prepared by standard methods, and the synthesis of FHBMI will be detailed elsewhere.6 All samples were made up to have an OD of roughly 0.5 at the excitation wavelength in a 1 mm pathlength cell (typically a concentration of 0.5 mM).
To construct the time-resolved emission spectra, fluorescence decay profiles were recorded across the emission spectrum by selecting the phase matching condition in the up-converting nonlinear crystal and tuning the wavelength of the SFG detection monochromator. These individual wavelength-resolved temporal profiles are area normalized to the corresponding intensity in the steady state emission spectra to create a three dimensional time–intensity–wavelength surface. In a number of cases the range of detection wavelengths was limited by scattered pump radiation (a particular problem with short pulse broadband radiation). In these cases two-photon excitation was used, as has been described by Joo et al.62 For these experiments a separate optical pathway for the pump beam was constructed, again with separate dispersion compensation. In this case the time resolution was measured as 60 fs.
Results and discussion
Steady state absorption and emission data for FHBMI are compared with those for HBDI in Fig. 3. In Table 1 the decay parameters for fluorescence decays measured at the peak wavelength of the emission spectra are also compared. Both absorption and emission spectra for FHBMI are slightly red-shifted from that of HBDI for both the neutral and anionic forms. The small shift in the anion spectrum on replacement of a weakly donating methyl group with the electron-withdrawing CHO group is in marked contrast to the large effect of exchanging a hydrogen for methyl on the phenolic ring reported previously.11 The relatively benign nature of the methyl for formyl substitution is confirmed by the fluorescence decay times which are very similar for HBDI and FHBMI in both neutral and anion states. The similarity of HBDI and FHBMI in both charge states contrasts with the very different spectroscopic and photochemical properties of GFP and KFP.63,64 This is further evidence of the critical role played by protein structure and by specific interactions between the chromophore and adjacent amino acid residues in determining the photophysical properties of FPs.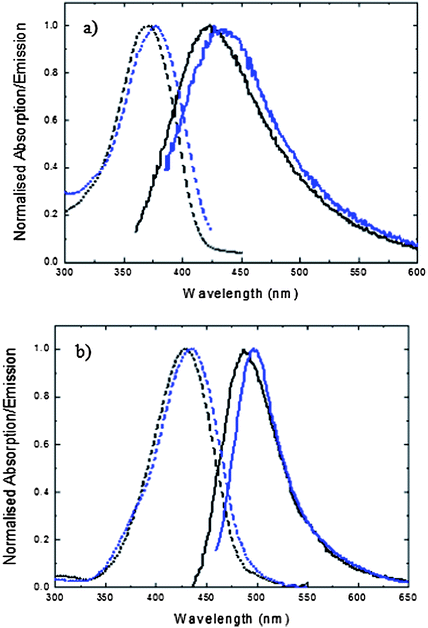 | ||
| Fig. 3 Steady state absorption (dashed line) and emission (solid line) spectra of HBDI (black) and FHBMI (blue) in methanol: (a) neutral form (b) anionic form. | ||
| Neutral HBDI | Anionic HBDI | Neutral FHBMI | Anionic FHBMI | |
|---|---|---|---|---|
| a1 | 1.30 | 0.64 | 0.60 | 0.82 |
| τ1/ps | 0.28 | 0.57 | 0.31 | 0.35 |
| a2 | — | 0.54 | 0.62 | 0.29 |
| τ2/ps | — | 0.69 | 0.27 | 1.12 |
| <τ> /ps | 0.28 | 0.62 | 0.29 | 0.55 |
The most complete representation of excited state dynamics comes not from the single wavelength measurements reported in Table 1, but from observations of the temporal evolution of the entire emission spectrum. Such time-resolved spectra are readily obtained from wavelength-intensity slices of the intensity - time - energy surface described above. Examples are shown for HBDI and FHBMI in methanol in Fig. 4. The data points are well represented by a fit to the log-normal function:
 | (1) |
![[small nu, Greek, macron]](https://www.rsc.org/images/entities/i_char_e0ce.gif) −
− ![[small nu, Greek, macron]](https://www.rsc.org/images/entities/i_char_e0ce.gif) p]Γ. The amplitude is h, γ the asymmetry parameter, Γ the width parameter, and
p]Γ. The amplitude is h, γ the asymmetry parameter, Γ the width parameter, and ![[small nu, Greek, macron]](https://www.rsc.org/images/entities/i_char_e0ce.gif) p the peak wavenumber. These log-normal parameters form the basis for further analysis of the time-resolved spectra. In Fig. 5 the time dependence of the mean frequency (first moment) and integrated intensity of the log-normal fits are displayed.
p the peak wavenumber. These log-normal parameters form the basis for further analysis of the time-resolved spectra. In Fig. 5 the time dependence of the mean frequency (first moment) and integrated intensity of the log-normal fits are displayed.
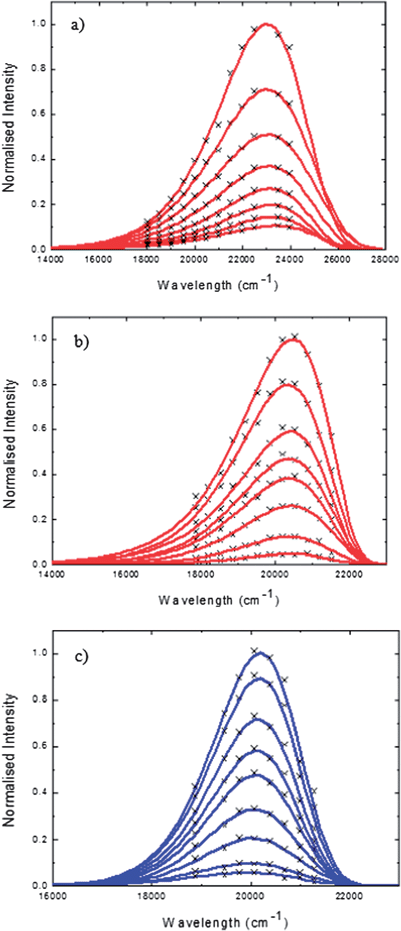 | ||
| Fig. 4 Time-resolved emission spectra (points) fit to the log–normal function (lines) for (a) neutral HBDI 50 fs to 800 fs (b) anionic HBDI 50 fs to 2ps (c) anionic FHBMI 50 fs to 2 ps. Solvent methanol, excitation wavelength 400 nm. | ||
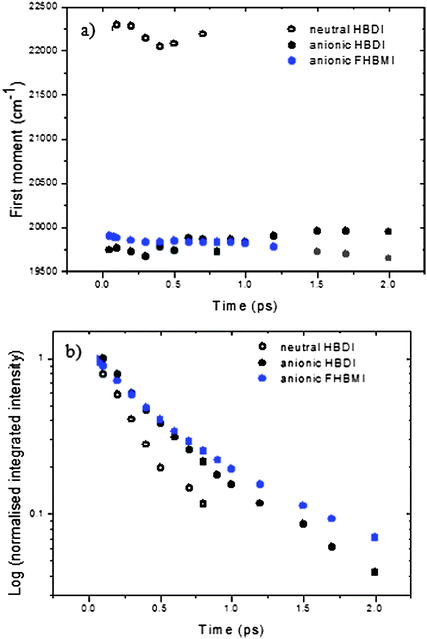 | ||
| Fig. 5 Time dependence of the (a) first moment and (b) integrated intensity for HBDI (black) and FBHMI (blue) recovered from the log normal plots. Open symbols neutral, closed anion. | ||
The integrated intensity represents the time-dependent excited state population (assuming there is no temporal evolution in the transition moment) and can be seen to be non-single exponential for both chromophores. The anionic states are longer lived than the neutral for both FHBMI and HBDI, consistent with what was observed in the single wavelength study (Table 1). Equally significant is the observation that the mean frequency of the spectrum is essentially independent of time in all cases (Fig. 5a). A time-dependent shift in the spectrum is expected in (at least) two eventualities. First, if the excited electronic state has a significantly different dipole moment to the ground state, then solvation dynamics should stabilise the new excited state, resulting in a time-resolved red shift in the emission spectrum occurring on the timescale of solvent reorganization.65 Second, if the excited state relaxes along a coordinate which causes closer approach of ground and excited states, and the transition moment remains finite, the emission is predicted to shift to the red with time. Thus, the fact that no time-dependent shift is observed places important constraints on the nature of the excited state dynamics.
The starting point for our simulation of the time-dependent spectra are the potential energy surfaces calculated by Olsen for the ground and excited states of HBDI and AHBMI, a molecule closely related to FHBMI, in their anionic states (which are typically the fluorescent states in FPs). Calculations were made using two different sets of surfaces for the anion, one based on a state-averaged CASSCF model and the second on a perturbation theory-corrected CASSCF model (MR).37 The calculation was made as a function of the reaction coordinate which includes both double and single bond twist coordinates of the methine bridge (Fig. 1), varying between 0 and 90°, and these together create a single PES. We restrict our attention to chromophores which are initially in their cis ground state; we have shown elsewhere that cis and trans HBDI have indistinguishable excited state decay times, which accords with the very similar shapes of their calculated PES.66
These PES are input to the generalized Smoluchowski eqn (2), which describes the diffusive evolution of a population density ρ(z,t) under a diffusion coefficient D (calculated from the Stokes–Einstein–Debye equation) along the calculated PES [S1(z)] where z is a generalised twist coordinate.54
 | (2) |
In previous approaches using (2) to simulate time-dependent spectra the generally unknown coordinate dependence of the excited state PES was calculated assuming coupling between harmonic bright and dark states.52,54 In the present case we digitized published PESs for HBDI and FHBMI anions and fit them to polynomials for the calculation of ρ(z,t) using (2). The last term in eqn (2) describes nonradiative decay from the excited state to the ground state, where Γ(z) is a coordinate-dependent probability for decay back to the ground state (a ‘sink’ function). Several forms can be chosen for Γ(z) but in this work a pair of Gaussians function was chosen, described by:
 | (3) |
| Ifl(t) ∝ ∫dz g(ν0(z),ν(z) − ν0(z))M2(z)ρ(z,t)ν3 | (4) |
| IA ∝ ∫dz g(ν0(z),ν(z) − ν0(z))M2(z)ρ(z,0). | (5) |
The M(z) in (4) and (5) accounts for the possibility that the transition moment may be a function of the twist coordinate. This has already been shown to be the case for a methylated HBDI derivative in which the substituents twist the methine bond away from the most stable planar state through steric crowding, giving rise to a weaker transition moment.11 To model the transition moment in (4) and (5) we use an arbitrary function which has the property of going to zero at the 90° twist angles.
| M2(z) = tan−1[a(z + b)] − tan−1[a(z − b)] | (6) |
The relevant coordinate-dependent parameters for the simulation are plotted in Fig. 6.
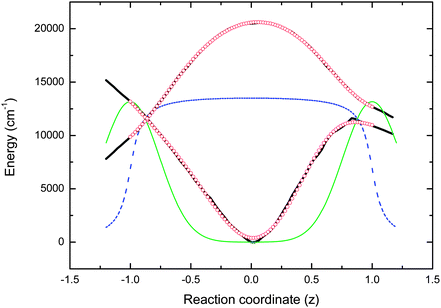 | ||
| Fig. 6 Parameters used in the simulations. Solid and dashed black lines are the ground and excited state PESs calculated by Olsen. The red circles are polynomial fits to the PES used in the simulation. The green line is the Gaussian decay functions and the dashed blue line is the coordinate dependent transition moment. | ||
Fig. 6 shows that electronic excitation of the planar ground state generates a Franck–Condon excited state, in which the molecule is on a nearly flat region of the PES and able to undergo barrierless or near barrierless twisting about one or both bridging bonds. These features are common to a number of other calculated PESs for HBDI. Excited state dynamics are typically obtained from these calculations by following a minimum energy pathway for the excited state, as it relaxes down the twisting and stretching coordinates. A consequence of this twisting is an increase in the energy of the ground state until at some point the two PESs approach one another or merge at a conical intersection. Once the PESs become sufficiently close it is assumed that internal conversion from excited to ground state occurs, consistent with the known ultrafast relaxation of HBDI in solution.
In line with this scenario we have calculated the excited state dynamics for the HBDI anion in methanol according to eqn (2) (the choice of D being discussed further below). Since the theoretical calculations described above typically include neither a coordinate dependence of the transition moment nor a rate for the radiationless decay, we initially set the second term in (2) to zero to focus on the dynamics of the population density. The resulting ρ(z,t), calculated time-resolved emission spectra and mean emission frequency are plotted in Fig. 7, using the M2(z) in Fig. 6. This procedure predicts a time-dependent spectral shift in the emission spectrum after excitation, arising from the approach of ground and excited state surfaces with increasing z. This does not agree with the experimentally observed time independent spectrum (Fig. 5). It is shown below that the experimental result can only be reproduced when the simulation incorporates a coordinate dependence of both the transition moment and rate of decay to the ground state.
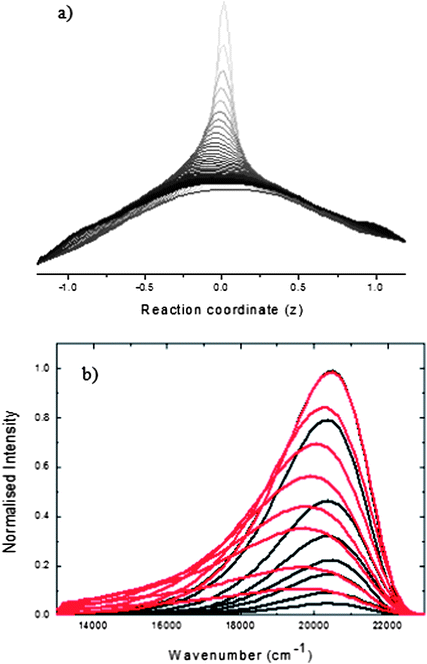 | ||
| Fig. 7 (a) the ρ(z,t) calculated from (2) with the final term omitted (no decay function) The population decays at Franck-Condon position z = 0 and builds up at z = ±1. (b) The spectra calculated for the data in (a) using (4) and (5). | ||
To simulate the spectra we assume a form for M2(z) (Fig. 6) and calculate ρ(z,t) adjusting the parameters of Γ(z) to obtain a best fit to the calculated absorption and time-dependent emission spectra using (4) and (5). The results for HBDI are shown in Fig. 8. In this case a good fit to the spectral shape and amplitude is obtained, but it does require a strong dependence of the rate of internal conversion on the twist coordinate (the actual example recovered from the fit is shown in Fig. 6). Within this simple one dimensional representation such a coordinate dependence is essential to reproduce the time-independent mean frequency observed (Fig. 5): a narrower Gaussian (i.e. a ‘pinhole sink’) and a smaller k lead to a red shift in the spectrum with time. The results in Fig. 8 were obtained with a fixed M2(z) and varying Γ(z). Clearly these two parameters can have compensating effects, and fixing Γ(z) and varying M2(z) achieves similar (but less good) fits. These two cases do, however, correspond to physically different phenomena, and should be distinguished. In Fig. 8 decay is directly to the ground state, as a consequence of the second term in (2). The alternative corresponds to the build up of a population in the twisted state (analogous to the results seen in Fig. 7) which does not contribute to the emission due to a M2(z) which falls to zero rapidly with increasing |z|. These two cases are distinguishable by studying transient absorption spectra, to which a twisted dark state may be expected to contribute. We have measured transient infra-red spectroscopy of HBDI (neutral) in solution and find that the excited state decays on a sub-picosecond timescale to yield a vibrationally hot ground state which cools in picoseconds. This is consistent with efficient internal conversion, i.e. a dominant role for kΓ(z) in the decay.
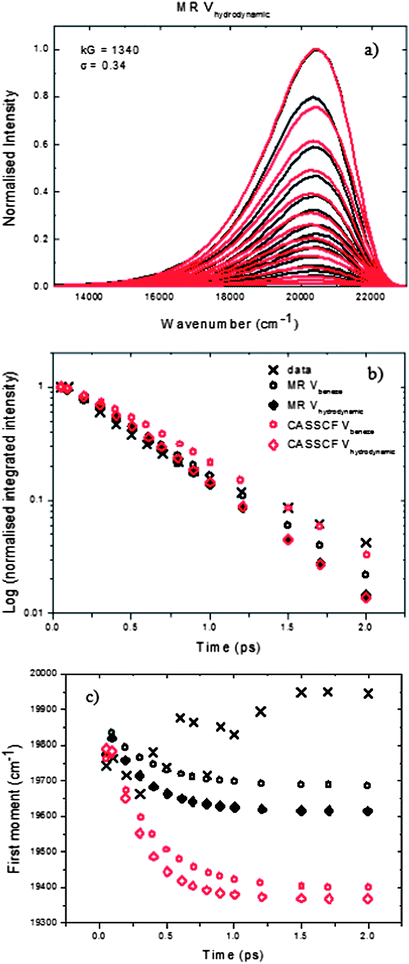 | ||
| Fig. 8 (a) Comparison of the spectra calculated using eqn (5) (red) and the log normal fits to the data (black), eqn (1), for the HBDI anion in methanol using the hydrodynamic volume. (b) and (c) Calculated integrated intensity and first moment of the spectra using the volume of benzene (circles) and the hydrodynamic volume (diamonds) for D in (2) (see text for details) for the MR surfaces (black) and the CASSCF surfaces (red). Data are for HBDI (black crosses). | ||
Fig. 8a shows the fits obtained for anionic HBDI using the MR surfaces with the hydrodynamic volume used for D (the choices for D being either a measured hydrodynamic volume or a calculated benzene ring volume, see below).37,67 In S1 the equivalent fits obtained using the volume of benzene for D and the CASSCF surfaces are shown. The time dependence of the integrated intensity and first moment for all fits are shown in 8b and c. As taken from Olsen's paper, the S0 CASSCF and MR surfaces differ by approximately 1300 cm−1 at 0°, while on the S1 surface, the CASSCF surface is approximately 10700 cm−1 higher in energy. Once adjusted vertically to match the experimental absorption and t = 50 fs resolved fluorescence spectrum, there is no energy difference between the S1 states at 0°, where the absorption takes place, but at 90° the flatter MR surface is roughly 7000 cm−1 higher in energy. The surfaces provide reasonable fits to the experimental data at early times. Using the benzene volume provides a better fit to the integrated intensity after 1 ps, with the CASSCF surface giving the better fit overall. The hydrodynamic volume is, however, better at earlier times, with little difference between the MR and CASSCF surfaces. None of the fits reproduce the small blue shift seen experimentally, but these variations are on the same scale as the precision of the calculated spectra. All fits required the broad (large σ) and deep (large k) sinks shown in Fig. 6.
In contrast to these results for HBDI, the same calculation failed for FHBMI. Since the experimental spectra do not appear to be significantly different it is likely that the failure reflects a less suitable PES for this molecule. This may arise from one of two causes. First, that there was some shortcoming in calculation for the more complex chromophore. Alternatively, the chromophore we have studied differs from that calculated by the exchange of a methyl for hydrogen (or a formyl for an acetyl substitution); this may have a significant effect on the PES.
In Fig. 9 we compare the calculated potential surface for the HBDI anion with a recent calculation for the energy of the neutral form at 0° and 90° torsion about the double bond.37 The neutral form of HBDI presents a much more challenging case for accurate calculation than the anion,45 explaining the relative paucity of theoretical results with which to model the data. To obtain a PES for simulation of the neutral HBDI (Fig. 9a) the anionic surface has been scaled to match the two neutral points at 0° and 90°. A gradient was calculated given by the energy difference between the anionic surface and the two points for the neutral energy. This gradient was applied to the anionic surface for the single bond torsion resulting in a calculated coordinate dependent neutral surface connecting the two calculated points. It can be seen that the calculation apparently predicts a flatter PES for the neutral HBDI than for the anion. The constructed PES were vertically shifted to simulate the observed absorption spectrum and then used to calculate the time-dependent fluorescence spectra, assuming the form of M(z) shown in Fig. 6. In Fig. 9b the calculated time dependence of the integrated area predicts a decay for the neutral which is slower than that of the anion, which is opposite to the experimental observations. This underlines the difficulty of accurately calculating the excited state surface for neutral HBDI. This difficulty sets a significant new challenge for theoretical calculations, since the neutral state of HBDI is the one most often responsible for the excited state reactions which are critical in second generation fluorescent proteins.68,69
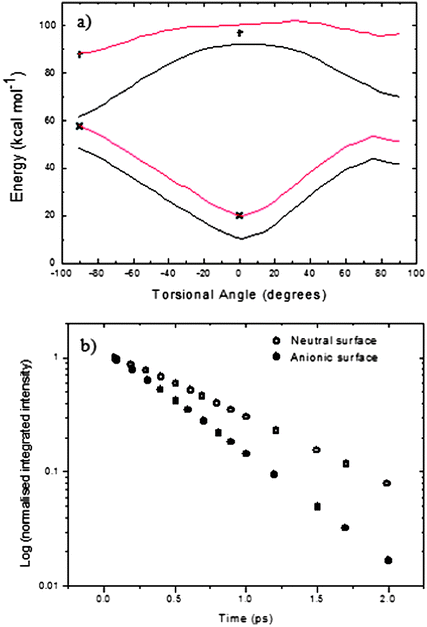 | ||
| Fig. 9 (a) Anionic HBDI S0 and S1 surfaces calculated by Olsen (black). Calculated S0 and S1 neutral HBDI points are shown (black crosses). Neutral surfaces were created by scaling the anionic surfaces to the neutral points (red) (see text for details). (b) Time dependence of the integrated intensity of HBDI predicted by the neutral surface (open circles) and Olsen's anionic surface (filled circles). | ||
Finally we turn to the solvent friction effects on the excited state decay. All of the data above have been presented in methanol solution and the diffusion coefficient has been calculated from the Stokes–Einstein-Debye relation:
 | (7) |
To test this friction model further, the excited state decay times of the HBDI in a series of solvent of varying viscosity were measured (Fig. 10 and Table 2). These measurements were made at two or three wavelengths, which was sufficient to check that the more viscous solvents do not introduce a wavelength dependence (which would in turn indicate a time-dependent spectrum). The excited state decays remained independent of wavelength. The measured ultrafast decay is seen to be only slightly dependent on the solvent viscosity (Fig. 10a) in line with previous observations suggesting a volume-conserving (thus friction independent) reaction coordinate.11,26,27 In contrast, when we apply the corresponding diffusion coefficient (7) in the calculation a very strong viscosity dependence is predicted, dramatically stronger than that observed experimentally (Fig. 10b). This suggests a significant shortcoming in the model for the diffusion in eqn (2), which probably arises because of the significant friction experienced for motion along the coordinates recovered in the calculations.
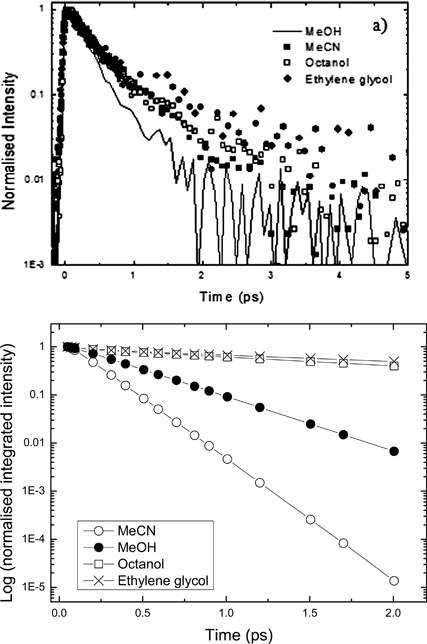 | ||
| Fig. 10 (a) Time-resolved fluorescence decay for HBDI neutral in a range of solvent. (b) Calculated integrated intensity from (2) where D for the appropriate solvent was used and other parameters fixed as for methanol. | ||
| Solvent | a1 | τ1 /ps | a2 | τ 2 /ps | <τ>/ps |
|---|---|---|---|---|---|
| Methanol | 1.30 | 0.28 | — | — | 0.28 |
| Acetonitrile | 1.13 | 0.48 | — | — | 0.48 |
| Octanol | 0.27 | 0.84 | 0.92 | 0.30 | 0.42 |
| Ethylene glycol | 0.30 | 1.12 | 0.81 | 0.30 | 0.52 |
Conclusions
Ultrafast fluorescence spectroscopy of the chromophore of GFP (HBDI) and a molecule closely related to the chromophore of KFP (FHBMI) have been measured in their neutral and anionic states. The spectra and dynamics of the two chromophores in solution are similar, in contrast to the behaviour of the two proteins. This highlights the importance of including the protein matrix in determining the photophysical properties of FPs. The time-resolved fluorescence spectra were measured with a 50 fs time resolution. For both molecules and for neutral and anion states the spectral mean frequency is independent of time.The excited state dynamics of the anionic form of HBDI have been simulated by solving the Smoluchowski equation for diffusion on a potential energy surface. The inputs for the simulations were potential energy surfaces calculated for the chromophore.37,67 The simulation for HBDI accurately reproduced the experimentally observed dynamics in methanol provided a strong coordinate dependence of the radiationless decay rate and transition moment were taken into account. This suggests that the simplest models for excited state dynamics in FP chromophores, relaxation on an excited state PES to a twisted geometry followed by internal conversion to the ground state at that geometry (i.e. at a ‘pinhole sink’ or conical intersection), are inadequate. To reproduce the experimental behaviour theoretical models need to include the possibility of coordinate-dependent rates of radiationless decay, with decay occurring rather early on along the coordinate. An attempt to simulate the faster dynamics observed in the neutral form of the chromophore on the basis of the very limited data for its excited state PES were not successful, suggesting the need for more detailed calculation on the neutral chromophore, which is of particular importance in photochemically active FPs.
Although the model calculations using a realistic PES were successful for the HBDI anion in methanol they completely fail to correctly predict the observed very weak effect of solvent viscosity on lifetime. As suggested elsewhere the observed weak dependence of the HBDI decay time on solvent viscosity is consistent with a volume-conserving isomerization coordinate, i.e. one which displaces a much smaller volume of solvent than either of the single bond rotations which generated the PESs employed here.26,27 The possibility of a volume-conserving ‘hula twist’ coordinate promoting radiationless decay has been considered, but calculations show that this is energetically up-hill, which is inconsistent with the observed ultrafast barrierless nature of the internal conversion.34 An alternative volume conserving radiationless decay coordinate, which was reported to be important in at least some calculations of the excited state dynamics of HBDI, is pyramidalization at the central bridging carbon atom.35,38,40 Such a shape change appears to be sufficiently small to be consistent with the observed weak viscosity dependence. Relaxation along a pyramidalization coordinate has been invoked to account for the ultrafast excited state double bond rotation observed in a family of synthetic molecular motors.71,72
These considerations of the very efficient radiationless decay in HBDI and FHBMI still leave open the question of how the protein tunes the quantum yield of the chromophore between >0.8 and <0.01 depending on the environment. As has been discussed extensively, the electronic spectra of HBDI are shifted significantly on incorporation into GFP.68 This suggests the possibility that the interaction between HBDI and the protein leads to changes in electronic structure, such that the surfaces calculated for the gas phase may not be an accurate representation of the chromophore in the protein. Alternatively protein - chromophore interactions may provide the friction required to resist relaxation along the barrierless PES. It is difficult to see how simple steric crowding in the protein could resist a single bond rotation coordinate, given that there is sufficient room in the cavity of the β-barrel to allow at least one bond to rotate.73 This is especially true as full rotation is evidently not required to promote radiationless decay (Fig. 6). It is yet more difficult to see how such steric crowding could prevent isomerization along a volume-conserving coordinate, which is the nature of the coordinate most consistent with the observed viscosity dependence. We speculate that a motion which may be restricted in the protein, but not in free solution, is the length of the chromophore. Both twisting and pyramidalization will lead to some modulation of the length of the chromophore. At least in the highly fluorescent anionic state of wild type GFP the chromophore is strongly H-bonded at both the phenolic and imidazole rings. The stretching of these H-bonds as a consequence of the excited state dynamics may be sufficient to generate the friction required (or equivalently generate a sufficiently high energy barrier) to suppress the excited state structural relaxation leading to rapid internal conversion. This further highlights the importance of including protein – chromophore interactions when simulating the excited state dynamics of FPs.
Acknowledgements
We are grateful to EPSRC for financial support (EP/H025715/1) and K.A. thanks UEA for the provision of a studentship.References
- R. Y. Tsien, Annu. Rev. Biochem., 1998, 67, 509 CrossRef CAS.
- W. B. Frommer, M. W. Davidson and R. E. Campbell, Chem. Soc. Rev., 2009, 38, 2833 RSC.
- R. H. Newman, M. D. Fosbrink and J. Zhang, Chem. Rev., 2011, 111, 3614 CrossRef CAS.
- V. Sample, R. H. Newman and J. Zhang, Chem. Soc. Rev., 2009, 38, 2852 RSC.
- R. N. Day and M. W. Davidson, Chem. Soc. Rev., 2009, 38, 2887 RSC.
- S. Kojima, H. Ohkawa, T. Hirano, S. Maki, H. Niwa, M. Ohashi, S. Inouye and F. I. Tsuji, Tetrahedron Lett., 1998, 39, 5239 CrossRef CAS.
- H. Niwa, S. Inouye, T. Hirano, T. Matsuno, S. Kojima, M. Kubota, M. Ohashi and F. I. Tsuji, Proc. Natl. Acad. Sci. U. S. A., 1996, 93, 13617 CrossRef CAS.
- R. M. Wachter, J. L. Watkins and H. Kim, Biochemistry, 2010, 49, 7417 CrossRef CAS.
- K. P. Kent, L. M. Oltrogge and S. G. Boxer, J. Am. Chem. Soc., 2009, 131, 15988 CrossRef CAS.
- J. Dong, K. M. Solntsev and L. M. Tolbert, J. Am. Chem. Soc., 2009, 131, 662 CrossRef CAS.
- J. Conyard, M. Kondo, I. A. Heisler, G. Jones, A. Baldridge, L. M. Tolbert, K. M. Solntsev and S. R. Meech, J. Phys. Chem. B, 2011, 115, 1571 CrossRef CAS.
- N. O. Alieva, K. A. Konzen, S. F. Field, E. A. Meleshkevitch, M. E. Hunt, V. Beltran-Ramirez, D. J. Miller, J. Wiedenmann, A. Salih and M. V. Matz, PLoS One, 2008, 3 CAS.
- M. V. Matz, K. A. Lukyanov and S. A. Lukyanov, BioEssays, 2002, 24, 953 CrossRef CAS.
- R. M. Wachter, Photochem. Photobiol., 2006, 82, 339 CrossRef CAS.
- R. Ando, H. Hama, M. Yamamoto-Hino, H. Mizuno and A. Miyawaki, Proc. Natl. Acad. Sci. U. S. A., 2002, 99, 12651 CrossRef CAS.
- H. Mizuno, T. K. Mal, K. I. Tong, R. Ando, T. Furuta, M. Ikura and A. Miyawakil, Mol. Cell, 2003, 12, 1051 CrossRef CAS.
- R. Ando, C. Flors, H. Mizuno, J. Hofkens and A. Miyawaki, Biophys. J., 2007, 92, L97 CrossRef CAS.
- S. Habuchi, R. Ando, P. Dedecker, W. Verheijen, H. Mizuno, A. Miyawaki and J. Hofkens, Proc. Natl. Acad. Sci. U. S. A., 2005, 102, 9511 CrossRef CAS.
- H. Mizuno, T. K. Mal, M. Walchli, A. Kikuchi, T. Fukano, R. Ando, J. Jeyakanthan, J. Taka, Y. Shiro, M. Ikura and A. Miyawaki, Proc. Natl. Acad. Sci. U. S. A., 2008, 105, 9227 CrossRef CAS.
- H. Shroff, C. G. Galbraith, J. A. Galbraith and E. Betzig, Nat. Methods, 2008, 5, 417 CrossRef CAS.
- A. Vaziri, J. Y. Tang, H. Shroff and C. V. Shank, Proc. Natl. Acad. Sci. U. S. A., 2008, 105, 20221 CrossRef CAS.
- M. Bates, B. Huang, G. T. Dempsey and X. W. Zhuang, Science, 2007, 317, 1749 CrossRef CAS.
- K. L. Litvinenko, N. M. Webber and S. R. Meech, Bull. Chem. Soc. Jpn., 2002, 75, 1065 CrossRef CAS.
- N. M. Webber, K. L. Litvinenko and S. R. Meech, J. Phys. Chem. B, 2001, 105, 8036 CrossRef CAS.
- K. L. Litvinenko, N. M. Webber and S. R. Meech, Chem. Phys. Lett., 2001, 346, 47 CrossRef CAS.
- K. L. Litvinenko, N. M. Webber and S. R. Meech, J. Phys. Chem. A, 2003, 107, 2616 CrossRef CAS.
- D. Mandal, T. Tahara and S. R. Meech, J. Phys. Chem. B, 2004, 108, 1102 CrossRef CAS.
- K. M. Solntsev, O. Poizat, J. Dong, J. Rehault, Y. B. Lou, C. Burda and L. M. Tolbert, J. Phys. Chem. B, 2008, 112, 2700 CrossRef CAS.
- V. Voliani, R. Bizzarri, R. Nifosi, S. Abbruzzetti, E. Grandi, C. Viappiani and F. Beltram, J. Phys. Chem. B, 2008, 112, 10714 CrossRef CAS.
- K. Addison, J. Conyard, T. Dixon, P. C. B. Page, K. M. Solntsev and S. R. Meech, J. Phys. Chem. Lett., 2012, 3, 2298 CrossRef CAS.
- L. M. Tolbert, A. Baldridge, J. Kowalik and K. M. Solntsev, Acc. Chem. Res., 2012, 45, 171 CrossRef CAS.
- C. C. Hsieh, P. T. Chou, C. W. Shih, W. T. Chuang, M. W. Chung, J. Lee and T. Joo, J. Am. Chem. Soc., 2011, 133, 2932 CrossRef CAS.
- K. L. Litvinenko and S. R. Meech, Phys. Chem. Chem. Phys., 2004, 6, 2012 RSC.
- W. Weber, V. Helms, J. A. McCammon and P. W. Langhoff, Proc. Natl. Acad. Sci. U. S. A., 1999, 96, 6177 CrossRef CAS.
- M. E. Martin, F. Negri and M. Olivucci, J. Am. Chem. Soc., 2004, 126, 5452 CrossRef CAS.
- S. Olsen and S. C. Smith, J. Am. Chem. Soc., 2007, 129, 2054 CrossRef CAS.
- S. Olsen and S. C. Smith, J. Am. Chem. Soc., 2008, 130, 8677 CrossRef CAS.
- A. Toniolo, S. Olsen, L. Manohar and T. J. Martinez, Faraday Discuss., 2004, 127, 149 RSC.
- B. G. Levine and T. J. Martinez, Annu. Rev. Phys. Chem., 2007, 58, 613 CrossRef CAS.
- A. Toniolo, G. Granucci and T. J. Martinez, J. Phys. Chem. A, 2003, 107, 3822 CrossRef CAS.
- I. Polyakov, E. Epifanovsky, B. Grigorenko, A. I. Krylov and A. Nemukhin, J. Chem. Theory Comput., 2009, 5, 1907 CrossRef CAS.
- K. B. Bravaya, M. G. Khrenova, B. L. Grigorenko, A. V. Nemukhin and A. I. Krylov, J. Phys. Chem. B, 2011, 115, 8296 CrossRef CAS.
- I. V. Polyakov, B. L. Grigorenko, E. M. Epifanovsky, A. I. Krylov and A. V. Nemukhin, J. Chem. Theory Comput., 2010, 6, 2377 CrossRef CAS.
- P. Altoe, F. Bernardi, M. Garavelli, G. Orlandi and F. Negri, J. Am. Chem. Soc., 2005, 127, 3952 CrossRef CAS.
- C. Filippi, M. Ziccheddu and F. Buda, J. Chem. Theory Comput., 2009, 5, 2074 CrossRef CAS.
- J. Y. Hasegawa, K. Fujimoto, B. Swerts, T. Miyahara and H. Nakatsuji, J. Comput. Chem., 2007, 28, 2443 CrossRef CAS.
- C. R. S. Mooney, D. A. Horke, A. S. Chatterley, A. Simperler, H. H. Fielding and J. R. R. Verlet, Chemical Science, 2013 Search PubMed.
- A. Sinicropi, T. Andruniow, N. Ferre, R. Basosi and M. Olivucci, J. Am. Chem. Soc., 2005, 127, 11534 CrossRef CAS.
- D. M. Chudakov, V. V. Belousov, A. G. Zaraisky, V. V. Novoselov, D. B. Staroverov, D. B. Zorov, S. Lukyanov and K. A. Lukyanov, Nat. Biotechnol., 2003, 21, 191 CrossRef CAS.
- D. M. Chudakov, A. V. Feofanov, N. N. Mudriku, S. Lukyanov and K. A. Lukyanov, J. Biol. Chem., 2003, 278, 7215 CrossRef CAS.
- K. Tominaga, G. C. Walker, W. Jarzeba and P. F. Barbara, J. Phys. Chem., 1991, 95, 10475 CrossRef CAS.
- K. Tominaga, G. C. Walker, T. J. Kang, P. F. Barbara and T. Fonseca, J. Phys. Chem., 1991, 95, 10485 CrossRef CAS.
- M. Glasbeek, H. Zhang and M. J. van der Meer, J. Mol. Liq., 2000, 86, 123 CrossRef CAS.
- M. J. van der Meer, H. Zhang and M. Glasbeek, J. Chem. Phys., 2000, 112, 2878 CrossRef CAS.
- I. A. Heisler, M. Kondo and S. R. Meech, J. Phys. Chem. B, 2009, 113, 1623 CrossRef CAS.
- M. Kondo, I. A. Heisler, J. Conyard, J. P. H. Rivett and S. R. Meech, J. Phys. Chem. B, 2009, 113, 1632 CrossRef CAS.
- M. Kondo, I. A. Heisler and S. R. Meech, Faraday Discuss., 2010, 145, 185 RSC.
- M. Kondo, I. A. Heisler and S. R. Meech, J. Phys. Chem. B, 2010, 114, 12859 CrossRef CAS.
- N. Amdursky, Y. Erez and D. Huppert, Acc. Chem. Res., 2012, 45, 1548 CrossRef CAS.
- Y. Erez, N. Amdursky, R. Gepshtein and D. Huppert, J. Phys. Chem. A, 2012, 116, 12056 CrossRef CAS.
- Y. Erez, Y. H. Liu, N. Amdursky and D. Huppert, J. Phys. Chem. A, 2011, 115, 8479 CrossRef CAS.
- C. H. Kim and T. Joo, Opt. Express, 2008, 16, 20742 CrossRef CAS.
- Y. A. Tretyakova, A. A. Pakhomov and V. I. Martynov, J. Am. Chem. Soc., 2007, 129, 7748 CrossRef CAS.
- M. L. Quillin, D. A. Anstrom, X. K. Shu, S. O'Leary, K. Kallio, D. A. Chudakov and S. J. Remington, Biochemistry, 2005, 44, 5774 CrossRef CAS.
- M. L. Horng, J. A. Gardecki, A. Papazyan and M. Maroncelli, J. Phys. Chem., 1995, 99, 17311 CrossRef CAS.
- K. Addison, J. Conyard, T. Dixon, P. C. Bulman Page, K. M. Solntsev and S. R. Meech, J. Phys. Chem. Lett., 2012, 3, 2298 CrossRef CAS.
- S. Olsen and R. H. McKenzie, J. Chem. Phys., 2009, 130, 184302 CrossRef.
- S. R. Meech, Chem. Soc. Rev., 2009, 38, 2922 RSC.
- J. J. van Thor, Chem. Soc. Rev., 2009, 38, 2935 RSC.
- N. A. Smith and S. R. Meech, J. Phys. Chem. A, 2000, 104, 4223 CrossRef CAS.
- J. Conyard, K. Addison, I. A. Heisler, A. Cnossen, W. R. Browne, B. L. Feringa and S. R. Meech, Nat. Chem., 2012, 4, 547 CrossRef CAS.
- A. Kazaryan, J. C. M. Kistemaker, L. V. Schafer, W. R. Browne, B. L. Feringa and M. Filatov, J. Phys. Chem. A, 2010, 114, 5058 CrossRef CAS.
- S. L. Maddalo and M. Zimmer, Photochem. Photobiol., 2006, 82, 367 CrossRef CAS.
| This journal is © The Royal Society of Chemistry 2013 |
