 Open Access Article
 This Open Access Article is licensed under a
 Creative Commons Attribution 3.0 Unported Licence
Fabrication of complex model oxide catalysts: Mo oxide supported on Fe3O4(111)
Chanut Bamroongwongdee, Michael Bowker†*, Albert F. Carley, Philip R. Davies*, Robert J. Davies and Dyfan Edwards
Wolfson Nanoscience Laboratory, Cardiff Catalysis Institute, School of Chemistry, Cardiff University, Park Place, Cardiff, CF10 3AT, UK
First published on 18th December 2012
Abstract
Industrial catalysts for the oxidation of methanol to formaldehyde consist of iron molybdate [Fe2(MoO4)3]. Using a variety of techniques we have previously shown that the surface of these catalysts is segregated in MoO3, and in order to understand the relationship between surface structure and reactivity for these systems we have begun a surface science study of this system using model, single crystal oxides. Model catalysts of molybdenum oxide nanoparticles and films on an Fe3O4(111) single crystal were fabricated by the hot-filament metal oxide deposition technique (HFMOD), where molybdenum oxides were produced using a molybdenum filament heated in an oxygen atmosphere. Low energy electron diffraction (LEED), X-ray photoelectron spectroscopy (XPS), and scanning tunnelling microscopy (STM) have been used to investigate molybdenum oxide nanoparticles and films deposited on Fe3O4(111). The molybdenum oxide film forms in the highest oxidation state, +6, and is remarkably stable to thermal treatment, remaining on the surface to at least 973 K. However, above ∼573 K cation mixing begins to occur, forming an iron molybdate structure, but the process is strongly Mo coverage dependent.
Introduction
Formaldehyde, one of the most important industrial chemicals, is produced from methanol using either silver or iron molybdate catalysts. Over iron molybdate, methanol undergoes a partial oxidation reaction, forming formaldehyde and water.| CH3OH + ½O2 → HCHO + H2O | (1) |
The industrial iron molybdate catalysts are Mo–Fe–O mixed oxides with an excess of Mo compared to Fe2(MoO4)3. Whereas stoichiometric ferric molybdate has a Mo/Fe ratio of 1.5, in the catalyst the ratio is typically 2 or higher. This excess of Mo is needed to maintain the active phase due to Mo loss occurring at hot spots during the industrial process which can result in a reduction of the lifetime of the catalyst to around twelve months. In contrast, an excess of iron in the molybdate catalyst results in deeper oxidation.1–4
The nature of the active site in the catalyst is a subject of debate and there are two schools of thought regarding the origin of catalytic activity. The first is that it is due only to the stoichiometric Fe2(MoO4)3 phase, the other is that the mixed oxides phase with an excess of Mo is responsible. Clearly then, deducing the role of molybdenum at the surface of the catalyst and its chemical state is important for gaining a deeper understanding of the system.
Temperature programmed desorption (TPD) studies have been carried out by several authors,5,6 comparing the reactivity of methanol over Fe2O3, MoO3 and the industrial iron molybdate catalyst. Single crystal MoO3 gave more methanol desorption than formaldehyde,5 whereas polycrystalline MoO3 gave more formaldehyde. Reaction with Fe2O3 results in complete combustion to CO2 and H2O, whereas over MoO3, formaldehyde was found to be the only carbon-containing product.6 The industrial catalyst sample also gave rise to formaldehyde uniquely, but was found to be much more active, with conversion beginning at 150 °C compared with 270 °C for MoO3. The combustion observed for reaction over Fe2O3 points towards formate as an intermediate species, whilst for the Mo-containing compounds, the involvement of a methoxy surface intermediate is suggested. The inference here, therefore, is that the surface is dominated by the molybdenum oxide species, which we,7 and subsequently Routray et al.8 have confirmed using low-energy ion scattering (LEIS) and transmission electron microscopy (TEM).
Although a great deal of research has been conducted into iron molybdate catalysts,1 little has been undertaken on the surface science of these compounds. We have reported9 some preliminary work, carried out in collaboration with Freund's group at the Fritz Haber Institute in Berlin, in which Mo layers were deposited on thin films of single crystalline Fe3O4(111) grown on a Pt(111) single crystal. The main conclusion was that ordered mixed structures were formed after annealing above 900 K, in which the Mo and Fe cations are mixed. We present here results detailing the deposition of molybdenum oxide films on a bulk iron oxide single crystal surface for use as a model catalyst in the investigation of iron molybdate catalysis, with the aim of identifying the nature of, and formation of the active phase and, ultimately, of the active site for selective methanol oxidation.
Experimental
All experiments were performed in a UHV system built by Omicron Vacuum Physik capable of performing scanning tunnelling microscopy (STM), X-ray photoelectron spectroscopy (XPS), low energy ion scattering (LEIS/ISS) and low energy electron diffraction (LEED). The system comprises three separate chambers pumped by a combination of four turbomolecular pumps, three titanium sublimation pumps and three ion pumps, resulting in a base pressure of <1 × 10⁻⁹ mbar.The Fe3O4 sample was cleaned by Ar+ bombardment at 1 keV, followed by annealing in 1 × 10⁻⁷ mbar oxygen, typically at 873 K, although temperatures in the range 673–973 K were used for certain experiments. Surface cleanliness was monitored by XPS and ISS, and gas purity analysed using a quadrupole mass spectrometer. All gas exposures are quoted in Langmuirs (1 L = 10−6 torr s). XP spectra were recorded using an Al Kα photon source and an analyser pass energy of 50 eV unless stated otherwise. Binding energies were calibrated to the O(1s) peak at 530.2 eV. Ar+ bombardment of the Ag(111) sample was carried out at ambient temperature at 600 eV and the sample subsequently annealed at 723 K for 30 minutes. XP spectra were calibrated to the Ag(3d5/2) peak at 368.1 eV.10
The iron oxide sample used was an Fe3O4(111) single crystal (Pi-Kem Ltd). The sample was mounted on a standard Omicron molybdenum plate via spot-welded Ta strips. A thermocouple was attached to the sample plate holder for temperature measurement. All STM images were analysed using WSxM software.11
Molybdenum oxide films were grown by a hot filament metal oxide deposition (HFMOD) technique.12,13 A current, typically 3.2 A, was passed through a coil of 0.25 mm Mo wire (Goodfellow, 99.95%) in an oxygen environment, with a typical pressure of 4 × 10⁻⁶ mbar. The molybdenum oxide films were then annealed at 873 K in oxygen (1 × 10⁻⁷ mbar), see discussion below, and the surface composition analysed by XPS and/or ISS. For small MoOx coverages corresponding to less than a monolayer, surface concentrations were calculated from the area of the Mo(3d) photoelectron peaks using the methods described in detail elsewhere.14,15 For higher coverages the thickness of the MoOx films were calculated from the attenuation of the Fe(2p) peaks. A plot of film thickness against deposition time indicates uniform film growth, Fig. 1.
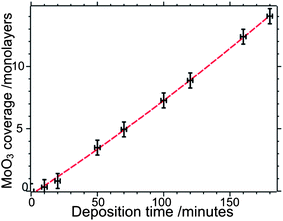 | ||
| Fig. 1 MoOx film thickness as a function of the deposition time, determined from the Mo(3d) XPS signal. Filament current: 3.8 A; oxygen pressure: 8.0 × 10⁻⁶ mbar. | ||
Results
1. Clean Fe3O4 surfaces
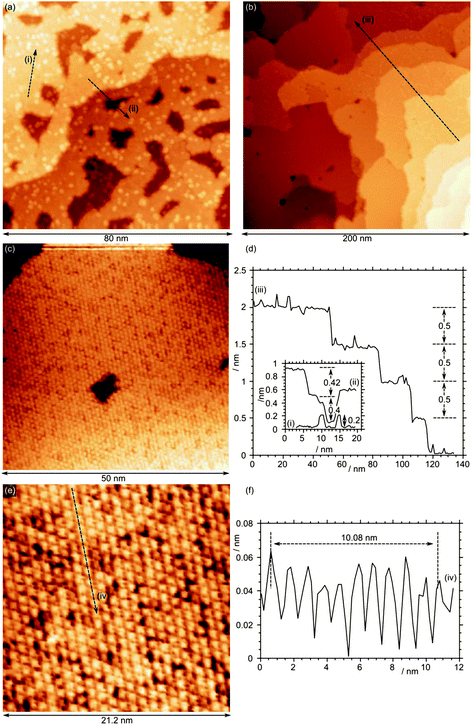
STM images of the clean Fe3O4(111) surface at relatively low magnification (Fig. 2a) show terraces tens of nm in width separated by steps of ∼0.5 nm height (Fig. 2e), consistent with the expected height of the repeat unit for Fe3O4 in the [111] direction.16,17 However, even at this low resolution it is clear that there is further structure within the terraces and a closer examination reveals a mixture of surfaces. Most of the surface (Fig. 2b and c) is covered in a hexagonal structure with an inter-atomic distance of ∼0.62 nm consistent with the p(2 × 2) LED patterns observed previously for the (111) surfaces of Fe3O4 thin films.18,19 More recent work20 has demonstrated that the topography of the magnetite surface can be sensitive to the preparation conditions, particularly the final annealing step. Our conditions and STM images are similar to those reported by Lennie et al.,21 who refer to the hexagonal surface structure as “Termination A” and assign it to a layer of oxygen capping an octahedral iron layer. The same surface was observed by Flynn et al.,22 who, on the basis of scanning tunnelling spectroscopy data and subsequent chemical reactions, assigned it to an Fe3O4(111) surface terminated with Fe2+/3+ ions in tetrahedral sites (“Fetet1”). In our case the “Termination A” surface is accompanied by areas that are not atomically resolved, with a step height between the two layers of 0.12 ± 0.03 nm (Fig. 2f, profile (iii)), the wide range in values being due to unresolved structure within the second surface termination. This differs significantly from the 0.38 and 0.05 nm step heights reported by Lennie et al. for what they term “Termination B” which they assigned to an “Fetet2–Feoct–Fetet1” layer. However, our results are more consistent with this model than with that of Flynn's; the removal of the capping oxygen from the Feoct1 layer in Lennie's model would give a step down to the iron layer of ∼0.11 nm with the additional unresolved structure in the lower layer being accounted for by the presence of defects necessary to stabilize the excess positive charge. In Flynn's model however, the expected step heights from the tetrahedrally coordinated iron layer would be 0.06 or 0.18 nm. LEED patterns of the clean surface (Fig. 3), show only a p(2 × 2) structure consistent with the dominant Termination A.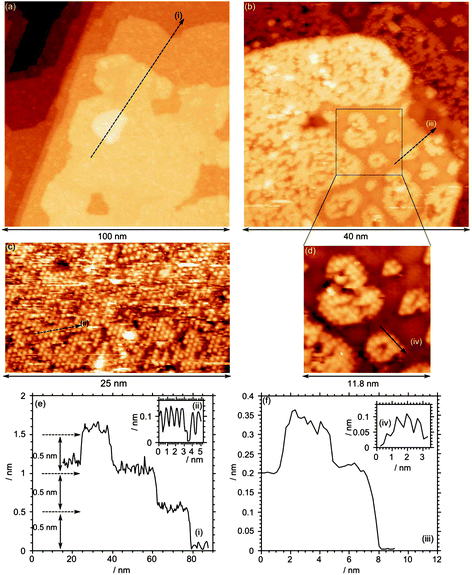 | ||
| Fig. 2 STM images from the clean Fe3O4(111) surface after sputtering and annealing in 1 × 10⁻⁷ mbar of oxygen at 873 K. (a) Large-scale image in which one can clearly observe individual terraces, separated by single height steps (∼0.5 nm). (b)–(d) Higher magnification views showing the complex nature of the surface. Line profiles are identified with Roman numerals and drawn in (e) and (f). (Vb = −1.0 V, It = 0.465 nA). | ||
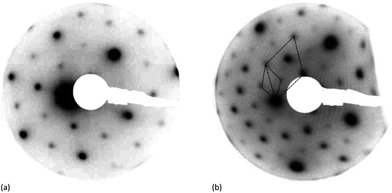 | ||
| Fig. 3 LEED pattern recorded from the Fe3O4(111) single crystal surface. (a) Clean surface at 70 eV after annealing in oxygen pressure of 10−7 mbar for 30 min at 873 K. (b) After deposition of MoOx for 50 min and annealing to 973 K for 30 min in oxygen pressure of 10−7 mbar. | ||
2. Deposition of molybdenum oxide on Ag(111) and Fe3O4 surfaces
Mass spectrometric studies of MoO3 vaporization have shown a mixture of gaseous ions of general formula MonO3n(g) (n = 3, 4, 5) with the most abundant being Mo3O9+, Mo4O12+ and Mo5O15+.23,24 Previous investigations of HFMOD show the deposition of a mixture of MoO3 and MoO2, with exact ratios dependent on conditions.13 To confirm the nature of the deposited films under the present conditions, molybdenum oxide was first deposited on a Ag(111) surface which offers a non-reducible support to the incoming MoOx, and the possibility of oxidation via a surface reaction is unlikely, since the dissociative sticking probability of oxygen at this surface is extremely low. XP spectra of the resulting films show a single peak in the O(1s) region at 530.5 eV which was invariant with coverage (not shown) and the expected doublet in the Mo(3d) region with a Mo(3d5/2) binding energy of 231.3 eV, Fig. 4a. The latter was also unchanged with coverage and is at a binding energy that has been assigned previously to Mo5+ but probably consists in the present case of a mixture of oxidation states from Mo6+ to Mo4+.25 In contrast, the initial deposition of molybdenum oxide on the magnetite surface, Fig. 4b, results in an Mo(3d5/2) binding energy of 232.4 eV characteristic of Mo6+. This remained constant for coverages up to ∼3 monolayers but then decreased with further exposure reaching a binding energy of 231.3 eV after the deposition of 8 or more monolayers of molybdenum oxide (data not shown). The O(1s) peak was unchanged from the clean surface binding energy of 530.2 eV, though the peak broadened slightly at the highest coverages of molybdenum. Annealing of the molybdenum oxide covered surfaces in the presence of oxygen (10−7 mbar, 30 min) at temperatures of up to 973 K did not lead to a decrease in the overall intensity of the molybdenum peaks but even at 473 K resulted in a shift in binding energy to 232.2 eV. The clear implication of these data is that the initial deposition of molybdenum oxide involves a mixture of oxidation states which are converted upon adsorption at the iron oxide surface to become fully oxidized. However, there is no corresponding shift in the Fe(2p) spectra to indicate any reduction of the Fe3+/2+, either because the changes are too small to be detected or due to the ability of the reduced iron oxide surface to dissociate the oxygen that is available in the gas phase. Once the molybdenum oxide layer thickness exceeds ∼3 monolayers this oxidation pathway for the molybdenum oxide is closed off, and reduced Mo states begin to appear at the surface. To ensure that the surfaces are fully oxidized the MoOx/Fe3O4 surfaces were annealed at 873 K for 30 min in 1 × 10⁻⁶ mbar O2. Three concentrations of molybdenum oxide were studied in detail and are reported below: 3.7 × 10¹⁴, 4.5 × 10¹⁴ and 6.2 × 1014 cm−2, (expressed as the surface concentration of molybdenum), Fig. 4b. The unreconstructed oxygen-terminated (111) surface of magnetite has an oxygen surface density of 1.31 × 1015 cm−2.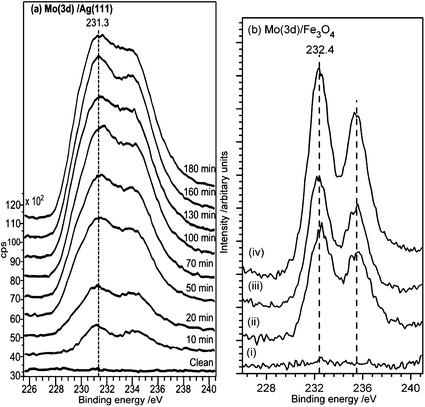 | ||
| Fig. 4 XP spectra showing the Mo(3d5/2) and Mo(3d3/2) peaks after increasing exposures to MoOx. The Mo(3d5/2) peak binding energy of 232.4 eV is characteristic of a Mo6+ species. The surface concentration of Mo is calculated from the XP peak area using methods described previously.14,15 (a) MoOx deposition on Ag(111). (b) MoOx deposition on clean Fe3O4(111), (i) clean surface; (ii) σMo = 3.7 × 1014 cm−2, (iii) σMo = 4.5 × 1014 cm−2, (iv) σMo = 6.2 × 1014 cm−2. | ||
LEED patterns recorded from the magnetite surface after deposition of the molybdenum oxide showed no extra features, only an increase in the background intensity. Annealing in oxygen at 10−7 mbar for 30 min at temperatures up to ∼873 K led to much sharper LEED patterns but no additional features were present. However, a new LEED structure was observed for higher coverages of molybdenum (>1 × 1015 cm−2) annealed to 973 K, Fig. 3b. A  pattern (with reference to the hexagonal close packed oxygen) was observed. This corresponds to a (
 )R30° structure with a unit cell dimension of 1.02 nm.
After annealing in oxygen at 873 K, the STM images of the lowest concentration of MoOx studied (3.7 × 1014 cm−2 ) show a surface dominated by Termination A, Fig. 5. The adsorbed molybdenum oxide appears as bright, approximately circular features scattered across the surface; there are some individual such units, but the majority of them are in the form of islands. The features have a very regular diameter of approximately 1 nm and an apparent height of approximately 0.25 nm. For many of the features a “hollow” is present in the centre (see for example Fig. 5d, profile (iv)). There is clear evidence of order within the molybdenum oxide islands, with regular spacing between features of ∼1.2 nm, double that of the underlying substrate. By extrapolating the substrate lattice over the island and the individual features, it is apparent that the molybdenum oxide sits directly on top of one of the bright features from the substrate. The ordered areas are comprised of a p(2 × 2) structure with regards to the underlying Fe layer, which would therefore correspond to a p(4 × 4) structure with regards to the oxygen layer. We were unable to obtain confirmation of this structure from LEED, possibly because of the small domain size.
 | ||
| Fig. 5 STM image after exposure of a clean Fe3O4(111) single crystal surface to molybdenum oxide followed by annealing in oxygen at 10−7 mbar. Total Mo concentration calculated from Mo(3d) XP spectra = 3.7 × 1014 cm−2. Profile (i) shows the 0.6 nm periodicity of the underlying surface; profiles (ii) and (iii) show the 0.15 nm height of the adsorbed features and the 1.2 nm periodicity of the islands. (Vb = −1.0 V, It = 0.465 nA). | ||
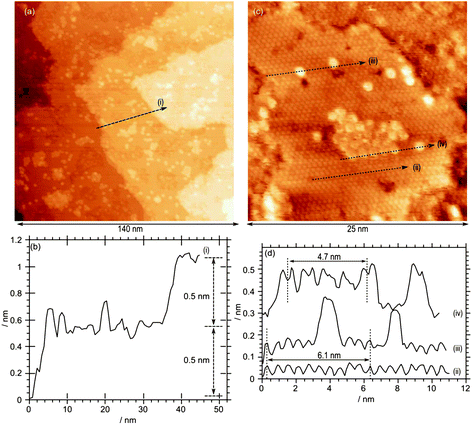
At the higher molybdenum surface concentration of 4.5 × 1014 cm−2, extended rounded islands are evident covering approximately 1/3 of the surface (Fig. 6a). There are steps of ∼0.5 nm between terraces, together with islands within the terraces with heights of approximately 0.3 nm. Higher magnification images, Fig. 6b, show that other areas of the image retain the (2 × 2) structure seen at the clean surface (e.g. profile (ii)), albeit with a large number of scattered bright features that correspond well to molybdenum oxide groups. In addition, the raised areas exhibit a large hexagonal lattice unit cell with a periodicity of 1.2 nm (Fig. 6, inset c) corresponding to the (4 × 4) structure characteristic of the molybdenum oxide islands seen at lower coverage. A small number of brighter areas are also present at this concentration. These appear to be approximately 0.15 nm above the (4 × 4) structures and constitute a second layer. Interestingly, these do not exhibit the (4 × 4) structure but instead show features with a 0.6 nm periodicity, suggesting a return to the (2 × 2) structure. The second layer areas also show individual bright features that are poorly resolved but similar to the individual molybdenum oxide groups observed at lower terraces.
 | ||
| Fig. 6 STM image after exposure of a clean Fe3O4(111) single crystal surface to molybdenum oxide followed by annealing in oxygen at 10−7 mbar. Total Mo concentration calculated from Mo(3d) XP spectra = 4.5 × 1014 cm−2. Profile (i) shows the typical 0.3 nm step height; profiles (ii) and (iii) show the 0.6 nm and 0.12 nm periodicity of the underlying structures. (Vb = +2.5 V, It = 0.525 nA). | ||
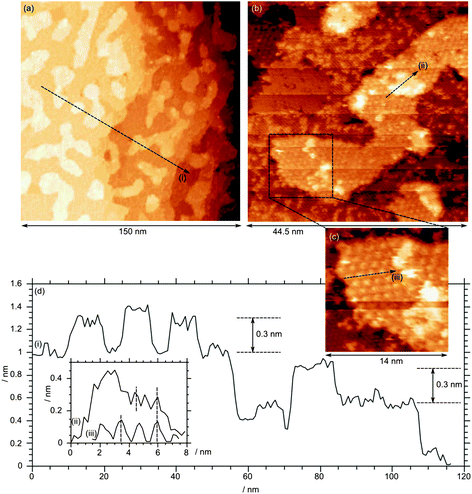
Further exposure of the surface to molybdenum oxide increases the molybdenum surface concentration to 6.2 × 1014 cm−2. STM images show that the large islands have propagated across the surface, and now cover the majority of the surface, Fig. 7a. Step heights between terraces are approximately 0.4 nm, with individual features on top of the terraces with heights of approximately 0.2 nm. High resolution images of the molybdenum area show an underlying structure with a 0.6 nm periodicity. Fig. 7a shows the surface after annealing to 873 K, Fig. 7b and c show the surface after further annealing to 973 K in an oxygen pressure of 10−7 mbar. The STM images reveal a smoother surface with terraces separated by 0.5 nm steps but still with scattered features on some terraces. A close up of the terraces, Fig. 7e, reveals a well ordered structure with a periodicity of 1.03 ± 0.02 nm rather than the previous 1.2 nm spacing, correlating well with the unit cell determined by LEED.
 | ||
| Fig. 7 STM images of Fe3O4(111) with a total Mo concentration calculated from Mo(3d) XP spectra of 6.2 × 1014 cm−2. (a) and (b) STM of MoOx overlayer after annealing in oxygen at 873 K. (c) and (d) After further annealing at 973 K. Profile (i) shows the typical 0.3 nm step height; profiles (ii) and (iii) show the 0.6 nm and 0.12 nm periodicity of the underlying structures. (Vb = +2.5 V, It = 0.525 nA). | ||
Fig. 8 shows Low Energy Ion Scattering spectra and the corresponding XP spectra of the clean iron oxide surface, the surface after exposure to molybdenum oxide and then after annealing the resulting surface to 873 K in an oxygen atmosphere of 1 × 10⁻⁶ mbar. The surface molybdenum concentration is 6.2 × 1014 cm−2, comparable to that of the third exposure studied by STM. After MoOx deposition, the Fe peak is no longer observed, being replaced by a Mo peak; the oxygen signal also increases. Upon heating, the Fe peak reappears at temperatures of 593 K and above, becoming larger than the Mo peak by 673 K, but not reaching the level of the clean surface, and showing a lower Fe![[thin space (1/6-em)]](https://www.rsc.org/images/entities/char_2009.gif) :O ratio. Since the XPS shows no desorption of the MoOx this indicates that there is diffusion of the iron into the molybdenum oxide layer. The peak that develops at 680 eV is due to potassium, an occasional contaminant in the vacuum system at high annealing temperatures.
:O ratio. Since the XPS shows no desorption of the MoOx this indicates that there is diffusion of the iron into the molybdenum oxide layer. The peak that develops at 680 eV is due to potassium, an occasional contaminant in the vacuum system at high annealing temperatures.
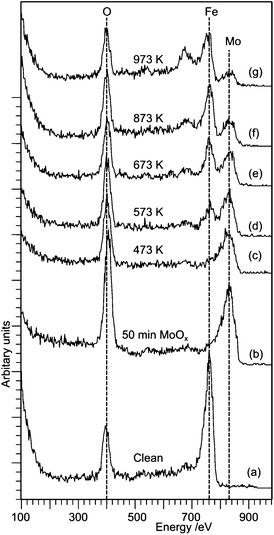 | ||
| Fig. 8 LEIS spectra of an iron oxide surface exposed to the MoOx flux from a hot Mo filament and after subsequent annealing: (a) clean, (b) following Mo exposure, and after annealing at (c) 473 K, (d) 573 K, (e) 673 K, (f) 873 K, (g) 973 K. | ||
Discussion
The XPS results from the silver surface indicate that the deposition of the molybdenum initially involves a mixture of molybdenum oxidation states, but on magnetite these are oxidized on adsorption to Mo6+. Although higher coverages on the magnetite begin to show reduced molybdenum states, these are fully oxidized by annealing in oxygen. In all our experiments therefore we believe we have studied a MoO3-like state. At low coverages these are manifested in the STM as 0.15 nm high features located on the sites previously assigned by Lennie et al. to capping oxygen on Termination A. The molybdenum features have diameters of ∼1.0 nm and there is evidence for a depression in the centre (Fig. 5c and d, profile (iv)) but we were unable to obtain high resolution images of them. To account for this large size we propose that each feature is an Mo3O9 trimer – these are known to be a constituent of the gas phase evaporation of molybdenum oxides;23 analogous W3O9 trimers have previously been reported26 on TiO2 surfaces and imaged by STM. The adsorption site for the trimers was shown by STM to be on top of the bright features assigned by Lennie et al. to “capping” oxygen adatoms. The model proposed in Fig. 9 details how the size of Mo3O927 would steer it towards the formation of a (4 × 4) structured adlayer. A more densely packed structure would appear to be unlikely. At higher molybdenum oxide coverages, the majority of the surface is covered in a second layer, which appears to have returned to the (2 × 2) structure of the clean surface. The LEIS scattering reveals that following annealing above 473 K, Fe is present in the topmost surface layer. This corresponds to the temperature range in which the conversion and formaldehyde selectivity are at their highest when methanol is reacted over the mixed iron molybdate catalyst and in future work we will explore the reactivity of methanol with these surfaces. We know that from earlier work on powdered catalysts28 that as the bulk loading of Mo increases, so the selectivity to CO2 (typical of iron oxide) diminishes very rapidly to be largely replaced by CO production, with formaldehyde beginning to dominate at bulk Mo:Fe ratios as low as 0.2. It will be important to assess how the single crystal materials behave in relation to bulk catalyst behavior, and to relate this to surface structure. These results show that molybdenum stays in the surface region of the crystal. This agrees with earlier work on powdered catalysts systems, where it was shown by TPD measurements2 and by LEIS and TEM3 that the surface is enriched in Mo. We have also recently shown,29 in a closer analogy to the present paper, that when Mo is chemically dosed onto either an Fe2O3 or Fe3O4 powder, it stays in the surface region. For all these materials, the presence of molybdenum in the surface layer is crucial to produce high selectivity to formaldehyde, since iron oxide alone is a combustor.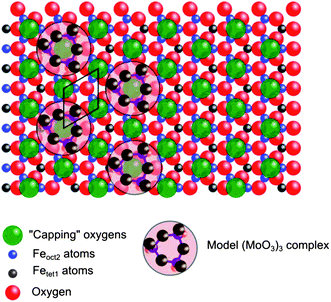 | ||
| Fig. 9 Schematic model of the cyclic (MoO3)3 trimers adsorbed on the A Termination21 of an Fe3O4(111) surface. The (MoO3)3 clusters are shown having the plane of the rings located on top of the capping oxygens. The hexagonal surface unit cell of Fe3O4(111) is indicated. The van der Waals contour of the (MoO3)3 clusters is based on dimensions calculated by Jang and Goddard.27 | ||
Acknowledgements
Dr David Willock is thanked for helpful discussions regarding the magnetite crystal structure. RJD is grateful to the University of Wales for a studentship partly funded by the Sir Charles Wright Endowment fund and CB was funded by the Thai government. DE was supported by grant number EP/E03974X/1 from the EPSRC in the UK, for which we are grateful.References
- A. P. V. Soares, M. F. Portela and A. Kiennemann, Catal. Rev. Sci. Eng., 2005, 47, 125–174 CAS.
- A. Andersson, M. Hernelind and O. Augustsson, Catal. Today, 2006, 112, 40–44 CrossRef CAS.
- A. P. V. Soares, M. F. Portela, A. Kiennemann and L. Hilaire, Chem. Eng. Sci., 2003, 58, 1315–1322 CrossRef.
- E. Söderhjelm, M. P. House, N. Cruise, J. Holmberg, M. Bowker, J.-O. Bovin and A. Andersson, Top. Catal., 2008, 50, 145–155 CrossRef.
- W. E. Farneth, F. Ohuchi, R. H. Staley, U. Chowdhry and A. W. Sleight, J. Phys. Chem., 1985, 89, 2493–2497 CrossRef CAS.
- M. Bowker, R. Holroyd, A. Elliott, P. Morrall, A. Alouche, C. Entwistle and A. Toerncrona, Catal. Lett., 2002, 83, 165–176 CrossRef CAS.
- M. House, M. Shannon and M. Bowker, Catal. Lett., 2008, 122, 210–213 CrossRef CAS.
- K. Routray, W. Zhou, C. J. Kiely, W. Grünert and I. E. Wachs, J. Catal., 2010, 275, 84–98 CrossRef CAS.
- J. J. Uhlrich, J. Sainio, Y. Lei, D. Edwards, R. Davies, M. Bowker, S. Shaikhutdinov and H.-J. Freund, Surf. Sci., 2011, 605, 1550–1555 CrossRef CAS.
- V. Kaushik, J. Electron Spectrosc. Relat. Phenom., 1991, 56, 273–277 CrossRef CAS.
- I. Horcas, R. Fernandez, J. Gomez-Rodriguez, J. Colchero, J. Gomez-Herrero and A. Baro, Rev. Sci. Instrum., 2007, 78, 013705 CrossRef CAS.
- M. A. Bica de Moraes, B. C. Trasferetti, F. P. Rouxinol, R. Landers, S. F. Durrant, J. Scarmínio and A. Urbano, Chem. Mater., 2004, 16, 513–520 CrossRef CAS.
- S. F. Durrant, B. C. Trasferetti, J. Scarmínio, C. U. Davanzo, F. P. M. Rouxinol, R. V. Gelamo and M. A. Bica de Moraes, Thin Solid Films, 2008, 516, 789–793 CrossRef CAS.
- A. F. Carley and M. W. Roberts, Proc. R. Soc. London, Ser. A, 1978, 363, 403–424 CrossRef CAS.
- A. F. Carley, P. R. Davies, R. V. Jones, K. R. Harikumar, G. U. Kulkarni and M. W. Roberts, Surf. Sci., 2000, 447, 39–50 CrossRef CAS.
- M. E. Fleet, Acta. Cryst. B., 1981, 37, 917–920 CrossRef.
- B. Wechsler, D. Lindsley and C. Prewitt, Am. Miner., 1984, 69, 754–770 CAS.
- A. Barbieri, W. Weiss, M. A. Van Hove and G. A. Somorjai, Surf. Sci., 1994, 302, 259–279 CrossRef CAS.
- M. Ritter and W. Weiss, Surf. Sci., 1999, 432, 81–94 CrossRef CAS.
- A. Sala, H. Marchetto, Z.-H. Qin, S. Shaikhutdinov, T. Schmidt and H.-J. Freund, Phys. Rev. B, 2012, 86, 155430 CrossRef.
- A. R. Lennie, N. G. Condon, F. M. Leibsle, P. W. Murray, G. Thornton and D. J. Vaughan, Phys. Rev. B, 1996, 53, 10244–10253 CrossRef CAS.
- K. T. Rim, J. P. Fitts, T. Müller, K. Adib, N. Camillone III, R. M. Osgood, S. Joyce and G. W. Flynn, Surf. Sci., 2003, 541, 59–75 CrossRef CAS.
- E. F. Fialko, A. V. Kikhtenko, V. B. Goncharov and K. I. Zamaraev, J. Phys. Chem. A, 1997, 101, 8607–8613 CrossRef CAS.
- J. Berkowitz, M. G. Inghram and W. A. Chupka, J. Chem. Phys., 1957, 26, 842–846 CrossRef CAS.
- J.-G. Choi and L. T. Thompson, Appl. Surf. Sci., 1996, 93, 143–149 CrossRef CAS.
- O. Bondarchuk, X. Huang, J. Kim, B. D. Kay, L.-S. Wang, J. M. White and Z. Dohnálek, Angew. Chem., Int. Ed., 2006, 45, 4786–4789 CrossRef CAS.
- Y. H. Jang and W. A. Goddard, J. Phys. Chem. B, 2002, 106, 5997–6013 CrossRef CAS.
- M. P. House, A. F. Carley, R. Echeverria-Valda and M. Bowker, J. Phys. Chem. C, 2008, 112, 4333–4341 CAS.
- M. Bowker, C. Brookes, A. F. Carley, M. P. House, M. Kosif, G. Sankar, I. Wawata, P. P. Wells and P. Yaseneva, Phys. Chem. Chem. Phys., 2013 10.1039/c3cp50399b.
Footnote |
| † and at Centre for Catalytic Science, Research Complex at Harwell (RCaH), Rutherford Appleton Laboratory, Harwell, Oxon, OX11 0QX, UK |
| This journal is © The Royal Society of Chemistry 2013 |