 Open Access Article
Assessing the drivers of regional trends in solar photovoltaic manufacturing†
Alan C. Goodrich*a,
Douglas M. Powell*b,
Ted L. Jamesa,
Michael Woodhousea and
Tonio Buonassisi*b
aStrategic Energy Analysis Center, National Renewable Energy Laboratory, 15013 Denver West Parkway, Golden, CO 80401, USA. E-mail: alan.goodrich@nrel.gov; Tel: +1 303-275-4347
bMassachusetts Institute of Technology, 77 Massachusetts Ave, Cambridge, MA 02139, USA. E-mail: dmpowell@alum.mit.edu; Tel: +1 617-253-3308buonassisi@mit.edu; Tel: +1 617-324-5130
First published on 5th September 2013
Abstract
The photovoltaic (PV) industry has grown rapidly as a source of energy and economic activity. Since 2008, the average manufacturer-sale price of PV modules has declined by over a factor of two, coinciding with a significant increase in the scale of manufacturing in China. Using a bottom-up model for wafer-based silicon PV, we examine both historical and future factory-location decisions from the perspective of a multinational corporation. Our model calculates the cost of PV manufacturing with process step resolution, while considering the impact of corporate financing and operations with a calculation of the minimum selling price that provides an adequate rate of return. We quantify the conditions of China's historical PV price advantage, examine if these conditions can be reproduced elsewhere, and evaluate the role of innovative technology in altering regional competitive advantage. We find that the historical price advantage of a China-based factory relative to a U.S.-based factory is not driven by country-specific advantages, but instead by scale and supply-chain development. Looking forward, we calculate that technology innovations may result in effectively equivalent minimum sustainable manufacturing prices for the two locations. In this long-run scenario, the relative share of module shipping costs, as well as other factors, may promote regionalization of module-manufacturing operations to cost-effectively address local market demand. Our findings highlight the role of innovation, importance of manufacturing scale, and opportunity for global collaboration to increase the installed capacity of PV worldwide.
Broader contextNational energy strategies are often driven by stakeholder perspectives on energy security, environmental priorities, and economic benefits. Since the global economic slowdown of 2008, economic benefits have been an increasingly important factor influencing national policies, especially for renewable energy technologies such as solar photovoltaics (PV) that have demonstrated strong commercial growth and hold promise for substantial market opportunities. Using an industry validated bottom-up cost model, we identify the economic factors for recent changes in solar PV supply chains – the rising prominence of China, surpassing industry growth rates in all other regions. We find that the current advantage of a Chinese PV module factory is not related to factors intrinsic to China; but rather, it is built from economies-of-scale and related supply-chain advantages, which we argue, could be equalized. We also find that further innovations and supply-chain developments could significantly reduce the cost of solar energy, resulting in more widespread PV deployment and global opportunities in manufacturing. These findings are of broad importance to policy-makers and other industry stakeholders, as they provide quantitative evidence for regions to pursue collaborations that leverage one another's asymmetric strengths for mutual benefits. |
Introduction
The photovoltaic (PV) industry continued growing rapidly during the recent economic downturn.1 Over the past decade, the compound annual growth rate (CAGR) of the entire sector was 52% (Fig. 1). Sustained module price reductions have coincided with this trend (Fig. 1).‡ Over the same period, Chinese module shipments had a CAGR of 123% (Fig. 1). Deployment and manufacturing trends have differed. In 2011, 70% of the world's PV modules were installed in Europe (which originated only 7% of global shipments), 9% in China (63% of shipments), and 6% in the United States (3% of shipments).1,2,6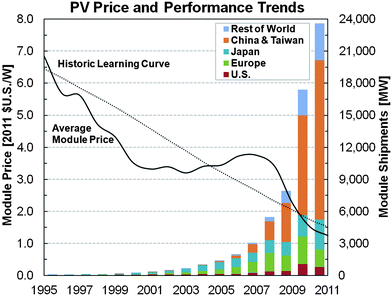 | ||
| Fig. 1 From 2008 to 2011, reductions in the average global prices of c-Si PV modules have been in line with experience, but the rise of module manufacturing in China and Taiwan has been striking.6 | ||
Still, PV contributes little to global energy generation and has harnessed a fraction of its vast potential. PV deployment could be accelerated by further reducing module and system prices, and grid-integration bottlenecks.3–5 With innovations in these areas, the volume of modules manufactured in the coming decades could eclipse the number produced to date. Thus, we emphasize that a long-term perspective, rather than spot-market price data, is necessary to benchmark PV technologies.
Factory-siting decisions in a global industry
Today's PV industry and supply chains are global. Manufacturers may be headquartered in one country but operate in many others. Of firms with U.S. operations or headquarters, more than 90% of manufacturing capacity resides outside the U.S., i.e. these companies may be characterized as global.7 However, of PV companies operating or headquartered in China, more than 99% of manufacturing capacity is domestic; such firms are therefore best characterized as Chinese companies.2,7In this study, we adopt the perspective of a multinational firm evaluating locations in the U.S. or China for a PV manufacturing facility.§ The analysis does not characterize a specific manufacturer, but rather uses reasonable national values for inputs. We acknowledge the variability of intra-country parameters, and use them to inform our uncertainty analysis (S1, Tables 11 and 12†). We analyse wafer-based crystalline silicon (c-Si), which currently holds a dominant and growing market share of over 85% in the PV industry.6,7
We posit that manufacturers of c-Si PV products may seek differentiation based on price, performance, and reliability, and that price is the current key competitive differentiator between U.S. and China located manufacturers.8 We assume equivalent technology levels and conversion efficiencies for standard technology products originating in both the U.S. and China, and posit that technology diffusion has historically occurred via equipment vendors and learning (R&D) networks with global reach.9,10,¶ These links enable manufacturers, regardless of location, to have strong ties to leading research institutions, license key technologies, purchase state-of-the-art equipment and processes, and acquire technology firms.
Factories in the U.S. and China have access to the same manufacturing technology. Consequently, most factories are considered to provide globally competitive product quality, although “problems of uneven product quality” have been reported for some manufacturers.11 Furthermore, although some manufacturers may differentiate products based on performance, reliability, and appearance, the vast majority of manufacturers produce “off-the-shelf” technology.9
MSP elucidates factory-location decisions and future trends
Following our conclusion that price is currently the key competitive differentiator between U.S. and Chinese manufacturing locations, we use Minimum Sustainable Price (MSP) to predict factory location decisions. MSP estimates the long-term market-clearing price12 for the product assuming competitive equilibrium, or—the minimum price of modules that will provide an adequate rate of return for a company.13,14 To calculate MSP, we begin with a bottom-up cost model developed and refined in consultation with industry13–16 (S1, Methods; S3, Validation Table†) for each manufacturing step. With acknowledgement of the time sensitive results contained in this analysis, we note that our historic analysis depicts first half 2012 (1H 2012) input values and results. This snapshot in time of rapidly changing metrics (i.e. manufacturing costs and prices), offer insights into the factors that have led to the regionalization of manufacturing described above (see Fig. 1).MSP is calculated within our models using generally accepted discounted free cash flow methods and is the price that provides an internal rate of return equal to the firm's weighted average cost of capital (WACC)12–14,16,17 (S1, Methods†). To validate these models, we provide a side-by-side comparison of the model results (inputs adjusted to represent Q4 2012) to the costs and prices reported by a leading c-Si manufacturer for fiduciary purposes (S3, Validation†). If a company does not provide a return commensurate with perceived risk, the company risks damaging its valuation and could incur ever-higher equity costs, potentially limiting growth.18
We analyse MSP in two stages: first, we examine factors that have contributed to historical regional differences in MSP between U.S. and Chinese factories, distinguishing between indigenous factors and those that can be reproduced elsewhere. We note that Chinese wages are no longer the world's lowest, suggesting that the additional factors investigated in this analysis may drive regional MSP differences.19–22 This “baseline scenario” considers today's standard c-Si technology and analyses factors driving China's recent rise in PV manufacturing (Fig. 1). Next, we consider the effects that technology, scale, and supply-chain development can have in shaping future factory-location decisions by evaluating MSP for U.S. and Chinese factories under an “advanced technology” scenario.13,16
Dissecting China's c-Si PV manufacturing-price advantage over the U.S.
This historical (first-half 2012; 1H 2012) analysis of regional trends assumes a Czochralski grown single-crystalline p-type cell, resulting in a 14.9% efficient PV module.13,16 We estimate the U.S. cost of manufacturing c-Si wafers, cells, and modules to be $0.98 per W and the cost of capital to be 9%, resulting in an MSP of $1.19 per W (Fig. 2; S1, Methods; S2, ESI Table†). The cost of manufacturing the same product in China is estimated to be $0.74 per W and the cost of capital 12%, resulting in an MSP of $0.91 per W. Excluding module shipping, this MSP advantage (23%) is driven by differences in the costs of manufacturing modules (44% of the advantage), wafers (36%), and cells (20%). We identify nine causes of the MSP differences in three categories (Fig. 2).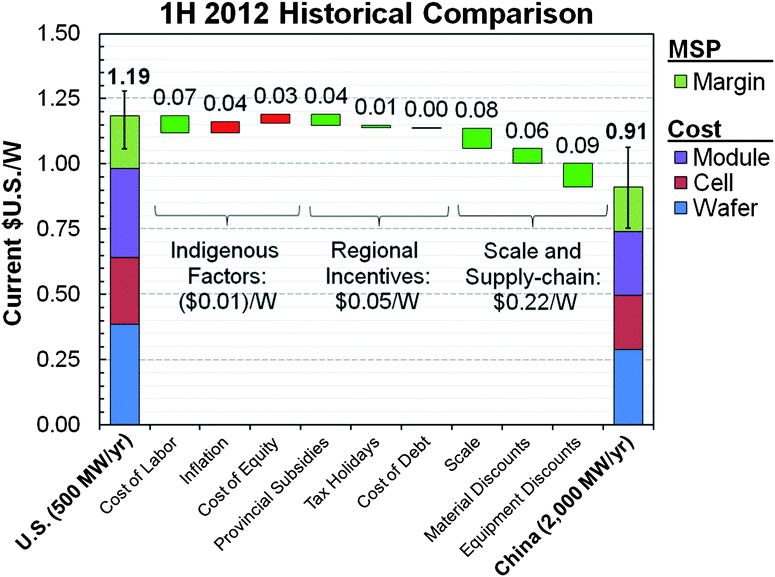 | ||
| Fig. 2 The 1H 2012 PV module MSP advantage of a 2-GW per year Chinese PV factory (23%) over a 500-MW U.S. factory cannot be explained by indigenous factors such as low labour costs. | ||
Indigenous factors
We posit that labour rates, inflation, and a company's cost of equity are coupled to manufacturing location.For industries like PV, where technology externalities and regulatory uncertainty contribute to demand-side risk, there is a high market risk to investors, which may discourage manufacturers from locating in emerging markets that command a country-risk premium.** In fact, few foreign PV manufacturers have located in China during the past decade. Most leading PV manufacturers with operations in China are domestic, having less than 1% of manufacturing capacity outside China.7
The Chinese factory's country-risk penalty could be offset by other regional factors, like supply-chain advantages that enhance a firm's probability of achieving expected cash flows. However, we exclude such adjustments, relying instead on an industry-preferred modified discount rate approach.37,38
Regional incentives
We posit that the effect of direct government support on regional MSP could be replicated globally.72,40As with cost of equity, our U.S. and China cost of debt estimates are based on historical market data. From January 2008 to February 2012, the average real cost of debt†† for a sample of fifteen deals (totalling more than $3.3 billion) to ten domestic PV manufacturers in China was −0.12% (ref. 44) (S1, Fig. 6†).‡‡ During this same period, the average real cost of debt for a sample of five deals (totalling more than $1.4 billion) made to three U.S.-based PV firms was 1.7% (ref. 44) (S1, Fig. 6†). Though this sample size is not comprehensive, we assign a lower nominal cost of debt for the Chinese manufacturer (3.1%, −0.1% real rate) than for the U.S. manufacturer (4.6%, 1.7% real rate).
China-headquartered companies also tend to have a higher debt-to-equity ratio relative to global counterparts.45,46 The equity premium (∼2×) we estimate for China-based manufacturers is partially offset by low-cost debt, which reduces the WACC premium to about 50% (S1, Methods, Table 10†). Chinese firms' higher reliance on debt aligns with our expectation of an equity premium and suggests debt may have played a more significant role in financing PV manufacturing growth in China than elsewhere. In China, more than 98% of loans are made by state-owned, state-controlled, or domestic banks.47 Motivations for issuing loans thus could include societal objectives like economic growth, which may provide preferential access to capital for domestic manufacturers.§§
We estimate that relatively low-cost debt provides the Chinese manufacturer with a $0.01 per W (Fig. 2) price advantage over the U.S. manufacturer. We find the incentives provided by states or provinces provide more valuable direct benefits to manufacturers (i.e. lead to a lower MSP result) than low-cost debt and reduced corporate-tax rates. However, we examine secondary benefits of low-cost capital, such as relative scale advantages in the following section.
Scale & supply-chain advantages
We posit that Chinese manufacturers' access to low-cost capital and ability to rapidly scale technology manufacturing output48,49 have contributed to a PV scale advantage and corresponding cost benefits.50Module shipping costs
While wafer and cell shipping costs are small, glass module shipping costs can be large: we estimate shipping costs of $0.035 per W from the U.S. to China and $0.040 per W from China to the U.S. (S1, Tables 1 and 2†). We do not explicitly factor module shipping costs into Fig. 2 because their magnitude has a negligible effect on the MSP disparity. This conclusion aligns with recent history, as more than 90% of Chinese PV production, worth more than $20 billion, was exported in 2010.11 We conclude that the growth of China's c-Si PV manufacturing sector to date is not driven by proximity to a robust Chinese end market.***Summary
We posit that minimum sustainable price (MSP), not performance or reliability, is currently a key competitive differentiator between U.S. and Chinese manufacturing locations, and use it to predict factory location decisions. Our analysis indicates that in 1H 2012, a combination of factors provided a Chinese factory with a 23% module MSP advantage over a U.S. counterpart. China's lower labour costs provide no significant price advantage when the effects of higher inflation and country risk are considered. Most (82%) of this advantage is attributed to scale and supply-chain benefits, rather than direct subsidies (18%). However, access to substantial capital, from debt or equity sources, is required and thus has a large indirect impact on factory-siting decisions and factory scale. These advantages could be reproduced elsewhere. The sum of regional attributes—labor costs, inflation, and cost of equity—provide no net advantage to a U.S. or Chinese factory.Innovation and supply-chain development enable manufacturing scale and price parity
We now examine how future advanced technology (i.e. innovation), scale, and supply-chain development shape factory-location decisions. c-Si PV benefits from known technical and cost-improvement pathways.13,14,16 We consider a high-efficiency (n-type) back-contact cell architecture using low-cost metallization techniques on a thin wafer, resulting in a module efficiency of 22.4%,13,14,16 which reduces MSP by 40–50% while increasing performance about 50% (relative). Although we specify one advanced technology, several future concepts could yield similar MSPs.13,14,16Assuming equal innovation and the persistence of the regional differences in incentives, scale, and supply-chain development specified above, the Chinese factory will maintain a 23% advantage: $0.76 per W vs. $0.58 per W (S1, Methods, Fig. 4†). However, the drastic price reduction will likely increase market demand, altering assumptions regarding regional differences.
Implications of long-term innovation and supply-chain development
Cost-competitive PV electricity, enabled by further innovations, is projected to stabilize U.S. PV module demand at 25–30 GW per year—about 15 times the 2011 U.S. demand.1,5 Thus, the demand for advanced-technology c-Si modules could support factories more than an order of magnitude larger than today's largest producers. By reducing a key market risk (dependence on demand-side subsidies), manufacturers of the innovative technology may access lower-cost financing. These conditions might provide an opportunity to equalize many of the scale-based supply-chain advantages profiled above.If equivalent scale is achieved, we posit that some existing supply-chain advantages could be neutralized. We assume equivalent equipment prices and levels of government support between regions.40,72 We acknowledge that this scenario relies on multiple factors that are indirectly influenced by the reduced cost of the advanced technology, and posited subsequent increase in scale leading to equivalent supply-chain advantages. External influences, such as from governments, however, could prevent the realization of this scenario. We note that in the absence of these assumptions, the current state of MSP differentiation persists in the presence of advanced technology (S1, Fig. 4†).
With these assumptions, the price advantage for Chinese factories decreases to less than 4% (from 23%; Fig. 3), owing mostly to the inherent benefits of low-cost labour in cell and wafer manufacturing. Our estimated shipping costs are greater than this price differential, suggesting that sustainable price-competitive manufacturing could occur near end markets.
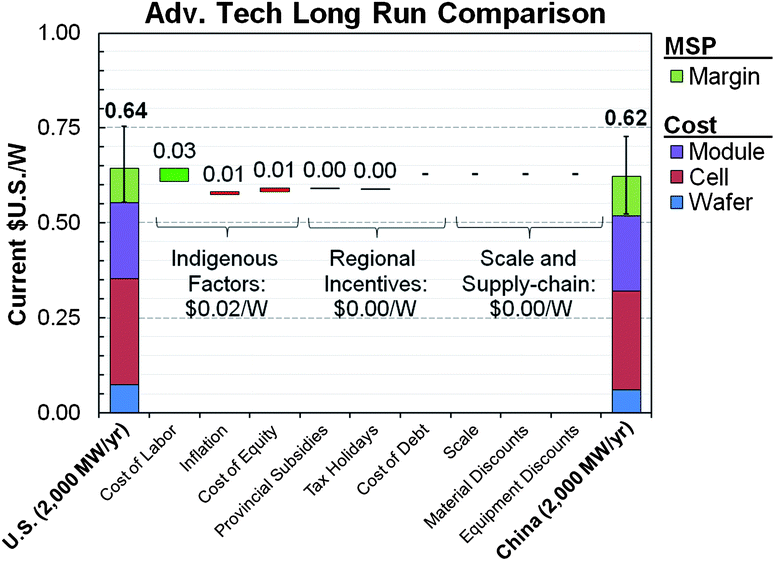 | ||
| Fig. 3 Advanced technologies are expected to reduce the industry's dependence on demand-side subsidies, enabling manufacturers in both regions to reach a more competitive scale through improved access to equity capital, significantly reducing Chinese factories' price advantage (<4%) over U.S. factories. | ||
While we assume U.S. and Chinese manufacturers will have equal access to innovative technologies, these technologies could be commercialized first in either country.52
Broader implications
The following summarizes our quantitative findings:(1) The current advantage of a PV module factory located in China with respect to one located in the U.S. is not related to factors intrinsic to China (i.e., labour, inflation, country-specific risk); it largely results from large scale and supply-chain development. The competitive advantage that has led to the regionalization of the PV industry (Fig. 1) is not inherent; it is built and therefore might be equalized (Fig. 4).
 | ||
| Fig. 4 Innovation and scale can lead to regional PV module manufacturing price parity. | ||
(2) Innovation and supply-chain development could enable manufacturing scale, subsidy-free PV deployment, and regional manufacturing MSP parity. The innovation potential exists within c-Si PV to equalize regional manufacturing MSPs (Fig. 3).
These findings have several broader implications, described briefly in the next sections.
Competitive advantage revisited
Traditionally, off-shoring of manufacturing is thought to be driven by the perceived value of regional siting advantages, e.g., low-cost labour, proximity to end markets, or access to raw materials. We demonstrate a technology for which such inherent factors have been far less important in dictating manufacturing advantages; instead, scale, supply-chain development, and their enablers create regional differences in MSP.Local benefits of PV manufacturing
Full characterization of the local economic value created from each segment of the PV supply chain53 requires further study, e.g., with a cost model.13–16 However, without domestic manufacturing, support for the public financing of innovation could become challenging, given the lack of explicit benefit to taxpayers. Furthermore, the presence of manufacturing may be an important factor in promoting innovation.50Optimizing global PV manufacturing and deployment
For a multinational PV company that establishes a modular, global production strategy to maximize shareholder value, both the U.S. and China have unique advantages in terms of innovation, manufacturing, and deployment—asymmetric opportunities and risks, a condition that could reward collaboration.c-Si PV modules are manufactured modularly via discrete polysilicon, wafer, cell, and module steps, all of which have relied on relatively standard product sizes and processes.††† These factors have facilitated commerce of intermediate products and the geographic diffusion of product and manufacturing-process technologies.9
As c-Si technology advances, domestic-module assembly may be the first component of the value chain to show regional MSP parity (S1, Fig. 5†). Other components (cells, wafers) may also demonstrate MSP parity eventually (S1, Fig. 5†). However, c-Si products are largely differentiated by product and process innovations in the cell. Competitive scale and automation can greatly reduce regional differences in cell-manufacturing costs, but, when shipping to the U.S., MSP is minimized with cell manufacturing in a China-based factory. For today's c-Si wafer, the principal source of regional cost advantage is labour cost. Nevertheless, as conversion efficiencies rise and wafer thickness falls, machine throughputs increase and labour costs per watt decrease. Thus, the labour-based regional wafer-cost advantage is reduced from 21% today to less than 10%. As regional MSP differences are reduced, module manufacturing may shift nearer to key end markets to reduce shipping costs.54
Market-access restrictions could still impact long-run manufacturing opportunities, just as they have influenced siting in the PV industry and other industries such as wind power.55,56 The U.S. and Chinese end markets are projected to be comparable and significant.3,5,57–60 In China, local-content provisions have been used in other energy sectors, like wind,55 but not in PV. However, some PV manufacturers may perceive that imports will not enjoy the same government support as domestic products. Access to the Chinese end market could be restricted unless key technologies are transferred or sold to Chinese-headquartered firms.56 In the U.S., the federal government has adopted local content provisions for some purchases, while some states may also couple installation incentives to manufacturing location.61,62 Thus a global company could benefit from a manufacturing presence in both the U.S. and China.‡‡‡
Qualitative factors may also influence factory siting decisions, such as local innovation networks, an established supply chain,50 the switching cost to adopt new technologies, intellectual property (IP) rights,41,48 regulations, and other country-risk factors (considered in Indigenous Factors). IP protection could be important in achieving the advanced-technology scenario. Some leading PV manufacturers have noted that “intellectual property rights and confidentiality protections in China may not be as effective as in the United States or other countries”.42 Stronger IP protections may make the U.S. an attractive location to commercialize a disruptive c-Si PV technology, while China's track record of rapidly scaling-up new technologies may make it attractive.48
The perceived importance of the qualitative factors may depend on the technology being deployed; e.g., an advanced-technology manufacturer might value IP protection more heavily. Different U.S. and Chinese locales have unique strengths and weaknesses that must be considered with MSP and market-access restrictions. However, depending on the importance of market-access in the future, and regardless of IP or other country-risk factors, manufacturers may have strong incentive to position manufacturing near or in different end markets.
Even considering only quantitative factors, our findings suggest the industry may adopt more regionally diverse production strategies. The analysis (S1, Fig. 5†) suggests regional markets, free of market barriers, could be optimally served by domestic-module assembly and a global supply chain. The trade-off between shipping and regional manufacturing costs will determine the extent to which regional manufacturing must be established to optimally supply end markets. These results are supported by the manufacturing strategies of global PV manufacturers, such as many of those headquartered in the U.S. but producing most products offshore.7,54
The future of global PV manufacturing and innovation
Innovation is necessary for making unsubsidized PV-generated electricity cost competitive, but the scale of state-of-the-art c-Si factories today bars entry for all but the most disruptive technologies. Innovation may be accelerated by combining asymmetric regional strengths. Global PV innovation and manufacturing networks already have emerged. Although evidence suggests this path will lead to regional MSP parity, in the interim complete regional loss of innovation infrastructure or manufacturing should be avoided, as this will likely lead to reduced public support for R&D in those regions, and may slow the pace of innovation globally.While the current PV market oversupply invites pessimism, it is important to keep a long-term view. PV deployment potential is vast.5 If the industry is able to achieve improved levels of cost and performance, such as those outlined by the DOE SunShot Initiative, then future PV factories likely will eclipse even the largest factories today.5 A PV technology that is broadly cost effective without subsidies has yet to be commercialized. Furthermore, current market instabilities may topple even the most robust companies. These facts suggest that long-term market leadership has yet to be defined. Current conditions should not obscure future possibilities or discourage the innovation investments needed to realize these possibilities.
Conclusions
Today's PV industry faces a pivotal moment of market oversupply, spurring discussion about long-term investments. Using an industry-validated, bottom-up cost model, we evaluate current (first half 2012) and future siting costs for c-Si PV manufacturing facilities in the U.S. and China, considering the possible roles of advanced technological innovation and supply-chain development. With today's technology, we estimate that a 2-GW Chinese factory enjoys a 23% MSP advantage over a 500-MW U.S. factory. The root of this difference is not the sum of indigenous factors (labour, inflation, equity country-risk premium). Instead, the major differentiators are scale and supply-chain advantages. Regional incentives including provincial subsidies, tax holidays, and low-cost debt may be key enablers for rapid scaling, but they affect MSP less directly.We calculate that innovation could reduce the MSP by 40–50%, while increasing conversion efficiency by 50% (relative). This MSP is low enough to compete without subsidies in large parts of U.S. and Chinese markets, potentially resulting in high PV demand. This could encourage industry growth and spur dramatic scale-up if regions facilitate supply-chain development and access to capital. In this advanced-technology scenario with a highly developed supply chain, MSPs of PV module production in China and the U.S. approach parity.
Given the potentially disruptive impacts of technological innovation and supply-chain development on factory siting decisions, and the need to serve a global customer base, we emphasize the importance of establish manufacturing facilities and R&D networks worldwide, in order to incentivize and maximize global innovation efforts, to lower costs, and to create shareholder value. Because of module shipping costs, local manufacturing could have advantages in future U.S. and Chinese markets. Already today, there is evidence of this shift in downstream fabrication steps, including module assembly.
No PV technology has yet achieved our advanced-technology scenario's combination of cost and performance results; thus the PV industry would be well served to continue innovating toward an MSP that eliminates the need for demand-side subsidies. Such innovations and future outcomes may be best facilitated through collaboration and open access to all markets. In a growing global industry, in which 99% of potential PV panels may not have yet been made, a long-term perspective may be needed to inform critical investment decisions during this temporary period of PV oversupply.
Acknowledgements
We thank John Parsons, Jesse Jenkins, Jonas Nahm, Allyna Nguyen, and Dick Schmalensee (MIT); Bin Fu and Sriram Krishnan; Paul Basore (Hanwha); John Lushetsky, Minh Le and Ramesh Ramamoorthy (DOE); Chung-wen Lan (NTU, Taiwan); and several captains of industry for valuable input. We thank Felice Frankel (MIT) for graphics advice. The DOE supported this work in part under Contract nos DE-EE0005314 and DE-AC36-08GO28308 with the National Renewable Energy Laboratory, with support from the DOE Solar Energy Technologies Program. D.M.P was supported by the Department of Defense through the National Defense Science & Engineering Graduate Fellowship Program; T.B. acknowledges NSF CAREER award ECCS-1150878.Notes and references
- J. Chase, M. Simonek, A. Kim, P. Radoia, M. Wang, R. DeSilva, B. B. Agrawai, L. Goldie-Scot, T. Woodward and K. Bhavnagri, PV Market Outlook Q2 2012, Bloomberg New Energy Finance, New York, 2012 Search PubMed.
- J. Chase, M. Di Capua, A. Kim and W. Nelson, Q1 2012 North America PV Market Outlook, Bloomberg New Energy Finance, New York, 2012 Search PubMed.
- Z. Dobrotkova and M. Waldron, Renewable Energy Medium Term Market Report 2012: Market Trends and Projections to 2017, International Energy Agency, Paris, 2012 Search PubMed.
- M. Hand, S. Baldwin, E. DeMeo, J. Reilly, T. Mai, D. Arent, G. Porro, M. Meshek and D. Sandor, Renewable Electric Energy Futures Study, U.S. Department of Energy, Washington, D.C., 2012, http://www.nrel.gov/analysis/re_futures/ (last accessed: 26 July 2012) Search PubMed.
- R. Margolis, G. Barbose, M. Bolinger, G. Brinkman, C. Coggeshall, K. Cory, P. Denholm, E. Drury, A. Ellis, D. Feldman, J. Gary, A. Goodrich, G. Heath, B. Kroposki, T. Mai, M. Mowers, C. Turchi and J. Zuboy, SunShot Vision Study, U.S. Department of Energy, Washington, D.C., 2012, http://www1.eere.energy.gov/solar/pdfs/47927.pdf (last accessed: 26 July 2012) Search PubMed.
- P. Mints and J. Donnelly, Photovoltaic Manufacturing Shipments, Capacity & Competitive Analysis, Navigant Consulting, Inc., New York, 2012 Search PubMed.
- GTM Wafer/Cell/Module Production Database: 2007-2012, Greentech Media Research, Boston, 2012 Search PubMed.
- P. Penny, European Module Price Index, Sologico, Cologne, 2012, http://www.pvxchange.com/priceindex/Default.aspx?langTag=en-GB (last accessed: 5 Aug 2013) Search PubMed.
- A. de la Tour, M. Glachant and Y. Ménière, Energy Policy, 2011, 39(2), 761–770 CrossRef PubMed.
- D. Bierenbaum, M. M. Frank, M. Lenox and R. Maheshwari, Winning the Green Innovation Economy: An Analysis of Worldwide Patenting, Greentech Innovation Series, University of Virginia, Virginia, 2012, http://www.darden.virginia.edu/web/uploadedFiles/Darden/Batten_Institute/Public ations/Greentech_041212_Email.pdf (last accessed: 10 Aug 2012) Search PubMed.
- 12th Five-Year Plan for the Solar Photovoltaic Industry (translated from an independent outside source), Wiley Rein LLP, Washington, D.C., 2012, http://www.americansolarmanufacturing.org/news-releases/chinas-five-year-plan-for-solar-analysis.pdf (last accessed: 26 July 2012) Search PubMed.
- P. A. Samuelson and W. D. Nordhaus, in Macroeconomics, McGraw-Hill/Irwin, Columbus, 19th edn, 2012 Search PubMed.
- A. Goodrich, P. Hacke, Q. Wang, B. Sopori, R. Margolis, T. James and M. Woodhouse, Sol. Energy Mater. Sol. Cells, 2013, 114, 110–135 CrossRef CAS PubMed.
- D. M. Powell, M. T. Winkler, A. Goodrich and T. Buonassisi, IEEE Journal of Photovoltaics, 2013, 3, 662–668 CrossRef.
- J. V. Busch, Ph.D./Sc.D. Thesis, Massachusetts Institute of Technology, 1987, http://hdl.handle.net/1721.1/15694 (last accessed: 26 July 2012).
- D. M. Powell, M. T. Winkler, H. J. Choi, C. B. Simmons, D. Berney Needleman and T. Buonassisi, Energy Environ. Sci., 2012, 5, 5874–5883 Search PubMed.
- S. A. Ross, R. W. Westerfield and B. D. Jordan, in Fundamentals of Corporate Finance, McGraw-Hill/Irwin, Columbus, 9th edn, 2012 Search PubMed.
- M. Osborne, Suntech threatened with NYSE delisting, PV Tech.org, London, 2012, http://www.pv-tech.org/mobile/news/suntech_threatened_with_nyse_delisting (last accessed: 3 October 2012) Search PubMed.
- A. Back, China Statistics Bureau: Urban Wages Rose By Double Digits In 2011, Wall Street Journal, New York, 2012, http://online.wsj.com/article/SB10001424052702303807404577433782002769066.html (last accessed: 26 July 2012) Search PubMed.
- V. Bajaj, Bangladesh, With Low Pay, Moves In on China, New York Times, New York, 2012, The New York Times. 16 July 2012, http://www.nytimes.com/2010/07/17/business/global/17textile.html (last accessed: 26 July 2012) Search PubMed.
- N. Cattan and E. Martin, Mexico Replaces China as U.S. Supplier With No Wage Gains: Jobs, Bloomberg, New York, 2012, http://www.bloomberg.com/news/2012-06-14/mexico-replaces-china-as-u-s-supplier-with-no-wage-gains-jobs.html (last accessed: 26 July 2012) Search PubMed.
- N. Chowdhury, The China Effect, Time, New York, 2012, http://www.time.com/time/magazine/article/0,9171,2065153,00.html (last accessed: 26 July 2012) Search PubMed.
- Bureau of Labor Statistics, Industry-Specific Occupational Employment and Wage Estimates: NAICS 334400 – Semiconductor and Other Electrical Component Manufacturing, U.S. Department of Labor, Washington. D.C., 2011 Search PubMed.
- M. Schmela, Market Survey: Diffusion Furnaces, Photon International, Boston, 2005, vol. 8, pp. 56–54 Search PubMed.
- M. Schmela, Market Survey: Diffusion Furnaces, Photon International, 2006, vol. 8, pp. 82–89 Search PubMed.
- M. Schmela, Market Survey: Diffusion Furnaces, Photon International, 2007, vol. 8, pp. 136–143 Search PubMed.
- S. K. Chunduri, Market Survey: Diffusion Furnaces, Photon International, 2008, vol. 8, pp. 204–220 Search PubMed.
- S. K. Chunduri, Market Survey: Diffusion Furnaces, Photon International, 2009, vol. 8, pp. 144–171 Search PubMed.
- S. K. Chunduri, Market Survey: Diffusion Furnaces, Photon International, 2010, vol. 8, pp. 260–283 Search PubMed.
- S. K. Chunduri, Market Survey: Diffusion Furnaces, Photon International, 2011, vol. 8, pp. 304–326 Search PubMed.
- K. Liu and K. Daly, Int. J. Bus. Manag., 2011, 6(7), 15–27 Search PubMed.
- A. Fedec, and A. Sousa, Economic Indicators (U.S. and China): Inflation Rate as measured by each country's respective Consumer Price Index (C.P.I.), Trading Economics, New York, 2012, http://www.tradingeconomics.com/ (last accessed: 26 July 2012) Search PubMed.
- D. Zimmerman, China Costs Start to Worry U.S. Multinationals, Thomson Reuters, New York, August 2011, http://www.reuters.com/article/2011/08/12/us-usa-manufacturing-china-idUSTRE77B2IV20110812 (last accessed: 26 July 2012) Search PubMed.
- J. Liu and H. Yang, Science, 2009, 325, 675–676 CrossRef CAS PubMed.
- T. Orlik, China's Price Claws Could Still Scratch, Wall Street Journal, New York, 2012, http://online.wsj.com/article/SB10001424052702303772904577332712191425568. html (last accessed: 5 Aug 2012) Search PubMed.
- T. Ogier, J. Rugman and L. Spicer, in The Real Cost of Capital: a Business Field Guide to Better Financial Decisions, Financial Times Prentice Hall, 2004 Search PubMed.
- P. Fernandez, J. Aguirreamalloa and L. Corres, Market Risk Premium Used in 82 Countries in 2012: A Survey with 7,192 Answers, Social Science Research Network, 2012, http://papers.ssrn.com/sol3/papers.cfm?abstract_id=2084213 (last accessed: 26 July 2012) Search PubMed.
- J. M. Poterba and L. H. Summers, A CEO survey of U.S. companies' time horizons and hurdle rates, MIT Sloan Management Review, Cambridge, 1995, vol. 37(1), pp. 43–53 Search PubMed.
- International Cost of Capital, Morningstar-Ibbotson, Chicago, 2012 Search PubMed.
- R. Randazzo, Rundown of incentives First Solar will receive, Arizona Republic, Phoenix, 2012, http://www.azcentral.com/business/articles/20110409first-solar-incentives.html (last accessed: 5 Aug 2013) Search PubMed.
- Suntech (NYSE: STP) 2011 Annual Report, Suntech Power Holdings Co., Ltd., Wuxi, 2012, http://ir.suntech-power.com/phoenix.zhtml?c=192654&p=irol-reportsAnnual (last accessed: 26 July 2012) Search PubMed.
- LDK (NYSE: LDK) 2011 Annual Report, LDK Solar, Jiangxi, 2012, http://investor.ldksolar.com/phoenix.zhtml?c=196973&p=irol-reportsannual (last accessed: 5 Aug 2013) Search PubMed.
- K. S. Markle and D. Shackelford, Do Multinationals or Domestic Firms Face Higher Effective Tax Rates?, NBER Working Paper No. 15091, National Bureau of Economic Research, Cambridge, 2009, http://www.nber.org/papers/w15091.pdf (last accessed 26 July 2012) Search PubMed.
- Database of solar PV manufacturer debt deals (2007–2011), Bloomberg New Energy Finance desktop tool, New York, 2012 Search PubMed.
- D. L. Su, Journal of Management Decisions, 2010, 48(2), 314–339 CrossRef.
- R. C. Anderson, S. A. Mansi and D. M. Reeb, Managerial Ownership and Behavior: The Impact on Corporate Creditors, Temple University, Philadelphia, 2006, http://astro.temple.edu/~dreeb/Mgr%20Ownership%20and%20Behavior%20-%20Corporate%20Creditors.pdf (last accessed: 26 July 2012) Search PubMed.
- CBRC staff, Part Two: Banking Reform and Opening Up, Chinese Banking Regulatory Commission 2010 Annual Report, Beijing, 2010, http://zhuanti.cbrc.gov.cn/subject/subject/nianbao2010/english/2.pdf (last accessed: 26 July 2012) Search PubMed.
- J. Nahm and E. S. Steinfeld, Reinventing Mass Production: China's Specialization in Innovative Manufacturing, October 9, 2012, MIT Political Science Department Research Paper Working Paper 2012-25, DOI:10.2139/ssrn.2159429.
- Y. Cao, Chinese PV Manufacturing Begins to Consolidate, Bloomberg New Energy Finance, New York, 2012 Search PubMed.
- G. P. Pisano and W. C. Shih, Restoring American Competitiveness, Harvard Business Review, 2009, vol. 87(7/8), pp. 114–125 Search PubMed.
- U.S. International Trade Commission, Certain Aluminum Extrusions from China, US ITC Investigation Nos. 701-TA-475 and 731-TA-1177 (Preliminary) Publication, Washington, D.C., 2012, http://www.usitc.gov/publications/701_731/pub4153.pdf (last accessed: 15 Aug 2012) Search PubMed.
- INSEAD staff, The 2012 Global Innovation Index (database), INSEAD University, New York, 2012, http://www.globalinnovationindex.org/userfiles/file/GII-2012-Report.pdf (last accessed: 5 Aug 2013) Search PubMed.
- J. Dedrick, K. L. Kraemer and G. Linden, Journal of International Commerce and Economic, 2009, 19(1), 81–116 Search PubMed.
- Corporate press release, SunPower Announces New Solar Panel Manufacturing Facility, San Jose, 2011, http://us.sunpowercorp.com/about/newsroom/press-releases/?relID=48865 (last accessed: 15 Aug 2012) Search PubMed.
- International Energy Agency and International Renewable Energy Agency Joint Policies and Measures (database), International Energy Agency, Paris. 2012, http://www.iea.org/policiesandmeasures/renewableenergy/ (last accessed 4 September 2012) Search PubMed.
- R. Kirk, 2012 Special 301 Report, Section II Country Reports: China, Executive Office of the President of the United States, Office of the United States Trade Representative, Washington, D.C., 2012 Search PubMed.
- A. Louw, Global Renewable Electricity Installations, Bloomberg New Energy Finance, New York, 2012 Search PubMed.
- Existing Capacity by Energy Source-form: EIA-860, Generator Y10 File, Energy Information Administration, Washington, D.C., 2012, http://www.eia.gov/electricity/data/eia860/index.html (last accessed: 6 September 2012) Search PubMed.
- Planned Generating Capacity Additions: Generator Y10 File, Energy Information Administration, Washington, D.C., 2012 Search PubMed.
- Global Total Generation Capacity, Energy Information Administration, Washington, D.C., 2012 Search PubMed.
- E. Wesoff, DOD Must Buy American-Made, Not Chinese, Solar Panels, 2011, http://www.greentechmedia.com/articles/read/dod-must-buy-american-made-not-chinese-solar-panels/ (last accessed: 6 May 2013) Search PubMed.
- Database of State Incentives for Renewables & Efficiency, Incentives/Policies for Renewables & Efficiency, http://www.dsireusa.org/incentives/index.cfm (last accessed: 5 Aug 2013).
- A. Kim, Polysilicon Prices Continue Downhill Trend after Record Low, Bloomberg New Energy Finance, 2012 Search PubMed.
- N. Choudhury, China increases solar target by 67% – yet again, PV-Tech.org, London, 2013 Search PubMed.
- Product datasheet: SunmoduleTM, Solar World, Camarillo, 2012, http://www.solarworld-usa.com/solar-for-business-andgovernment/products-and-services/~/media/Global/PDFs/datasheets/sunmodule-solar-panel-255-mono-ds.pdf (last accessed: 26 July 2012) Search PubMed.
- Product datasheet: Optimus Series (Opt 60 Cell) Modules datasheet, Suniva, Norcross, 2012, http://www.suniva.com/monocrystalline-modules.php (last accessed: 26 July 2012) Search PubMed.
- Suntech Product datasheet: STP 190S-24/Adb+, Suntech, Wuxi, 2012, http://www.altestore.com/mmsolar/Others/stp190s_24adb_Datasheet.pdf (last accessed: 5 Aug 2013) Search PubMed.
- JA Solar Product datasheet: JA Solar JAM5(L) 72/190-215 Solar PV Module datasheet, JA Solar, Shanghai, 2012, http://www.jasolar.com/uploads/files/201204/20120411163031_fSqHz2.pdf (last accessed: 26 July 2012) Search PubMed.
- Yingli Product datasheet: Yingli Panda 60 Cell Series Module datasheet. Yingli, Baoding, 2012, http://www.yinglisolar.com/assets/uploads/products/downloads/2012_PANDA_60.pdf (last accessed: 5 Aug 2013) Search PubMed.
- SunPower Product datasheet: E20 Series Module, SunPower, San Jose, 2012, http://us.sunpowercorp.com/homes/products-services/solar-panels/e-series/ (last accessed: 26 July 2012) Search PubMed.
- SunPower Sunpower (NYSE: SPWR) 2011 Annual Report, SunPower, San Jose, 2012, http://investors.sunpowercorp.com/annuals.cfm (last accessed: 24 October 2012) Search PubMed.
- L. Story, T. Fehr and D. Watkins, United States of Subsidies: Explore the Data (interactive map and database), The New York Times, New York, 2012 Search PubMed.
- C. Somayaji and R. Landberg, China Development Bank Renews Solar Support, Journal Says, Bloomberg News, New York, 2012, http://www.bloomberg.com/news/2012-09-25/chinese-lender-supports-solar-companies-securities-journal-says.html (last accessed: 28 September 2012) Search PubMed.
Footnotes |
| † Electronic supplementary information (ESI) available. See DOI: 10.1039/c3ee40701b |
| ‡ From 2008–2011, the average selling price of PV modules has declined more than 60%, corresponding with increased scales of manufacturing across the supply chain, technological improvements, and unbalanced supply and demand (weaker-than-expected global demand, lower than anticipated polysilicon-feedstock prices).6,63 While shipments from China and Taiwan are aggregated by the source of this data (Mints & Donnelly 2012), the remainder of this analysis focuses on manufacturing costs, policies, and production trends of firms located in the People's Republic of China. |
| § We acknowledge the simplicity of this bilateral analysis. Additional notable regions with high innovation, manufacturing, and/or deployment potential include Taiwan, Malaysia, Germany, Japan, and Mexico. |
| ¶ Regional module efficiency ranges are based on product datasheets for best-available modules from the top three U.S.- and China-based c-Si PV module manufacturers by shipments:2 SunPower, Solar World, and Suniva in the U. S.; Suntech, JA Solar, and Yingli in China.65–69 The highest efficiency commercially available c-Si cell today is manufactured in the Philippines and Malaysia, while the company's R&D takes place in the U.S.7,70,71 |
| || Since January 2008, the average spread of China's CPI over the U.S. CPI was 140 bps; excluding the period from August 2008 to June 2010 (the global recession), this average spread was 270 (S1, Methods†).32 |
| ** Sector risk (levered-equity beta), country-risk (country-risk beta), and equity market risk premium (global equity market risk premium) factors are multiplicative, thus raising the cost of equity: cost of equity = global risk free rate + levered-equity beta × country-risk beta × global equity market risk premium (S1, Methods, eqn (2)–(7)†).36 |
| †† Using the Fisher equation, the real cost of debt = [(1 + nominal cost of debt)/(1 + rate of inflation)] − 1, where the rate of inflation is based on the CPI for each country.17,32,36 |
| ‡‡ Between January and July 2008, seven deals totaling more than $2.3 billion in loans were issued to six domestic PV manufacturers in China at real rates between −2.2% and −5.2% (ref. 44) (S1, Methods, Fig. 6†). |
| §§ China's most recent (12th) Five Year Plan calls for strengthening innovation and development of PV—objectives that provide a credible motivation for offering domestic manufacturers access to low-cost debt.11,73 |
| ¶¶ In 2011, twenty eight c-Si PV manufacturers in China had module manufacturing capacities in excess of 500 MW.49 |
| |||| Chinese PV companies are encouraged to “strengthen the application of locally-manufactured equipment” and promote “technical cooperation and exchanges between equipment enterprises and PV enterprises”.11 |
| *** Deployment of solar energy, including PV, in China is expected to reach 35 GW by 2015, and 50 GW by 2020.3,64 |
| ††† With the advanced-technology scenario, PV may lose some of its modularity. For instance, thin wafers may be mounted onto laminates, which are processed into cells using a process flow reminiscent of thin-film technology.16 We do not explore this scenario in detail but note its potential. |
| ‡‡‡ This may include the U.S. and China as well as nearby countries such as Mexico and Malaysia. |
| This journal is © The Royal Society of Chemistry 2013 |